This sub-section presents visually engaging, data-driven narratives that simplify complex environmental challenges such as waste management, water systems, and circular economy transitions. It translates technical analysis into accessible insights, supporting awareness, stakeholder engagement, and informed decision-making.
This compendium showcases practical case studies and analytical tools that support the transition towards zero waste and circular economy systems. Through integrated approaches combining water, waste, resource efficiency, and urban metabolism assessments, the initiative promotes evidence-based planning, knowledge sharing, and scalable solutions for sustainable urban development.
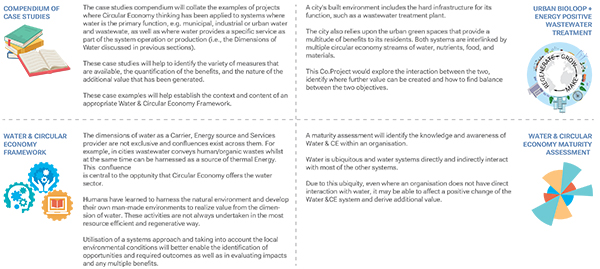
Compendium of Case Studies Showcases practical examples and lessons learned from cities and projects applying zero waste and circular economy approaches. The case studies highlight how integrated planning and systems thinking can generate environmental, social, and economic benefits across urban contexts.
Water & Circular Economy
Explores the relationship between water management and circular economy systems, emphasizing resource efficiency, reuse, and sustainable infrastructure. The framework supports cities in identifying opportunities to optimise water use while reducing waste and improving resilience.
Urban Biodiversity – Energy Positive Wastewater Treatment
Demonstrates innovative approaches that connect wastewater treatment, biodiversity conservation, and energy recovery. The assessment highlights how urban infrastructure can contribute to cleaner environments, renewable energy generation, and ecosystem restoration.
Water & Circular Economy Maturity Assessment
Provides assessment tools and methodologies to evaluate institutional readiness, policy integration, and implementation capacity for circular economy transitions. The framework enables organisations and cities to identify gaps, strengthen governance, and support evidence-based decision-making.
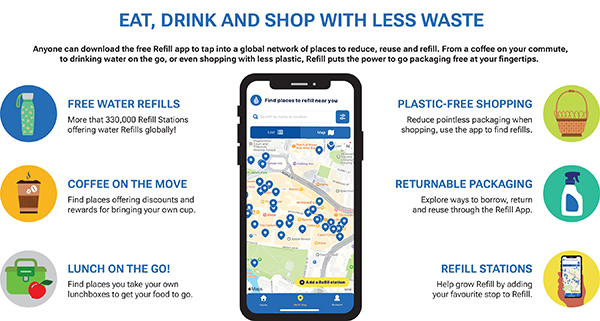
This infographic highlights how digital tools and consumer choices can help reduce waste in everyday life through refill and reuse systems. The Refill App connects users to a global network of locations offering free water refills, reusable packaging options, and plastic-free shopping alternatives. It encourages sustainable habits such as carrying reusable coffee cups and lunchboxes to reduce single-use waste. By promoting refill stations and returnable packaging, the initiative supports circular economy practices and responsible consumption. The platform demonstrates how accessible technology can empower communities to minimise waste while making sustainable living more convenient and affordable.
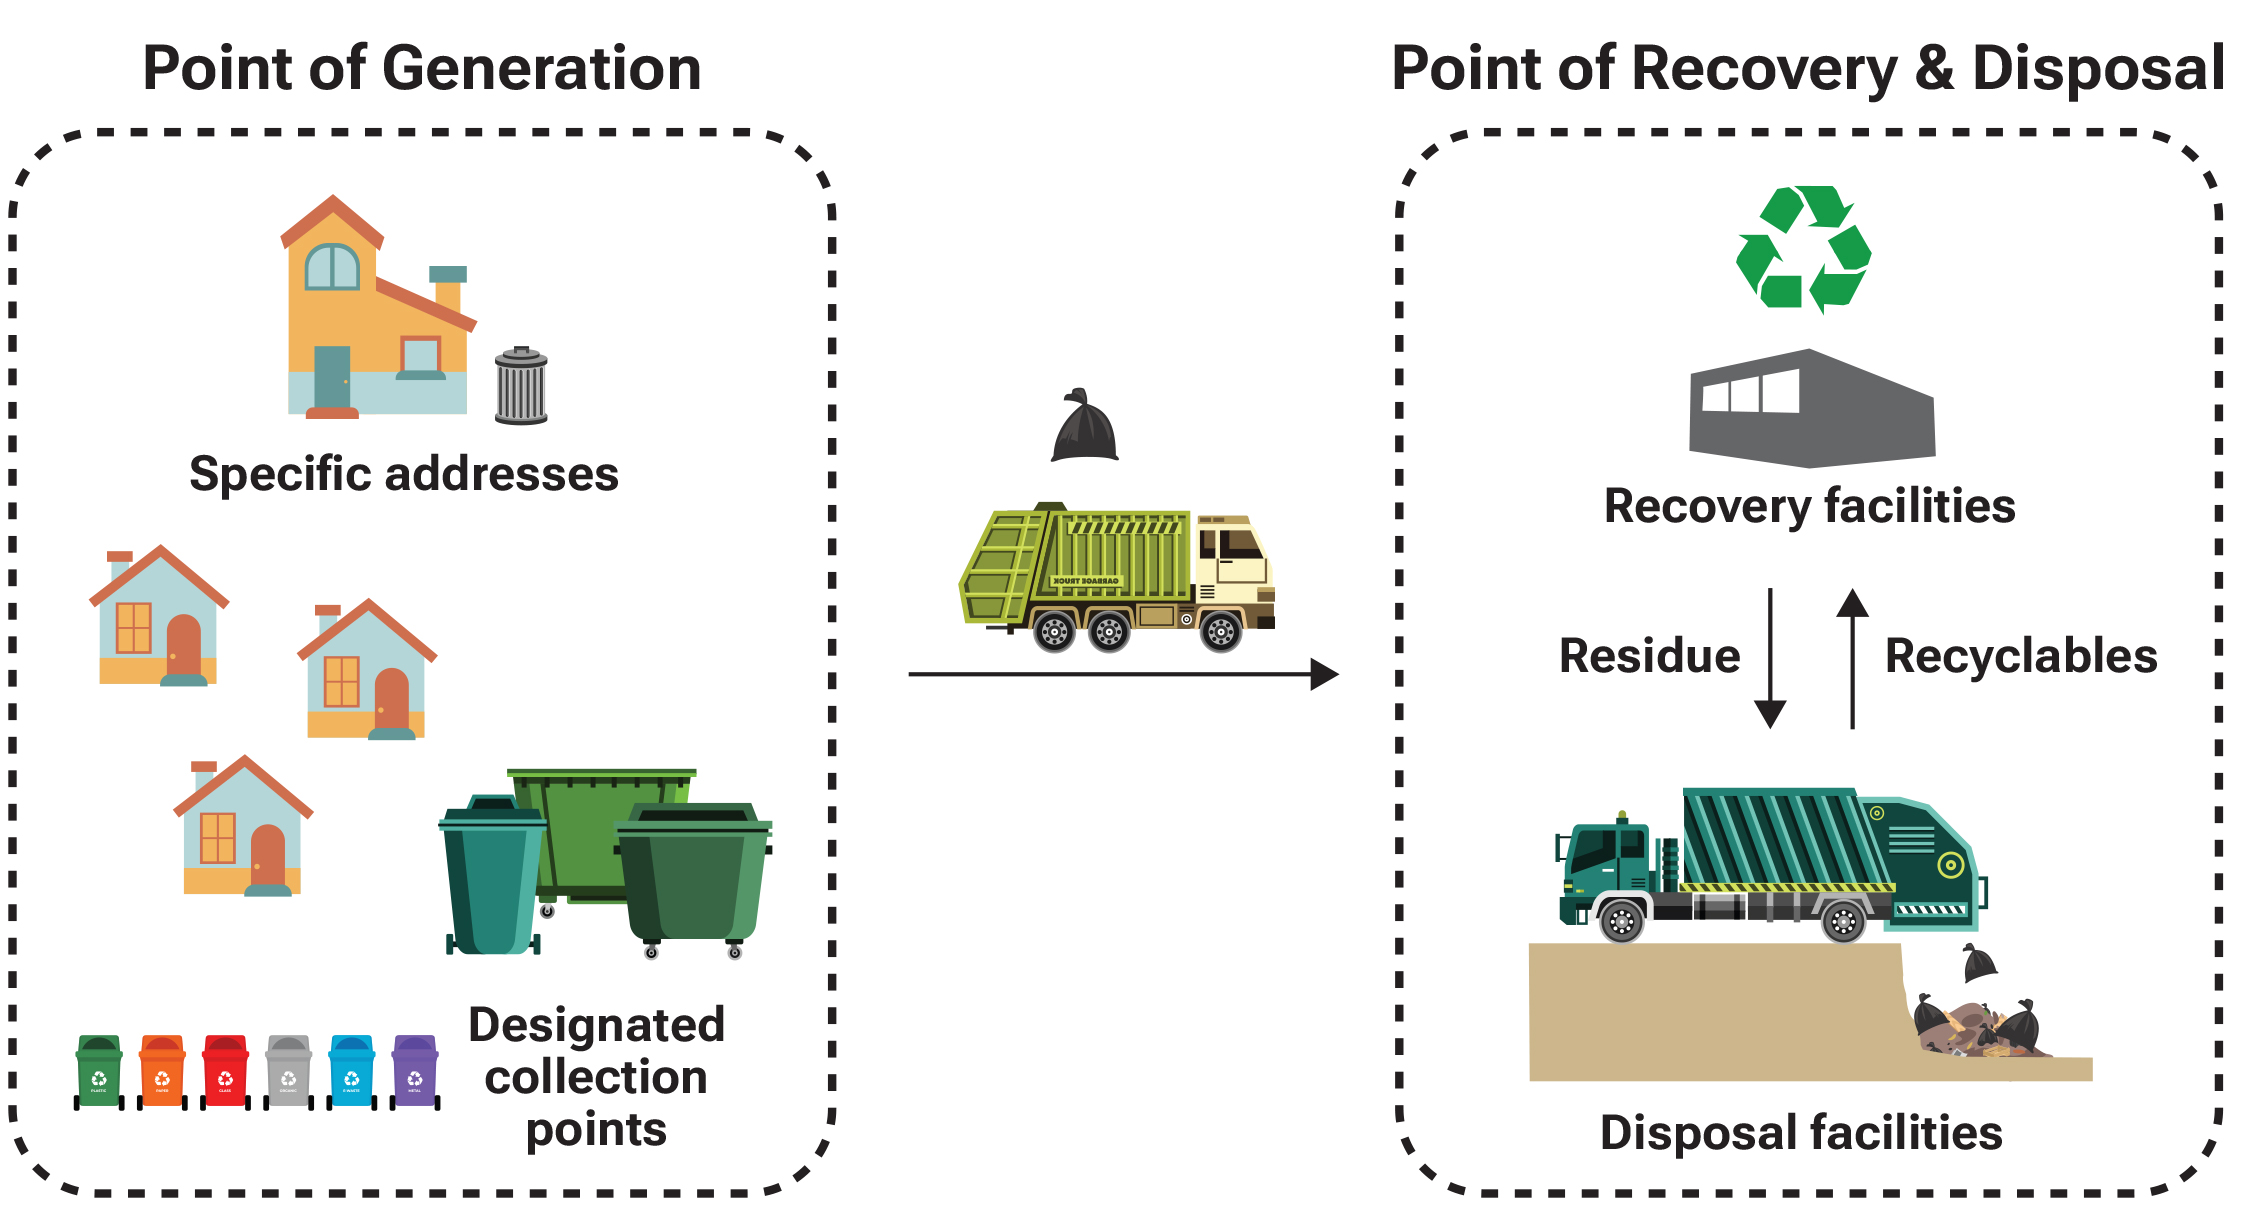
This infographic illustrates the flow of waste management from the point of generation to recovery and final disposal. Waste is generated across households, commercial areas, and institutions before being collected and transported through organised collection systems. Recyclable materials are directed towards recycling facilities to support resource recovery and circular economy practices. Non-recyclable waste is transported to disposal facilities for treatment and safe management. The framework highlights the importance of integrated waste collection, segregation, recycling, and disposal systems in reducing landfill dependency and improving environmental sustainability.
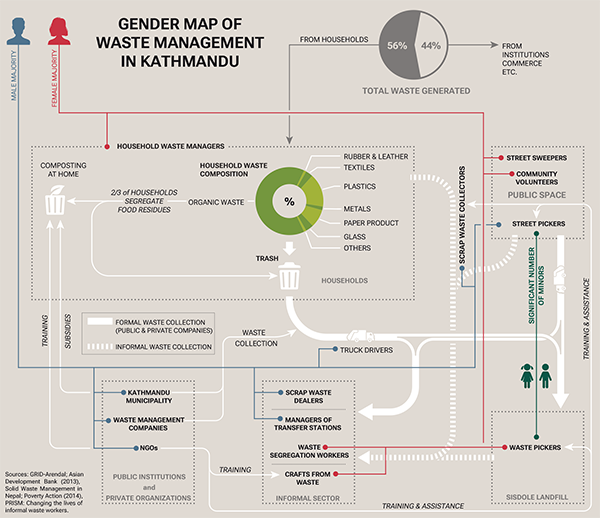
The infographic presents a gender map of waste management in Kathmandu, Nepal, showing how different actors both men and women participate across the waste management system from households to disposal. It highlights that households are the primary source of waste, with about 56% coming from households and 44% from institutions and commerce. At the household level, many residents segregate food waste and practice composting, while other waste streams such as plastics, metals, paper, and glass enter the collection system.
The diagram also illustrates the roles of formal and informal workers. Municipal authorities, waste management companies, and organisations handle formal collection and management, while the informal sector including waste pickers, scrap dealers, and recycling workers plays a significant role in material recovery and recycling. Gender distinctions appear in tasks such as household waste management, street sweeping, and informal recycling activities.
Overall, the infographic emphasizes that waste management in Kathmandu is a multi-layered system involving households, municipal services, community actors, and informal workers, with gendered roles influencing how waste is collected, sorted, recycled, and ultimately disposed of at the Sisdole landfill.
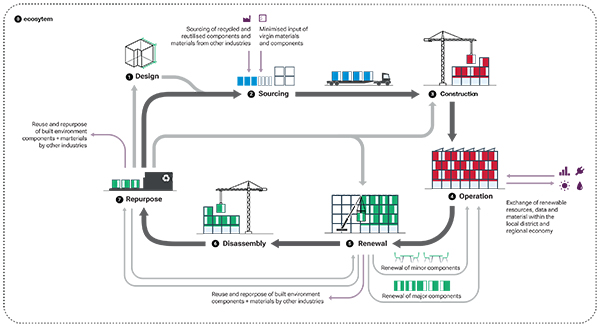
The infographic illustrates how digitalisation and changing work patterns are transforming office buildings and urban workspaces, a trend observed strongly in developed economies such as the United Kingdom and parts of Europe where flexible working models are increasingly common.
The visual shows a multi-storey office building transitioning from traditional office use to more flexible and technology-driven spaces. With the digitalisation of information and the shift toward paperless systems, the need for physical storage and fixed office spaces is decreasing. Instead of companies renting entire floors, multiple organisations or teams can share workspaces, making buildings more efficient and adaptable.
Technological advancements such as high-speed connectivity, digital platforms, and remote working tools enable employees to work from different locations within or outside the building, reducing the demand for permanent desks. As a result, office environments are evolving to include collaborative areas, flexible meeting spaces, and shared facilities.
The infographic also reflects broader societal changes in countries adopting these models. For instance, remote work and flexible schedules reduce commuting needs, potentially lowering traffic congestion and environmental impacts. At the same time, changing work patterns influence urban planning, housing choices, and lifestyle preferences, as people may no longer need to live close to central business districts.
Overall, the infographic highlights how digital transformation, workplace flexibility, and sustainability considerations are reshaping the future of office buildings, particularly in advanced economies where digital infrastructure and new work cultures are well established.
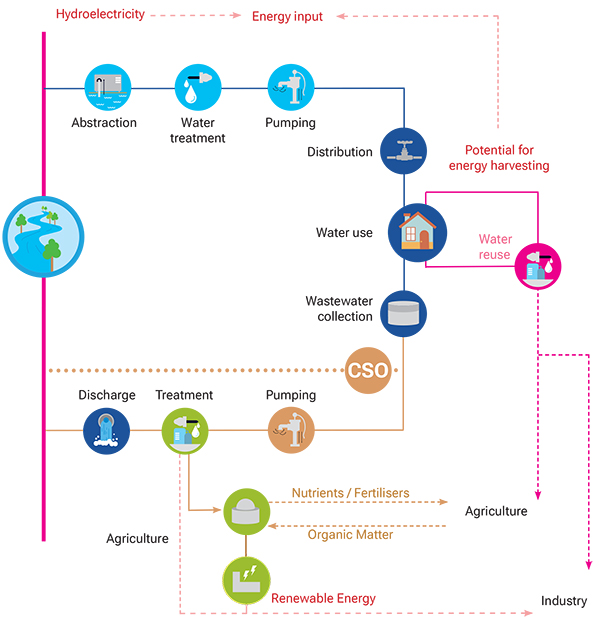
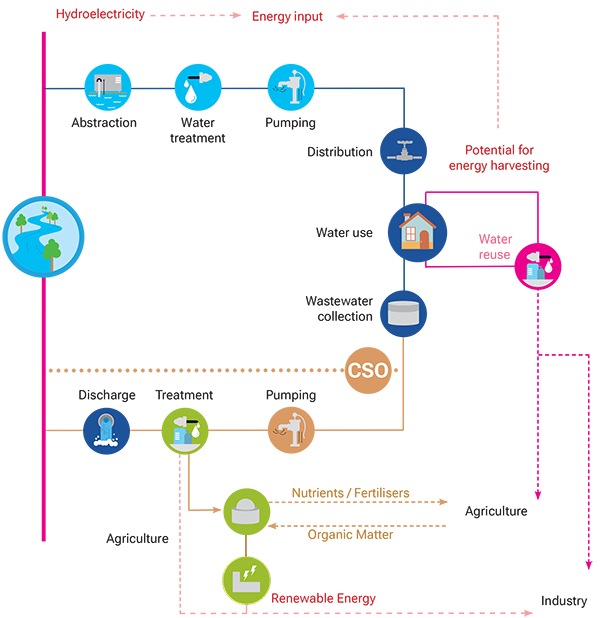
The figure illustrates a circular approach to urban water management, showing how water flows through stages of abstraction, treatment, pumping, distribution, use, wastewater collection, and treatment. Energy inputs, such as hydroelectricity, support the system, while opportunities exist to recover value from wastewater. Instead of treating wastewater as a waste stream, the model highlights possibilities for water reuse, energy generation, and nutrient recovery. Treated outputs can supply agriculture, industry, and renewable energy production, while organic matter and nutrients can be converted into fertilizers. Overall, the figure demonstrates how integrating water, energy, and resource recovery can transform conventional water systems into circular, resource-efficient infrastructures.