


2.b.3 Total GHG emissions
General information
The circular economy indicator GHG emissions from production activities is considered difficult to calculate due to data unavailability. For this reason, a proxy indicator is proposed: Total GHG emissions, that corresponds to SDG 13.2.2.
The presented methodology for this indicator is based on UNSD’s Metadata for 13.2.2. SDG target 13.2 aims to integrate climate change measures into national policies, strategies and planning.
Indicator interpretation
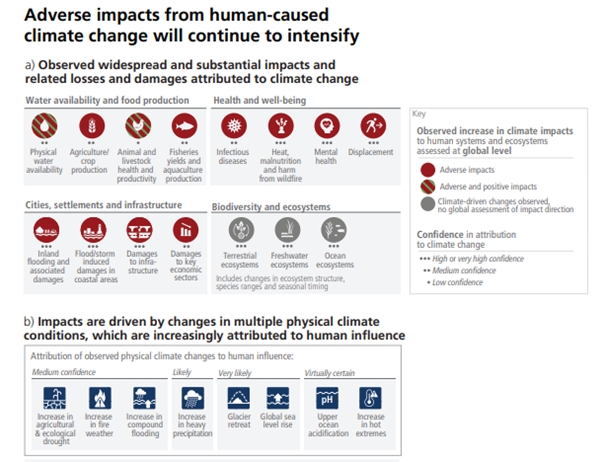
Climate change has already caused widespread impacts and related losses and damages on human systems and altered terrestrial, freshwater and ocean ecosystems worldwide. Observed impacts are connected to physical climate changes, including many that have been attributed to human influence such as the selected climatic impact-drivers shown in Figure 2. 73.
The ultimate objective of the Climate Change Convention (UNFCCC) is to achieve the stabilization of greenhouse gas concentrations in the atmosphere at a level that would prevent dangerous anthropogenic interference with the climate system. Estimating the levels of greenhouse gas (GHG) emissions and removals is an important element of the efforts to achieve this objective.
The Paris Agreement adopted in 2015 marks the latest step in the evolution of the UN climate change regime and builds on the work undertaken under the Convention. Its central aim is to strengthen the global response to the threat of climate change by keeping a global temperature rise this century well below 2 degrees Celsius above pre-industrial levels and to pursue efforts to limit the temperature increase even further to 1.5 degrees Celsius. The Agreement also aims to strengthen the ability of countries to deal with the impacts of climate change.
The Agreement classified countries as Annex I Parties and Non-Annex I Parties35. Annex I Parties include the industrialized countries that were members of the OECD in 1992, plus countries with economies in transition (the EIT Parties), including the Russian Federation, the Baltic States, and several Central and Eastern European States. Non-Annex I Parties36 are mostly developing countries. Certain groups of developing countries are recognized by the Convention as being especially vulnerable to the adverse impacts of climate change, including countries with low-lying coastal areas and those prone to desertification and drought. Others (such as countries that rely heavily on income from fossil fuel production and commerce) feel more vulnerable to the potential economic impacts of climate change response measures.
Data availability
Countries that are Annex I Parties to the Climate Change Convention (UNFCCC) submit the annual GHG inventory to the Climate Change secretariat through the CRF Reporter application. Information is automatically imported in the UNFCCC Data Warehouse. The UNFCCC reporting guidelines on annual inventories for Annex I Parties require each Annex I Party to provide its annual GHG inventory by 15 April each year.
Greenhouse gas emissions and removals included in national inventories are a result of human activities. The distinction between natural and anthropogenic emissions and removals follows straightforwardly from the data used to quantify human activity. In the Agriculture, Forestry and Other Land Use (AFOLU) sector, emissions and removals on managed land are taken as a proxy for anthropogenic emissions and removals, and interannual variations in natural background emissions and removals, though these can be significant, are assumed to average out over time.
|
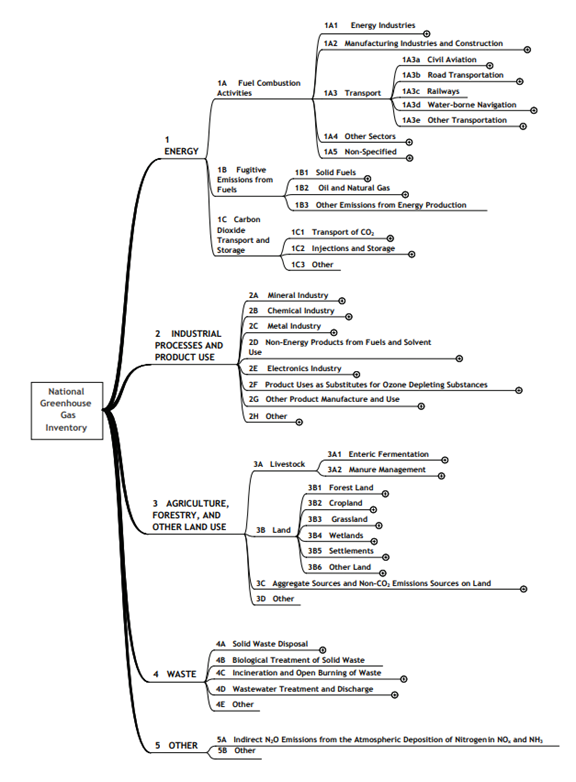
National GHG inventory National inventories include greenhouse gas emissions and removals taking place within national territory and offshore areas over which the country has jurisdiction. They contain estimates for the calendar year during which the emissions to (or removals from) the atmosphere occur. Where suitable data to follow this principle are missing, emissions/removals may be estimated using data from other years applying appropriate methods such as averaging, interpolation and extrapolation. Greenhouse gas emission and removal estimates are divided into main sectors, which are groupings of related processes, sources and sinks: Energy; Industrial Processes and Product Use (IPPU); Agriculture, Forestry and Other Land Use (AFOLU); Waste; Other (e.g., indirect emissions from nitrogen deposition from non-agriculture sources). Each sector comprises individual categories (e.g., transport) and sub-categories (e.g., cars). Ultimately, countries will construct an inventory at sub-category level, and total emissions calculated by summation. A national total is calculated by summing up emissions and removals for each gas. An exception is emissions from fuel use in ships and aircraft engaged in international transport which is not included in national totals, but is reported separately. National GHG inventory reporting A greenhouse gas inventory report includes a set of standard reporting tables covering all relevant gases, categories and years, and a written report that documents the methodologies and data used to prepare the estimates. The 2006 Guidelines provide standardised reporting tables, but the actual nature and content of the tables and written report may vary according to, for example, a country’s obligations as a Party to the UNFCCC. Reporting is generally organised according to the sector generating emissions or removals. There are some exceptions to this practice, such as CO2 emissions from biomass combustion for energy, which are reported in AFOLU sector as part of net changes in carbon stocks. Where CO2 emissions are captured from industrial processes or large combustion sources, emissions should be allocated to the sector generating the CO2 unless it can be shown that the CO2 is stored in properly monitored geological storage sites. The following table is the summary table reported by each country. 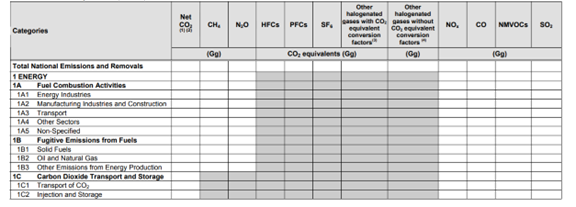 |
Under the Enhanced Transparency Framework, Parties to the Paris Agreement are required to submit biennial transparency reports (BTR) every two years, including a national inventory report (NIR) of anthropogenic emissions by sources and removals by sinks of greenhouse gases (GHGs).
The NIR may be submitted as a stand-alone report or as a component of a BTR. Parties should submit their first NIR, either in conjunction with the BTR o or as a stand-alone report, in accordance with the modalities, procedures and guidelines (MPGs), at the latest by 31 December 2024. Parties to the Paris Agreement, submitting annual national inventory reports under the Convention shall use the MPGs for national inventory reports in years for which a BTR is not due.
Limitations in the use of the indicator
One of the main limitations in the use of this indicator is related to data availability as already described.
Secondly, total GHG emissions encompass the entire economy and do not provide information about emissions from specific production activities (see Figure 2. 74), making them difficult to monitor.
The unit of measure of this indicator is the CO2-equivalent emission, which is the amount of carbon dioxide emissions that would have an equivalent effect on a specified key measure of climate change, over a specified time horizon, as an emitted amount of another greenhouse gas (GHG) or a mixture of other GHGs. For a mix of GHGs, it is obtained by summing up the CO2-equivalent emissions of each gas. It is important to consider that even if CO2-equivalent emissions are commonly used to compare emissions of different GHGs, it should not be taken to imply that these emissions have an equivalent effect across all key measures of climate change (IPCC, 2023. Climate Change 2023: Synthesis Report).
Definitions
“Carbon dioxide-equivalent is a measure used to compare different greenhouse gases based on their contribution to radiative forcing. The UNFCCC currently (2024) uses global warming potentials (GWPs) as factors to calculate carbon dioxide equivalent” (IPCC Guidelines for National GHG Inventories).
“Emissions is the release of greenhouse gases and/or their precursors into the atmosphere over a specified area and period of time” (UNFCCC Article 1.4)
“Global Warming Potentials (GWP) are calculated as the ratio of the radiative forcing of one kilogramme greenhouse gas emitted to the atmosphere to that from one kilogramme CO2 over a period of time (e.g., 100 years)” (IPCC Guidelines for National GHG Inventories).
“Hydrofluorocarbons (HFCs) Halocarbons containing only hydrogen, fluorine and carbon atoms. Because HFCs contain no chlorine, bromine, or iodine, they do not deplete the ozone layer. Like other halocarbons, they are potent greenhouse gases” (IPCC Guidelines for National GHG Inventories).
“Methane (CH4) is a hydrocarbon that is a GHG with a global warming potential estimated at 28 according to the IPCC AR5. Methane is produced through anaerobic (without oxygen) decomposition of waste in landfills, animal digestion, decomposition of animal wastes, production and distribution of natural gas and petroleum, coal production, and incomplete fossil fuel combustion” (FDES).
“Nitrous oxide (N2O) A powerful GHG with global warming potential evaluated at 265. Major sources of nitrous oxide include soil cultivation practices, especially the use of commercial and organic fertilizers, fossil fuel combustion, nitric acid production, and biomass burning” (FDES).
“Perfluorocarbons (PFCs) is a synthetically produced halocarbons containing only carbon and fluorine atoms. They are characterized by extreme stability, non-flammability, low toxicity, zero ozone depleting potential, and high global warming potential” (IPCC Guidelines for National GHG Inventories).
“Sulphur hexafluoride (SF6) is a colourless gas soluble in alcohol and ether, slightly soluble in water. A very powerful GHG used primarily in electrical transmission and distribution systems and as a dielectric in electronics. The global warming potential of SF6 is 23,500. Nitrogen trifluoride (NF3) (not included in FDES) A colourless, odourless, non-flammable gas. A very powerful GHG used primarily in microelectronics. The global warming potential of NF3 is 16,100” (FDES).
Calculations
Total GHG emissions are calculated as the sum of emissions of direct GHGs:
- Carbon dioxide (CO2)
- Methane (CH4)
- Nitrous oxide (N2O)
- Perfluorocarbons (PFCs)
- Hydrofluorocarbons (HFCs)
- Sulphur hexafluoride (SF6) and
- Nitrogen trifluoride (NF3)
As with the 1996 Guidelines and IPCC Good Practice Guidance, the most common simple methodological approach is to combine information on the extent to which a human activity takes place (called activity data or AD) with coefficients which quantify the emissions or removals per unit activity. These are called emission factors (EF). The basic equation is therefore:
- Emissions = AD × EF
For example, in the energy sector fuel consumption would constitute activity data, and mass of carbon dioxide emitted per unit of fuel consumed would be an emission factor. The basic equation can in some circumstances be modified to include other estimation parameters than emission factors37. Where time lags are involved, due for example to the time it takes for material to decompose in a landfill or leakage of refrigerants from cooling devices, other methods are provided, for example first order decay methods. The 2006 Guidelines also allow for more complex modelling approaches.
For the indicator calculation, all gases are measured in units of CO2-equivalent, by using a common weighting factor, the so-called Global Warming Potentials (GWP). Annex II provides 100-year time horizon global warming potential (GWP) values from the Intergovernmental Panel on Climate Change (IPCC). It is adapted from the IPCC Sixth Assessment Report, 2020 (AR6). The AR6 values are the most recent and recommended to use38.
Methodology for calculating GHG inventories is available at 2006 IPPC Guidelines for National Greenhouse Gas Inventories39.
|
The 2006 IPCC Guidelines contain 5 volumes, one for each sector (Volumes 2-5) and one for general guidance applicable to all sectors (Volume 1).
|
The Total GHG emissions tab can be used to calculate this indicator. Users will insert data on gas emissions (in CO2-equivalent) for each year, and the tab will calculate the total emissions automatically (see Figure 2. 75).

37 The emissions factor database is available at https://www.ipcc-nggip.iges.or.jp/EFDB/main.php.
38 The GWP are available at Microsoft Word - Global-Warming-Potential-Values.docx.
39 The GWP are available at Microsoft Word - Global-Warming-Potential-Values.docx.