
Measuring Progress Towards a Pollution-free Planet
An SDG lens on Pollution
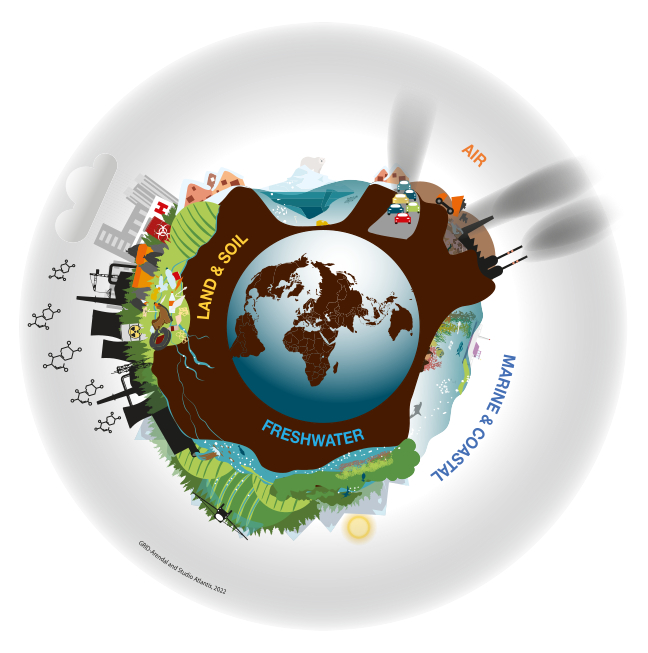
In response to the call to track progress towards a cleaner planet, this webpage provides an overview of global pollution using a set of pollution-relevant Sustainable Development Goals indicators and other complementary global indicators, organized according to the driver-pressure-state-impact-response (DPSIR) framework, and actions to address pollution.

The 2030 Agenda contains 17 Sustainable Development Goals (SDGs), all of which are associated with pollution directly or indirectly. Achieving sustainable development across the 17 goals is inseparable from overcoming threats to the environment including climate change, biodiversity loss and pollution. The 2030 Agenda aims to “leave no one behind”: this is crucial in the context of pollution, because often pollution hits more strongly the poor and more vulnerable and marginalized. Given the strong association of the SDGs with pollution reduction and given the universality of this framework, relevant SDG indicators and data play a key role in measuring progress towards a pollution-free Planet.
The DPSIR Indicator Framework
The indicators and related data have been categorized according to the drivers, pressures, state, impact and response (DPSIR) methodology. The DPSIR framework “provides a structure within which to present the indicators needed to enable feedback to policy makers on environmental quality and the resulting impact of the political choices made, or to be made in the future. The DPSIR framework assumes a chain of causal links starting with ‘driving forces’ (economic sectors, human activities) through ‘pressures’ (emissions, waste) to ‘states’ (physical, chemical and biological) and ‘impacts’ on ecosystems, human health and functions, eventually leading to political ‘responses’ (prioritization, target setting, indicators)."
Learn more about the indicator framework and explore by topic:
Pollution Indicator Framework
The indicators and related data in this analysis have been categorized according to the drivers, pressures, state, impact and response (DPSIR) framework.
Click here to learn more about the pollution indicator framework

Air Pollution
Air pollution, which kills more than 7 million people every year, is the biggest environmental health risk of our time.
Click here to see the air pollution indicator framework

Freshwater Pollution
Fresh water pollution originates from many sources, including municipal, industrial and agricultural waste, wastewater and nutrient run-off, power generation, heavy industry, automobiles, and others.
Click here to see the freshwater pollution indicator framework
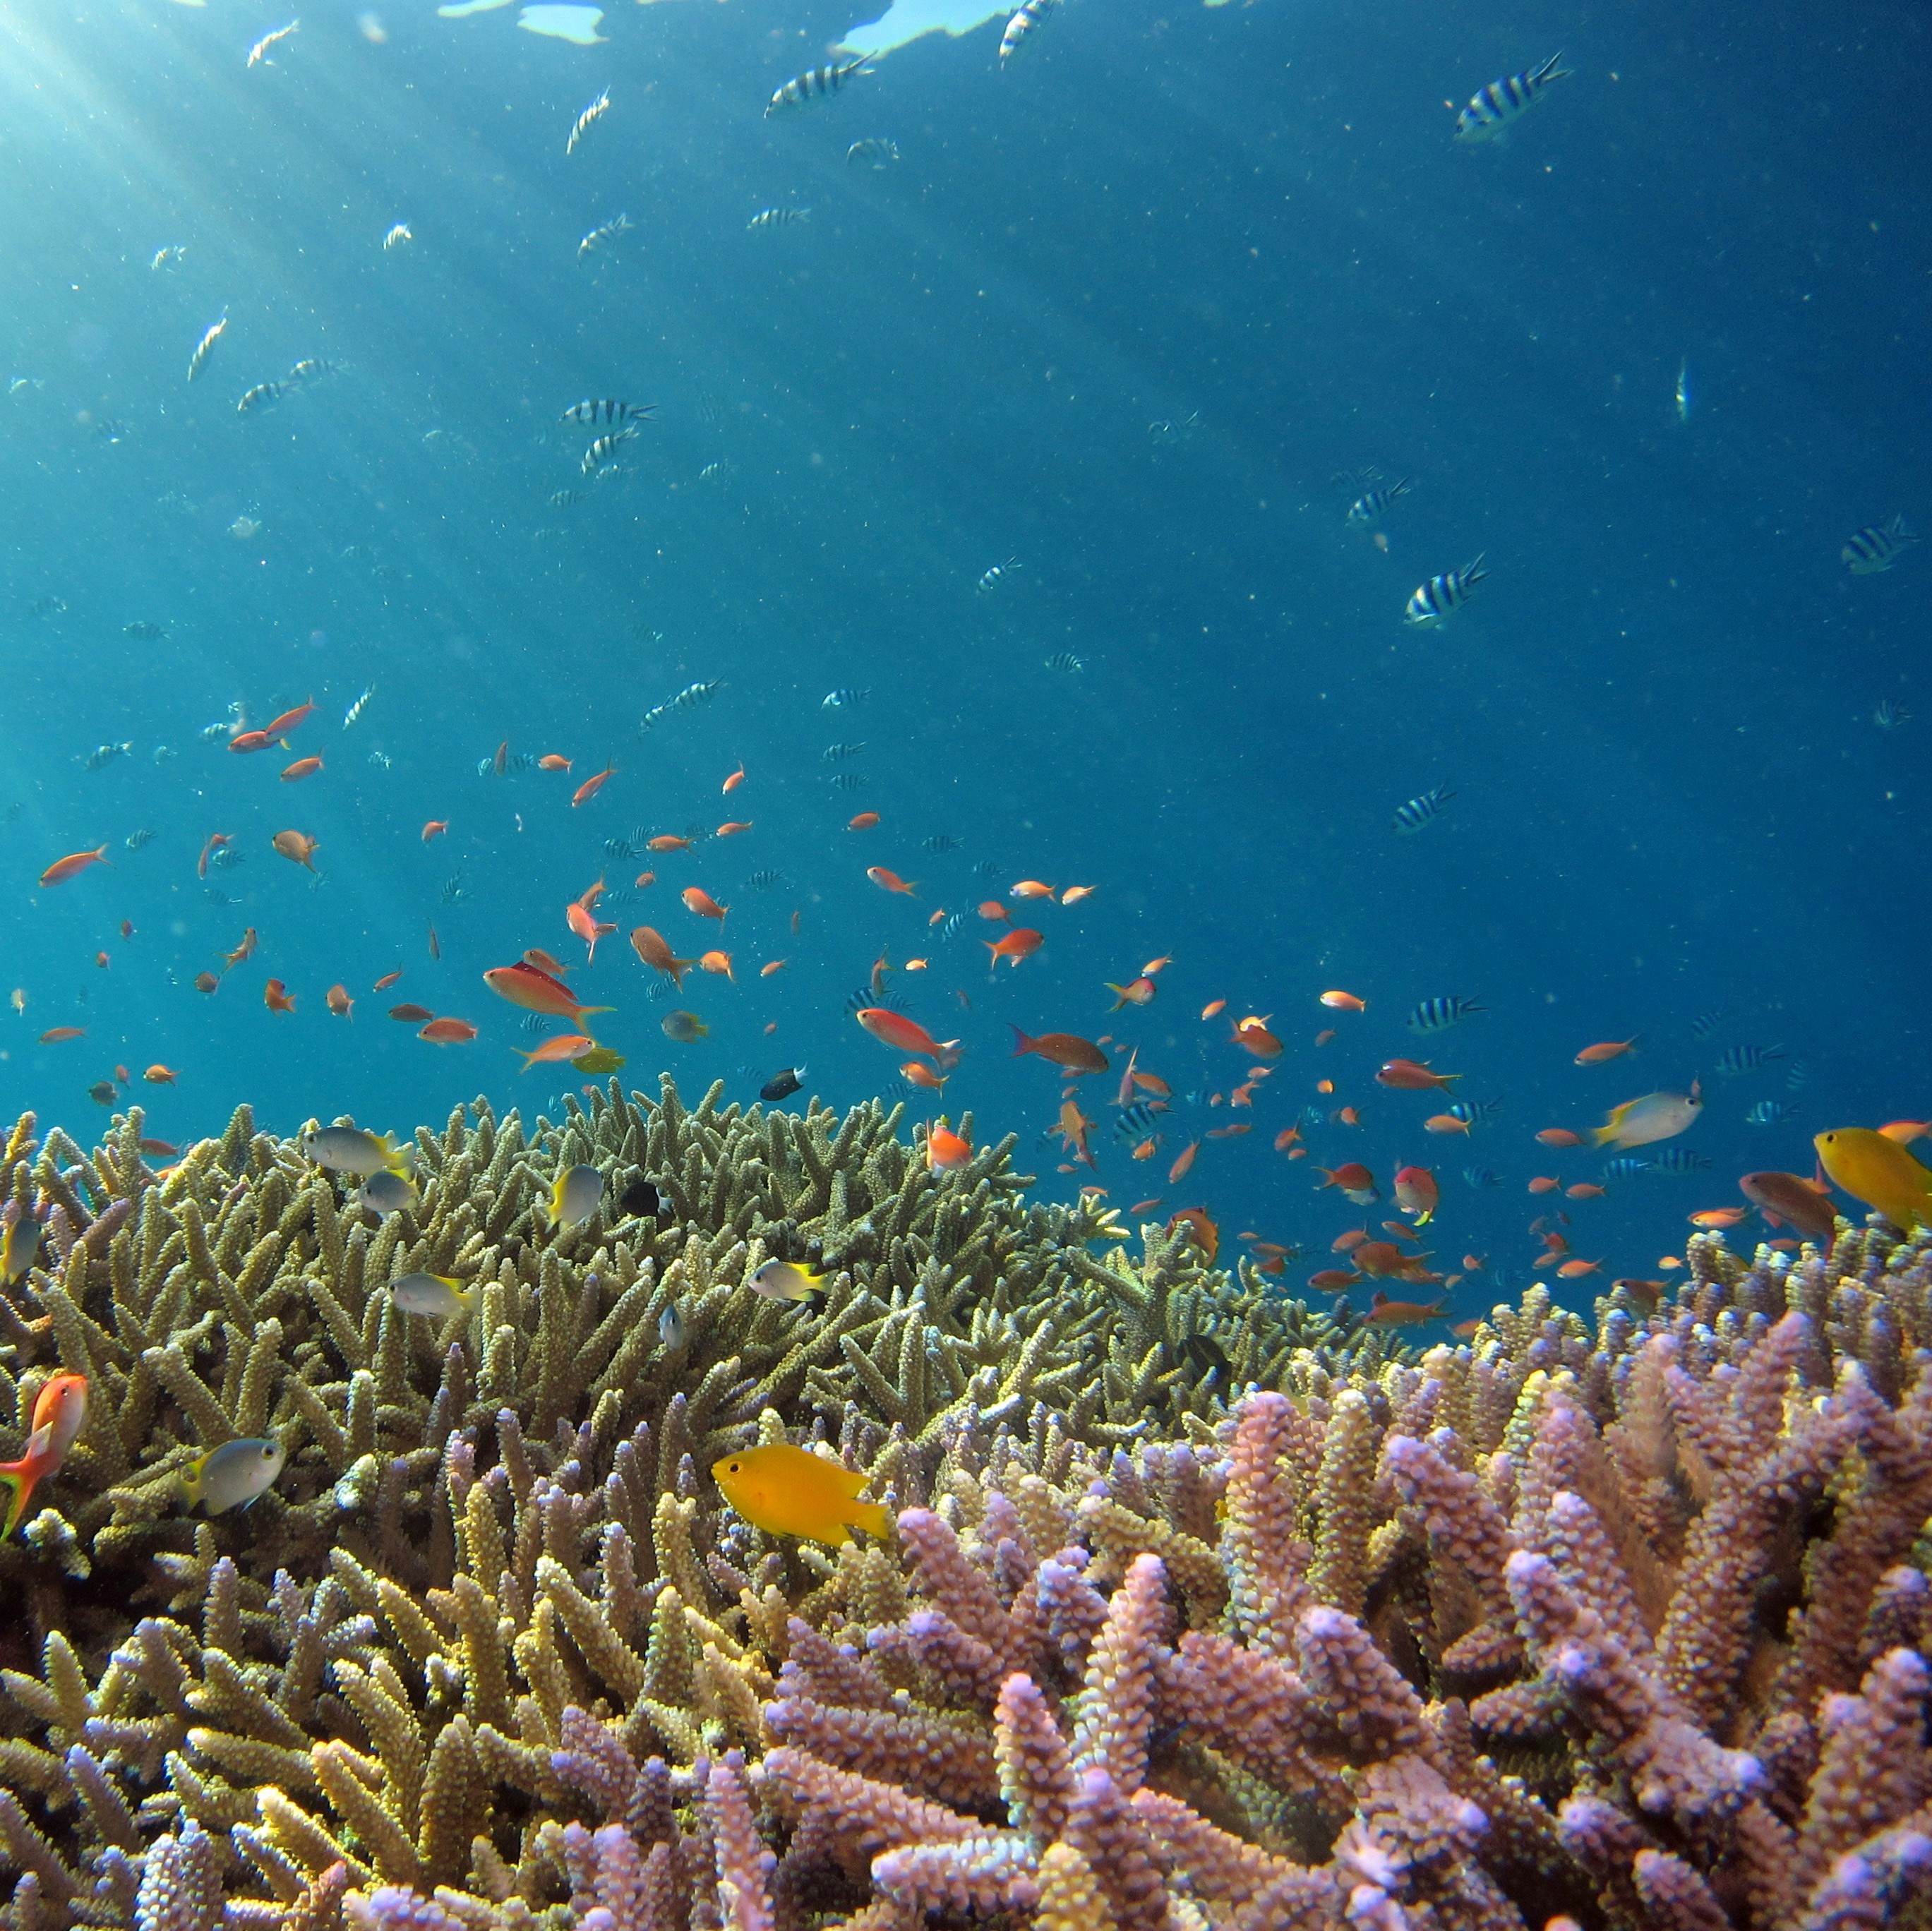
Marine and Coastal Pollution
The continuous growth in the amount of solid waste that human generates and the very slow rate at which that waste degrades are together leading to a gradual increase in the amount litter found at sea, on the seafloor and along coastlines around the world.
Click here to see the marine and coastal pollution indicator framework

Land and Soil Pollution
Healthy soils regulate waterflow, filter pollutants, cycle nutrients and support plant and animal diversity. Land a and soil pollution dramatically disrupt this delicate balance, with far-reaching consequences on human and ecosystem survival
Click here to see the land and soil pollution indicator framework

Chemicals and Waste
Humans use over 100,000 different chemical elements and compounds, including lead, mercury, cadmium and persistent organic pollutants, and nearly 30 per cent of the food produced worldwide is lost or wasted every year.
Click here to see the chemical and waste pollution indicator framework
Pollution and health▼ (click to expand and learn more)
Pollution is the largest environmental risk factor for disease and premature death globally. According to the Lancet Commission on pollution and health (Fuller et al. 2022), it is responsible for some 9 million premature deaths per year, or almost one in six deaths worldwide, with more than 90 per cent of pollution-related deaths occurring in low- and middle-income countries (LMICs). The report indicates that in 2019, air pollution – both household and ambient or outdoor – was estimated to be responsible for the largest number of such deaths (6.7 million), water pollution for 1.4 million, and lead for 900,000, while toxic occupational hazards (excluding workplace fatalities due to safety hazards) were responsible for 870,000. However, the report cautioned that these estimates are likely under-representative due to a lack of comprehensive health data.
Non-communicable diseases (NCDs) account for 74 per cent of all deaths globally (World Health Organization [WHO] 2023a). Air pollution is a principal cause of non-communicable diseases globally (Campbell-Lendrum and Prüss-Ustün 2019; Prüss-Ustün et al. 2019; Howse et al. 2021). Air pollutants with the strongest evidence for adverse health impacts include particulate matter, carbon monoxide, ozone, nitrogen dioxide and sulphur dioxide, with children, elderly, and pregnant women at the highest risk for disease from air pollution (WHO 2023b).
According to the 2021 Global Methane Assessment (CCAC 2021), a 45 per cent reduction in emissions of methane (CH4), one of the SLCPs, would prevent an estimated 260,000 premature deaths and 775,000 asthma-related hospital visits per year, as well as 73 billion hours of lost labour from extreme heat and 25 million metric tons (Mt) of crop losses. Renard et al. (2022) have reported correlations between fine particulate matter (PM2.5) peaks and COVID-19 mortality in Western European countries between 2020 and 2022.
Almost the entire global population (around 99 per cent) breathes air that exceeds the World Health Organization’s air quality limits (WHO 2022). Better air quality can improve both health and quality of life (“cleaner environment, healthier people”) (Organisation for Economic Co-operation and Development [OECD] 2020; EEA 2022). Susceptibility to pollution exposure can be reduced through programmes that reduce poverty and improve health care access (Deryugina et al. 2021).
Vulnerable people, including women, children, the elderly and the poor, are often those most at risk from the adverse health effects of pollution (many people in the world belong to two or more of these categories) (UNEP 2018a; United Nations International Children's Fund (UNICEF) 2020; UNEP 2021c; Clarke et al. 2022). In many parts of the world, women and girls continue to be disproportionately affected by pollution when they cook with wood (and other solid fuels) or transport fuel and safe drinking water long distances (UNEP 2018b; Ho et al. 2021; Dida et al. 2022; Sani and Scholz 2022). Gender differences in exposure to different types of pollution can often be at least partially estimated, but such estimates may be limited by a shortage of gender-disaggregated data (Prüss-Ustün et al. 2016; Haddad et al. 2021; OECD 2021).
Some pollutants, such as endocrine disrupting chemicals (EDCs) which may be found in the air, water, soil, food sources and in user products can disturb endocrinology, metabolism and microecology, resulting in reproductive diseases, birth defects and offspring growth retardation (UNEP 2019a; Frontiers in Environmental Chemistry 2022). Though no commonly accepted criteria for identification of EDCs exists, known endocrine-disrupting chemicals include, among others, polychlorinated biphenyls (PCBs), dichlorodiphenyltrichloroethane (DDT), polybrominated diphenyl ethers (PBDEs) and some phthalates (UNEP and WHO 2013). EDCs are ubiquitous in the environment; they affect not only humans but also livestock and wildlife (UNEP and WHO 2013; UNEP 2017b; Gonsioroski, Mourikes and Flaws 2020; Endocrine Society 2023; WHO 2023c).
One category of endocrine disrupting chemicals, PFAS (per- and polyfluoroalkyl substances), are associated with negative health effects including cancer, liver damage, decreased fertility, and increased risk of asthma and thyroid disease (Harvard T.H. Chan School of Public Health [Harvard] 2016; Harvard 2018; OECD 2022a, OECD 2022b; United States Agency for Toxic Substances and Diseases Registry 2022). Even if PFAS were no longer being manufactured and used, exposure to these chemicals would continue to have an adverse impact on human health and on the environment, where they are extremely persistent (Straková, Schneider and Cingotti 2021).
From source extraction to waste, people are exposed to a wide range of harmful chemicals and to microplastics, through inhalation, ingestion, and direct skin contact (UNEP 2021d; Wiesinger, Wang and Hellweg 2021; Center for International Environmental Law 2022; Geneva Environment Network 2022; Rotchell et al. 2023). For example, chemicals such as phthalates found in plastic consumer products are known EDCs and have been associated with testosterone production interference, asthma and allergies in children, cardiovascular disease, type 2 diabetes, hypertension, and obesity (United Nations Environment Programme and Secretariat of the Basel, Rotterdam and Stockholm Conventions 2023a).
E-waste is one of the largest, fastest growing, and most complex waste streams in the world. The many toxic substances they contain present risks to human health and the environment, above all the large share of this waste which is not properly collected, treated and recycled (Forti et al. 2020; Parvez et al. 2021; WHO2021b).
As per the World Health Organization (WHO), AMR ranks among the top ten global health threats; projections indicate that by the year 2050, there could be as many as 10 million annual deaths attributed to this issue, impacting economies and pushing more people into poverty. In a recent report titled "Bracing for Superbugs: Strengthening environmental action in the One Health response to antimicrobial resistance (AMR)," published by UNEP, it is emphasized that AMR in humans and animals has key environmental dimensions; the sectors responsible for driving AMR include pharmaceuticals and other chemicals, agriculture, food production, and healthcare. Additionally, the presence of pollutants from inadequate sanitation, sewage, and waste discharge within municipal systems significantly influences the development and dissemination of AMR, ultimately affecting the long-term efficacy of antimicrobials in safeguarding human, animal, crop, and environmental well-being (UNEP 2023a).
Pollution's adverse economic and social impacts▼ (click to expand and learn more)
Pollution adversely affects the economy and livelihoods globally (Damania et al. 2019; Centre for Research on Pollution and Clean Air [CREA] 2020; Food and Agriculture Organization of the United Nations and UNEP 2021; CREA and Greenpeace Asia 2022; United Nations Economic Commission for Europe [UNECE] n.d.) and reinforces socioeconomic inequalities (Yang and Liu 2018; Rentschler and Leonova 2022). In 2019 the global health cost of mortality and morbidity due to exposure to fine particulate matter (PM2.5) alone was estimated to be the equivalent to 6.1 per cent of global gross domestic product (GDP) (World Bank 2022).
Using a different methodology, a study addressing the specific country level impact of air pollution on sustainable development, focusing on three countries in Africa found that economic output lost to air pollution-related disease in Ethiopia, Ghana and Rwanda in 2019 ranged from 0.95 per cent to 1.19 per cent of these countries’ gross domestic product (GDP), representing a total loss of hundreds of millions to billions of dollars (UNEP 2021d) . A similar study focusing on India found that in 2019 premature deaths and morbidity attributable to air pollution accounted for economic losses of USD 28.8 billion (USD 21.4-37.4 billion) and USD 8 billion (USD 5.9-10.3 billion), respectively. This loss of some USD 36.8 billion (USD 27.4-47.7 billion) was equivalent to 1.36 per cent of India’s GDP (India State-Level Disease Burden Initiative Air Pollution Collaborators 2021).
Pollution and the right to a clean, healthy and sustainable environment▼ (click to expand and learn more)
The right to a clean, healthy and sustainable environment was recognized by the UN Human Rights Council in Resolution 48/13 in 2021 (United Nations Human Rights Council [UNHRC] 2021) and by the UN General Assembly the following year in Resolution 76/300 (United Nations General Assembly [UNGA] 2022). The resolution (76/300) highlighted that the impact of climate change, the unsustainable management and use of natural resources, the pollution of air, land and water, the unsound management of chemicals and waste has negative implications for the effective enjoyment of all human rights.
The realization of this right is not possible in a polluted world.
A report by the Special Rapporteur on the issue of human rights obligations relating to the enjoyment of a safe, clean, healthy and sustainable environment (Special Rapporteur on Human Rights and the Environment), with the collaboration of the Special Rapporteur on the implications for human rights of the environmentally sound management and disposal of hazardous substances and wastes (Special Rapporteur on Toxics and Human Rights), has described “the ongoing toxification of people and the planet, which is causing environmental injustices and creating ‘sacrifice zones’, extremely contaminated areas where vulnerable and marginalized groups bear a disproportionate burden of the health, human rights and environmental consequences of exposure to pollution and hazardous substances” (UNHRC 2022). The Special Rapporteur on Human Rights and the Environment’s report to the 52nd session of the UN Human Rights Council in 2023 highlighted that the triple planetary crisis, combined with systemic gender-based discrimination, patriarchal norms and inequality, are imposing distinct and disproportionate harms on women and girls, threatening and violating their human rights, including the right to a clean, healthy and sustainable environment (UNHRC 2023).
Indicator Framework
In response to the call to track progress towards a cleaner planet, this framework provides an overview of global pollution using a set of pollution-relevant Sustainable Development Goals indicators and other complementary global indicators, organized according to the driver-pressure-state-impact-response (DPSIR) framework, and actions to address pollution.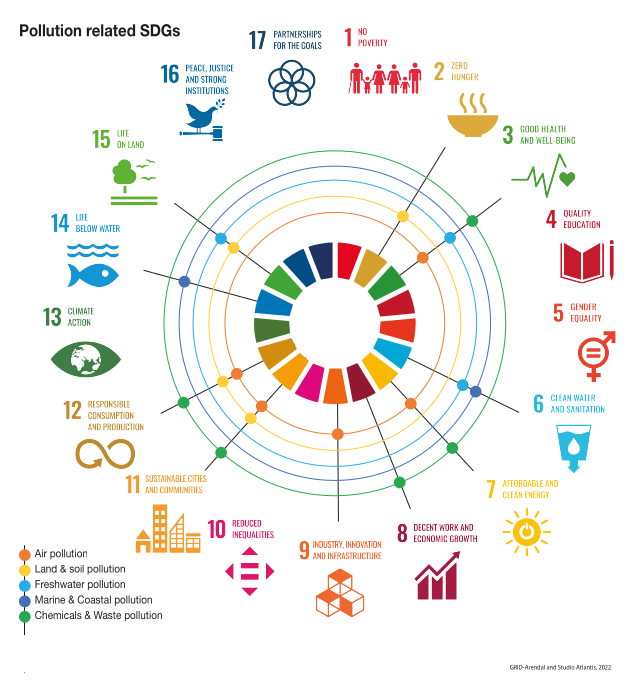 The framework is used to categorize indicators in order to identify how actions (drivers and pressures) are impacting the state of the environment and human well-being (state and impact), and what governmental interventions are doing (response) to reduce drivers and pressures and alleviate their impact on humans and the environment. The indicator framework's main objective is to assess the current global and regional state of pollution, and the subsequent assessment also identified recommendations for action that may guide various stakeholders in closing the pollution gaps for 2030.
The DPSIR framework assumes a chain of causal links starting with ‘driving forces’ (economic sectors, human activities) through ‘pressures’ (emissions, waste) to ‘states’ (physical, chemical and biological) and ‘impacts’ on ecosystems, human health and functions, eventually leading to political ‘responses’ (prioritization, target setting, indicators).
The data sources used in the preparation of this framework include:
- The Global Sustainable Development Goal (SDG) Indicator Platform (Global SDG Indicator Platform 2022)
- The UN Statistics Division’s Open SDG Data Hub (UNSD [United Nations Statistics Division] 2022)
- The World Environment Situation Room (WESR), UNEP’s on-line data and knowledge platform (UNEP 2023)
- Other relevant sources
These sources were identified as valuable in terms of data availability, data comparability and continuous reporting. Data used range from 1990 till the most updated year at the time of analysis, but coverage varies depending on each indicator. Data were extracted from the Global SDG Indicators Database and WESR on 12 April 2022. The indicators and related data have been categorized according to the drivers, pressures, state, impact and response (DPSIR) methodology. The DPSIR framework “provides a structure within which to present the indicators needed to enable feedback to policy makers on environmental quality and the resulting impact of the political choices made, or to be made in the future.
Data use the report is based on the SDG indicators framework and UNEP’s World Environment Situation Room database and presented by M49 Regional grouping. These sources are valuable in terms of data availability, data comparability and continuous reporting. The subsequent updates of both databases were not considered in this analysis due to the time needed to perform the statistical analysis and develop this report.
Methodology (Click to expand and learn more)
The DPSIR framework is used as the basis for identifying and categorizing pollution related indicators into drivers, pressures, state, impact and response. The below figure (A-1) depicts the nature of the relationships between the various components of the DPSIR framework.br
Figure A 1 Visualizing the DPSIR Framework to be inserted
Although most of the indicators considered in this framework are SDG and WESR indicators, an assessment was made to differentiate between direct and indirect indicators, by adopting the concept of drivers of change. Drivers of change are defined as “all those external factors that affect (either positively or negatively) nature, anthropogenic assets, nature’s contributions to people and good quality of life” (IPBES, 2019). Drivers are divided into two categories; direct are factors related to direct human influences upon nature while indirect are factors behind human choices that affect nature (IPBES, 2019). For the purpose of this report, only direct indicators were considered as part of the analysis. Historical data are used, based on data availability to identify the trends of the selected indicators and present the current status in the regions.
In addition to the DPSIR framework, this report uses outcome targets and procedural or means of implementation targets that were adapted from the OECD paper on “An SDG-based results framework for development co-operation” (Engberg-Pedersen & Zwart, 2018; Results Team of the Development Co-operation Directorate, 2016). The main objective of using this results-based framework is to provide additional insight on the progress of Agenda 2030 and assess targets’ progress. It is however worth noting that the DPSIR framework is at the indicator level, while the results-based framework is at the target level, and this was differentiated in the analysis provided in the sections on Indicator-based global situation of pollution.
The international policy frameworks section provides insight on the international and regional agreements that are related to pollution. A thorough review was made to available international and regional agreements to date to identify and categorize them based on their respective pollution topic. The objective is to link science to policy and assess their complementarity and impact. In addition, governments, businesses and civil society have voluntarily committed to reduce pollution at UNEA that took place in December 2017 in Kenya while other countries have committed in their voluntary national reviews to the 2030 Agenda on Sustainable Development. These commitments were reviewed, categorized and analyzed by pollution theme to assess national commitments and/or priorities in each region in terms of addressing pollution. To complement the commitments, a review of existing pollution-related multilateral agreements was made to provide a holistic approach for understanding the state of pollution: past and current data, available international and regional policies, and countries’ commitments. This holistic approach assists in identifying the gaps and challenges faced in combating pollution and paves the way for suggesting recommendations of actions.
An expert group workshop, including internal and external pollution experts was convened for two days to identify the gaps and challenges faced by countries and regions in addressing pollution. Experts contributed, based on their expertise, to the recommendations for actions to complement the previously identified actions. Recommendations resulting from the expert meeting are presented, with additional research, in part IV of the report.
Indicator Framework: Air Pollution
See the data below:
see detailedinformation ▼ or search the most up to date data
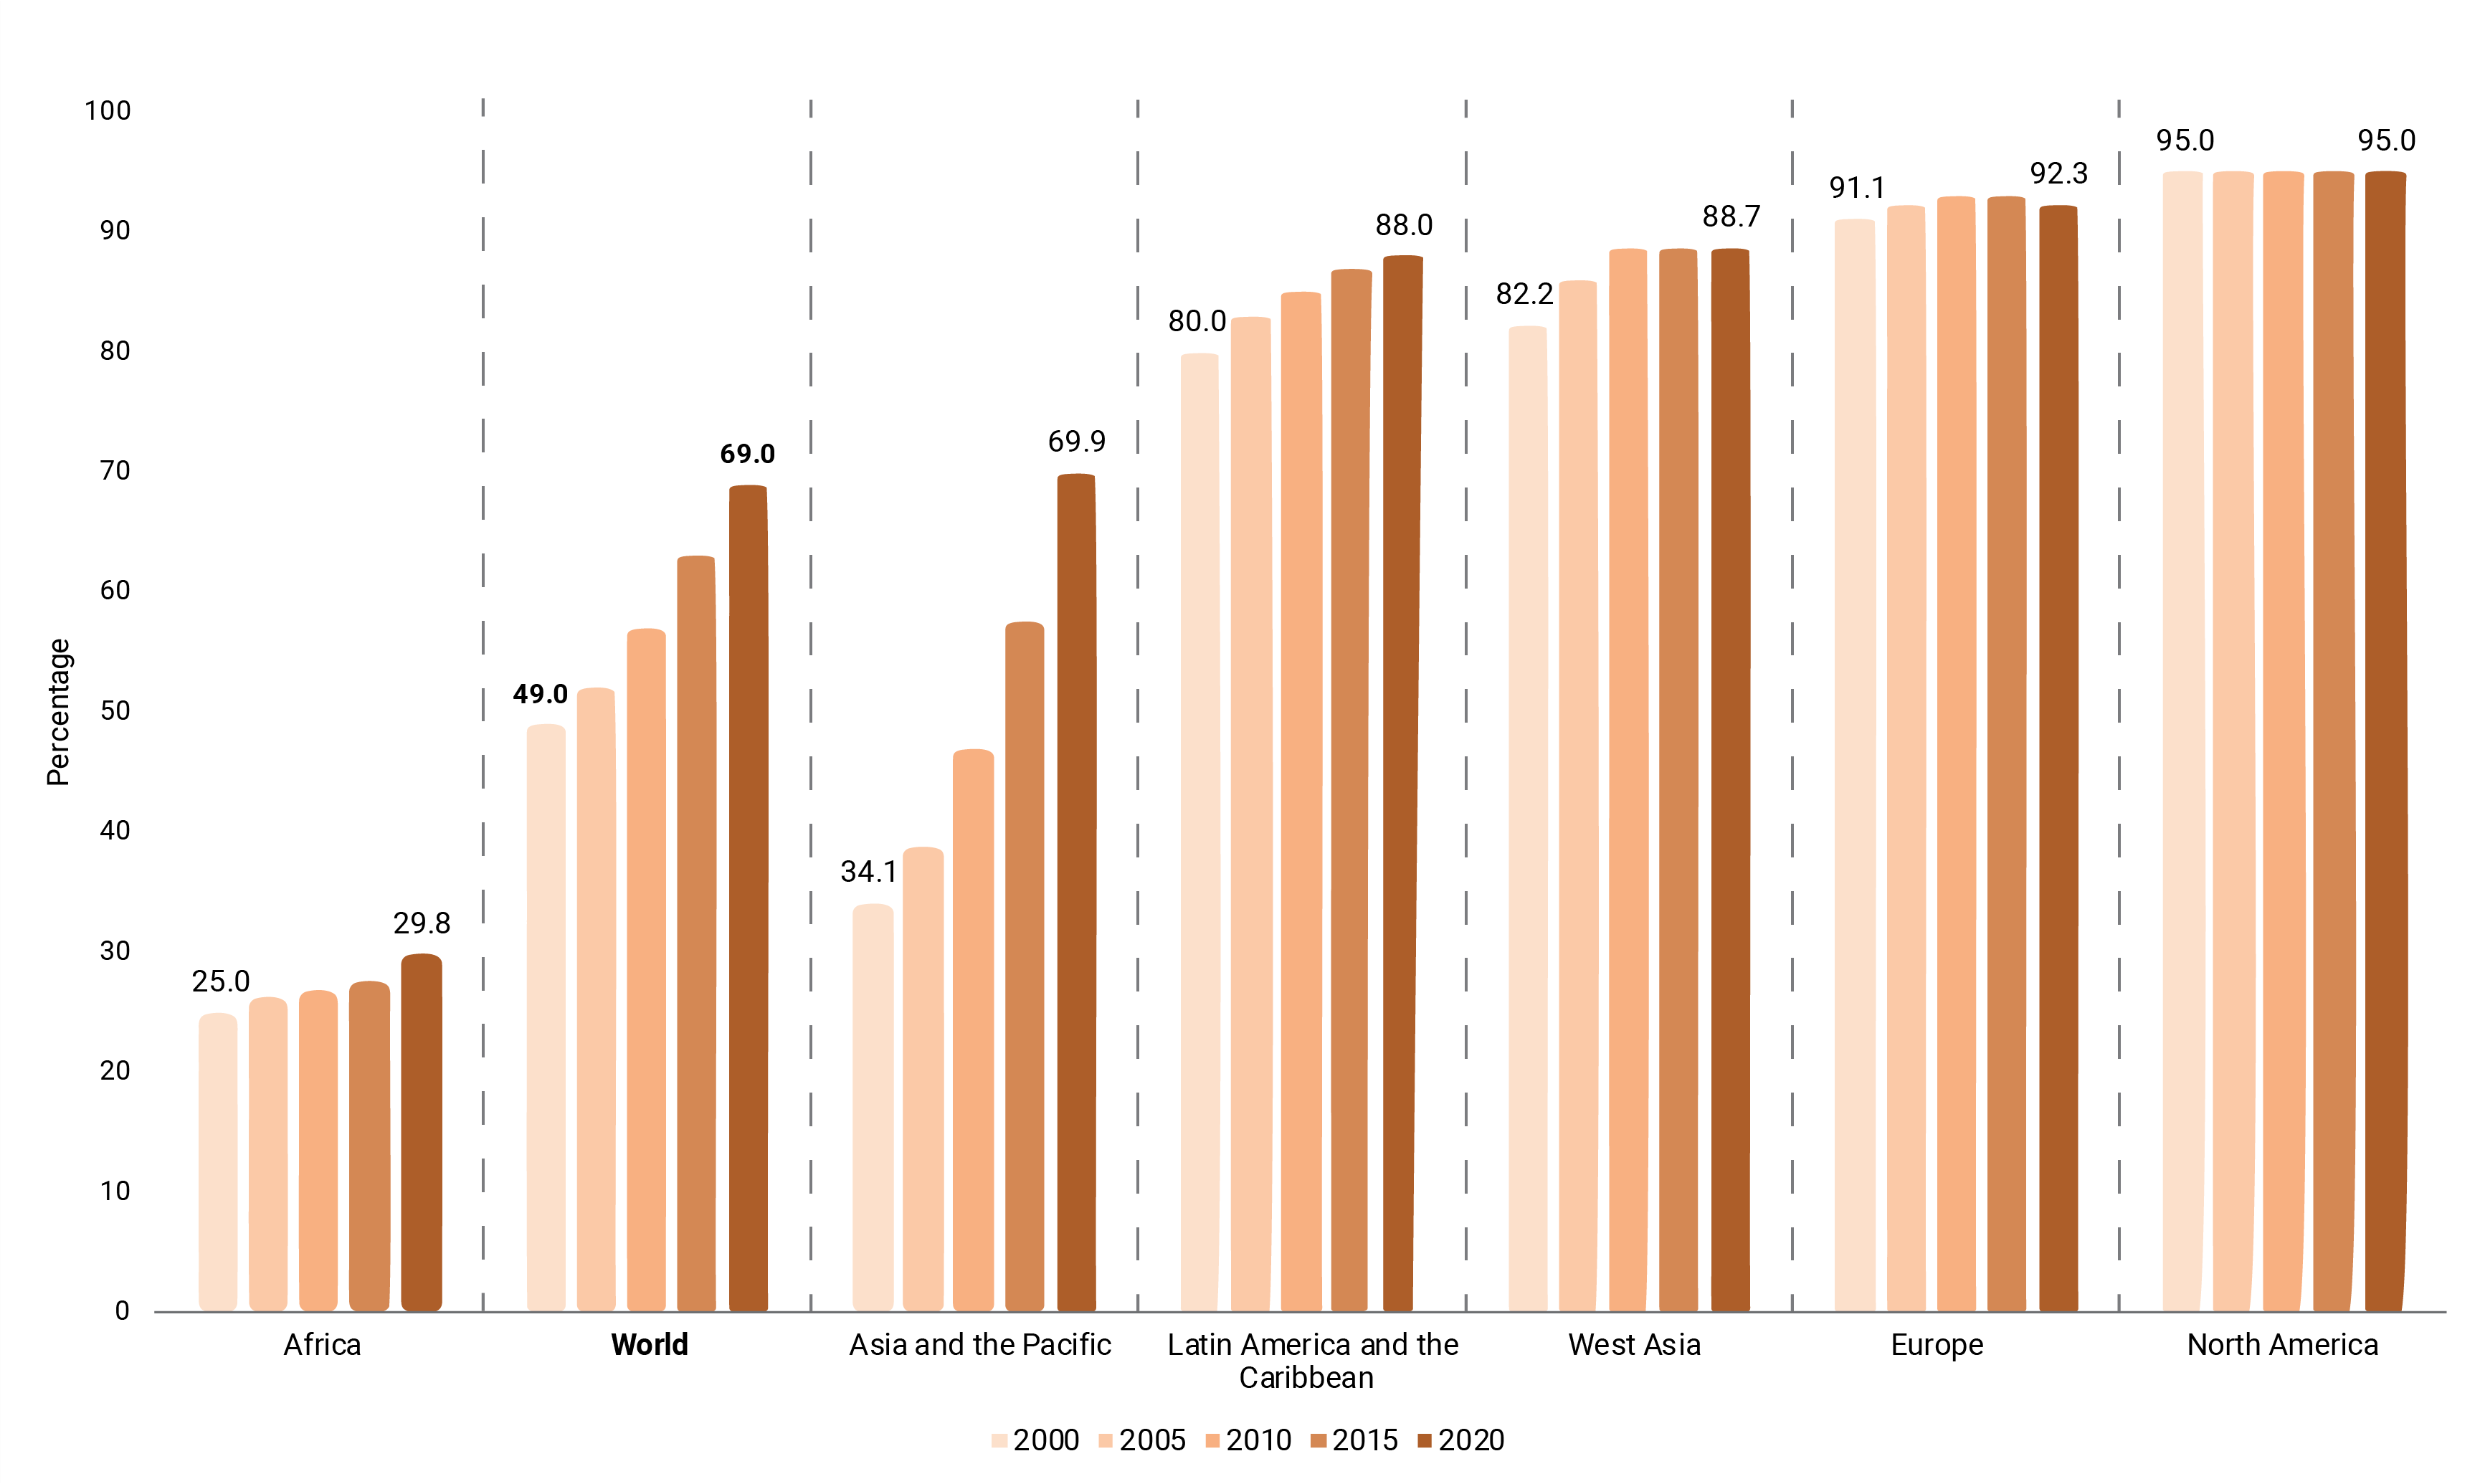
Indicator 7.1.2 is under SDG 7: “Ensure universal access to electricity and clean cooking solutions”, Target 7.1: “By 2030, ensure universal access to affordable, reliable and modern energy services”. This indicator is calculated as the number of people using clean fuels and technologies for cooking, heating and lighting divided by total population reporting (UN 2023a).
Globally the proportion of the population estimated to rely primarily on clean fuels and technology increased significantly between 2000 and 2020, from 49 to 69 per cent. The highest regional increase was in Asia and the Pacific, from around 34 per cent to around 70 per cent. The smallest population share and smallest increase (25 to almost 30 per cent) were in Africa, which is partly attributable to population growth outpacing fuel and technology improvements, a factor which is also important in some other regions (International Energy Agency [IEA], International Renewable Agency [IRENA], United Nations Statistics Division [UNSD], World Bank and World Health Organization [WHO] 2022).
See detailed information▼ or search the most up to date data
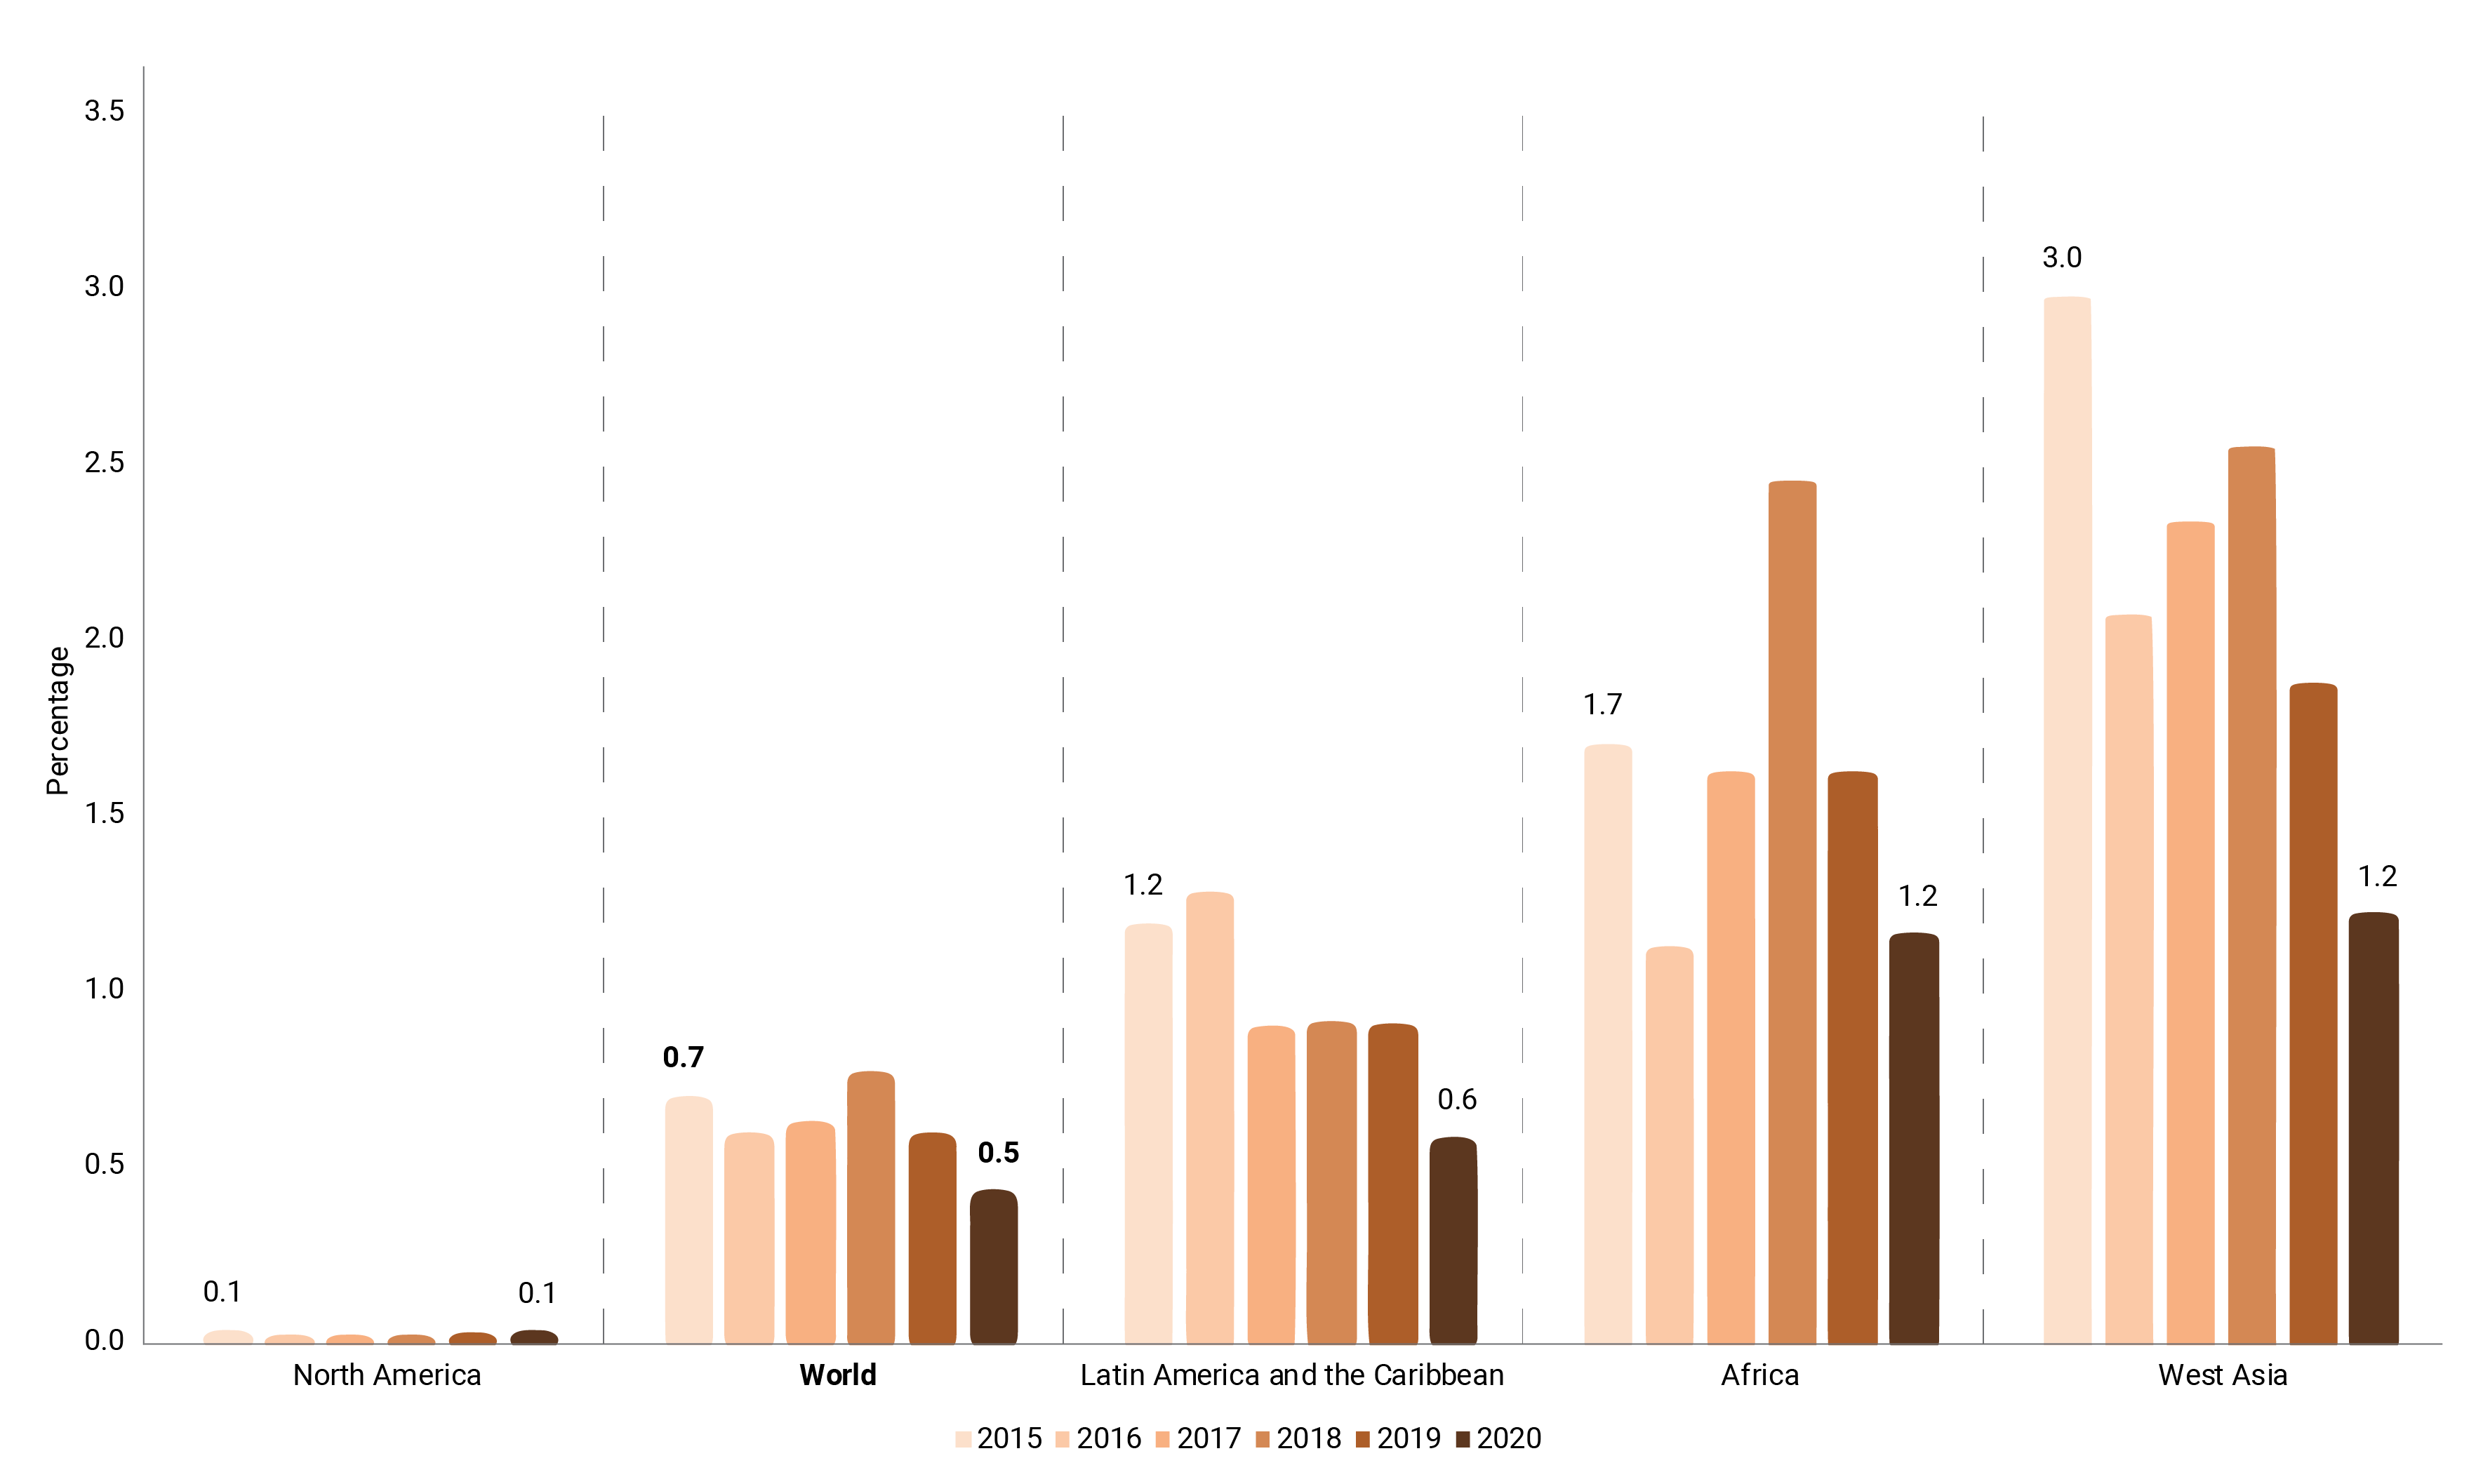
Indicator 12.c.1 is under SDG Goal 12: “Ensure sustainable consumption and production patterns”, Target 12.c: “Rationalize inefficient fossil-fuel subsidies that encourage wasteful consumption by removing market distortions, in accordance with national circumstances, including by restructuring taxation and phasing out those harmful subsidies, where they exist, to reflect their environmental impacts, taking fully into account the specific needs and conditions of developing countries and minimizing the possible adverse impacts on their development in a manner that protects the poor and the affected communities.”
Global fossil fuel subsidies as a proportion of total gross domestic product (GDP) fell from 0.7 to 0.5 per cent between 2015 and 2020. This proportion was highest in West Asia (where it fell from 3.0 per cent in 2000 to 1.2 per cent in 2020) and Africa (where it fell from 2.7 per cent in 2000 to 1.2 per cent in 2020). In 2020 a drop in fossil fuel prices and overall energy use globally brought the value of fossil fuel consumption subsidies down to US$ 180 billion (40 per cent below 2019 levels). They rose to US$ 440 billion in 2021 as energy prices rebounded while policy makers hesitated to continue reforming subsidization schemes during the uncertain post-COVID 19 economic recovery (IEA 2022a).
See detailed Information▼ or Search the most up to date data
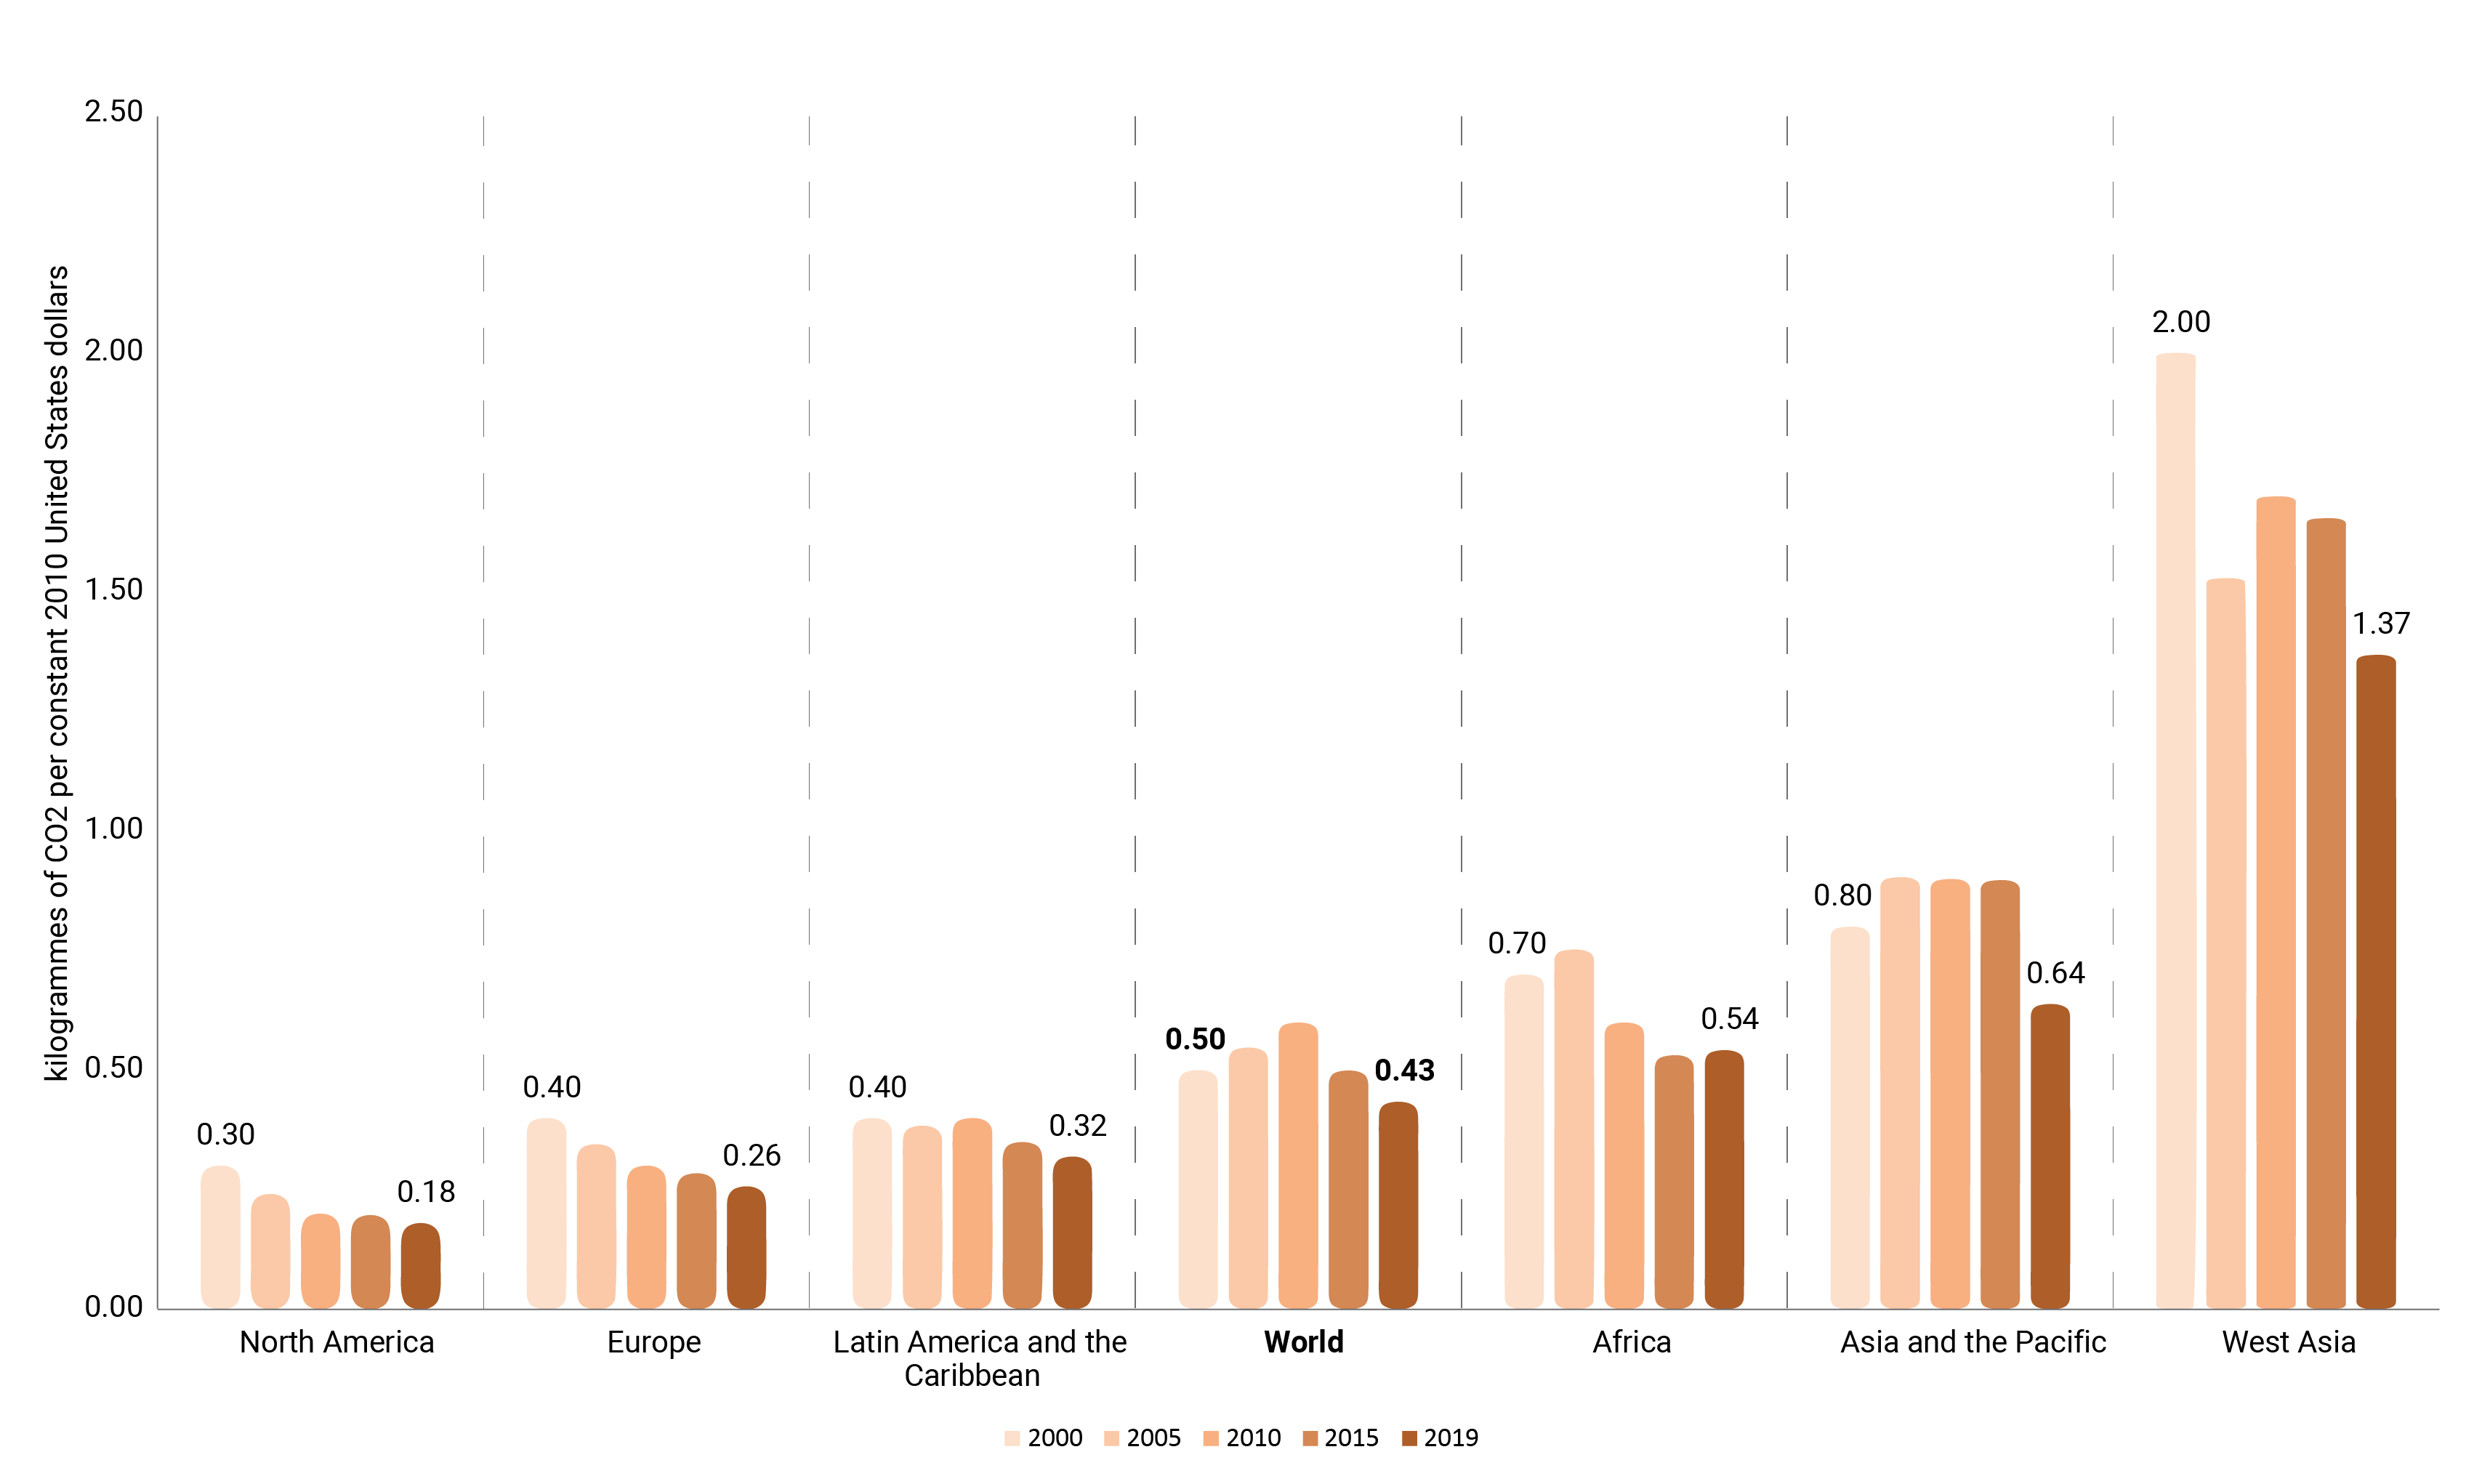
Indicator 9.4.1 is under SDG 9: “Build resilient infrastructure, promote inclusive and sustainable industrialization and foster innovation”, Target 9.4: “Build resilient infrastructure, promote inclusive and sustainable industrialization and foster innovation”.
Globally, CO2 emissions per unit of value added rose slightly from 0.5 kg to 0.6 kg between 2000 and 2010, then fell to 0.4 kg in 2019. The highest emissions and greatest emission reduction were in West Asia (2.0 kg in 2000, falling to 1.4 kg in 2020).
For this indicator CO2 emissions per unit of value added computed as the ratio between CO2 emissions from fuel combustion and the value added of associated economic activities. These emissions can be computed for the whole economy (total CO2 emissions/GDP) or for specific sectors, notably the manufacturing sector (CO2 emissions from manufacturing industries per manufacturing value added (UN 2023b).
Other air pollutants emitted from fossil fuel combustion include sulphur dioxide (SO2), nitrogen oxides (NOx), black carbon (BC), primary particulate matter (PM2.5 and PM10), carbon monoxide (CO), ammonia (NH3), ground-level ozone (O3), and non-methane volatile organic compounds (NMVOCs).
No data are available at the global level for hazardous waste incineration. The World Bank’s “What a Waste” series of reports (Kaza et al. 2018; Kaza, Shrikanth and Chaudhary 2021) provide data on global municipal solid waste (MSW) incineration, but not on incineration of hazardous waste.
See detailed information▼
Kaza et al. (2018) reported that globally 11 per cent of MSW (not including hazardous waste) was treated using modern incineration. Burning non-hazardous waste in incineration facilities produces particulate matter (PM2.5 and PM10), persistent organic pollutants (POPs), carbon monoxide (CO), nitrogen oxides (NOx) and cancer-causing dioxins and furans (Mukherjee, Debnath and Ghosh 2016; C40 Knowledge Hub 2019; Cole-Hunter 2020; Li et al. 2021). Advanced technologies are available to address emissions of toxic substances from incineration facilities (e.g. Neuwahl et al. 2019), but investment and operational costs may be too high for adoption in some low- and middle-income countries.
In the European Union (EU) in 2018, 45.1 per cent of all hazardous waste treated was recovered: 37.5 per cent by recycling or backfilling and 7.6 per cent by energy recovery. The remaining 54.9 per cent was incinerated without energy recovery (5.7 per cent), landfilled (32.8 per cent) or disposed of in other way (16.2 per cent). Two-thirds of a total of 82.3 MT of hazardous waste treatment occurred in four EU Member States: Germany (22.4 MT or 27.3 per cent of the EU total), Bulgaria (13.6 MT or 16.5 per cent), Estonia (10.7 MT or 13.0 per cent) and France (9.5 Mt or 11.6 per cent) (European Commission [EC] 2022).
See detailed information▼ or the data source
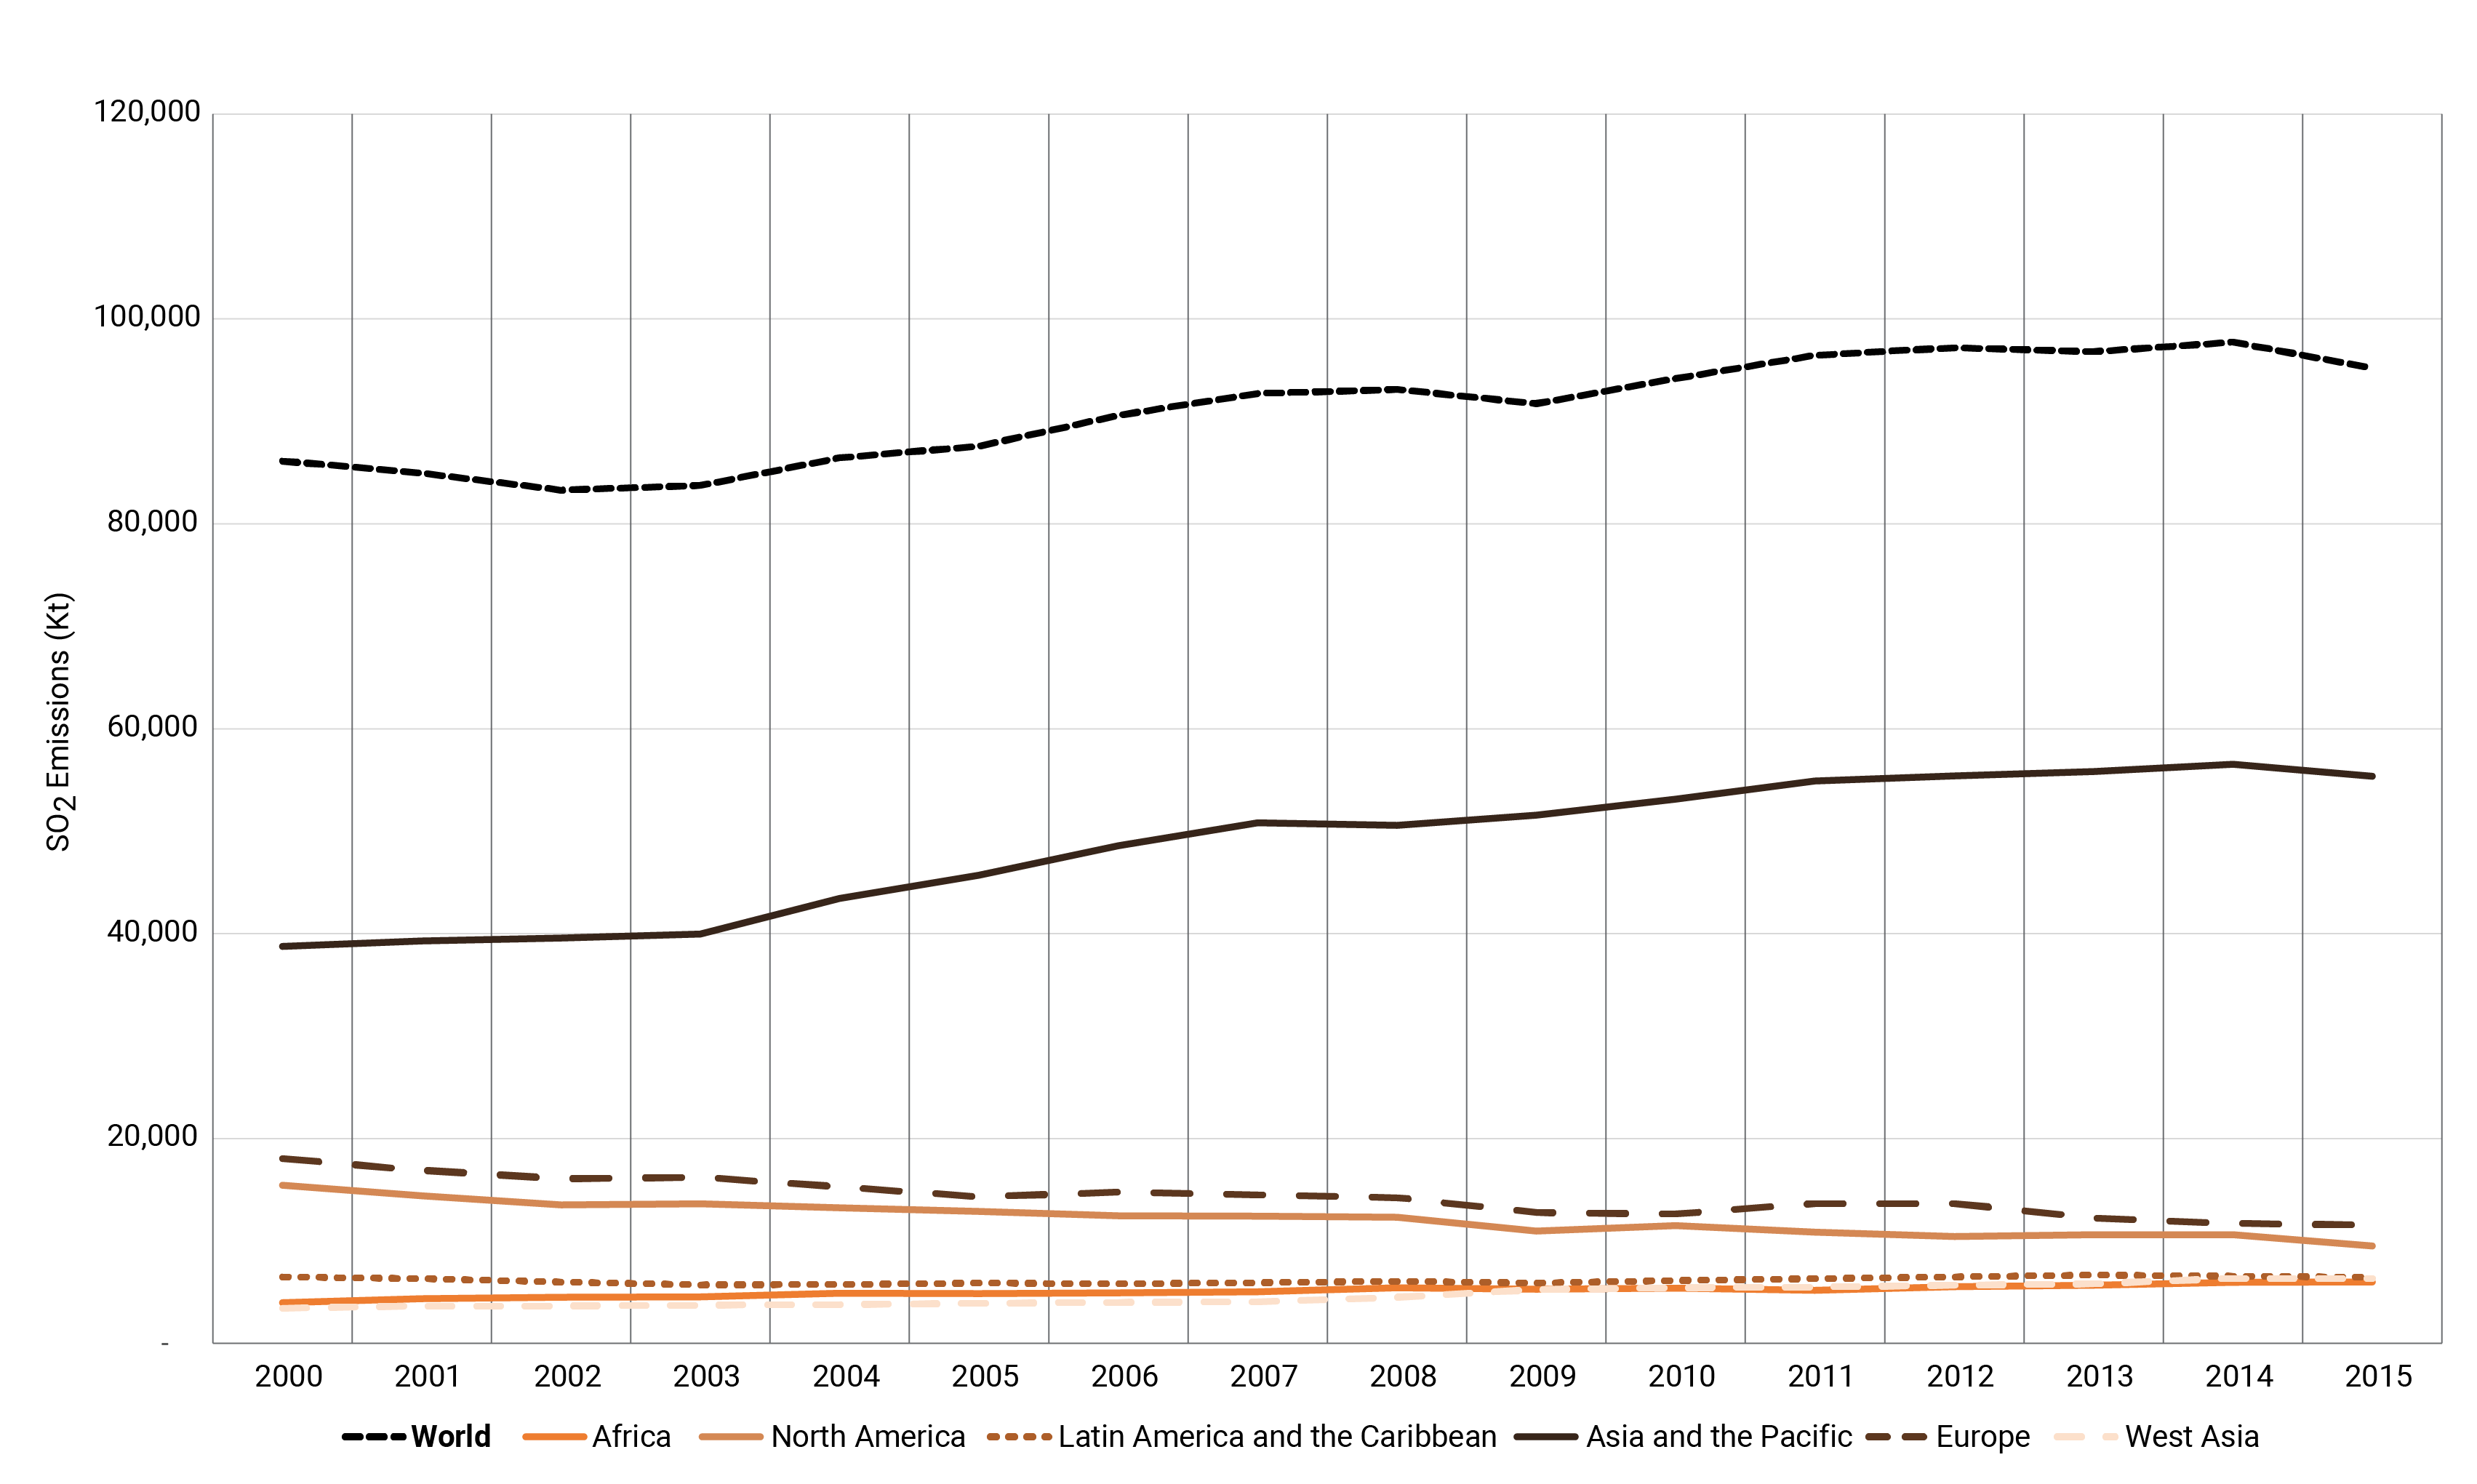
Global SO2 emissions increased between 2000 and 2014, after which they started to decline. Lower emission rates can be attributed to sulphur emission controls in the energy sector, especially in developing countries in Asia. SO2 emissions in Asia and the Pacific were higher than in other regions owing to the use of coal-based energy sources in the growing industrial sector. However, countries in this region, including China and Japan, have put into effect measures such as desulphurization technology, reduction of industrial coal use, and power sector reforms (UNEP 2019a).
Global fossil fuel subsidies as a proportion of total gross domestic product (GDP) fell from 0.7 to 0.5 per cent between 2015 and 2020. This proportion was highest in West Asia (where it fell from 3.0 per cent in 2000 to 1.2 per cent in 2020) and Africa (where it fell from 2.7 per cent in 2000 to 1.2 per cent in 2020). In 2020 a drop in fossil fuel prices and overall energy use globally brought the value of fossil fuel consumption subsidies down to US$ 180 billion (40 per cent below 2019 levels). They rose to US$ 440 billion in 2021 as energy prices rebounded while policy makers hesitated to continue reforming subsidization schemes during the uncertain post-COVID 19 economic recovery (IEA 2022a).
See detailed information▼ or the data source
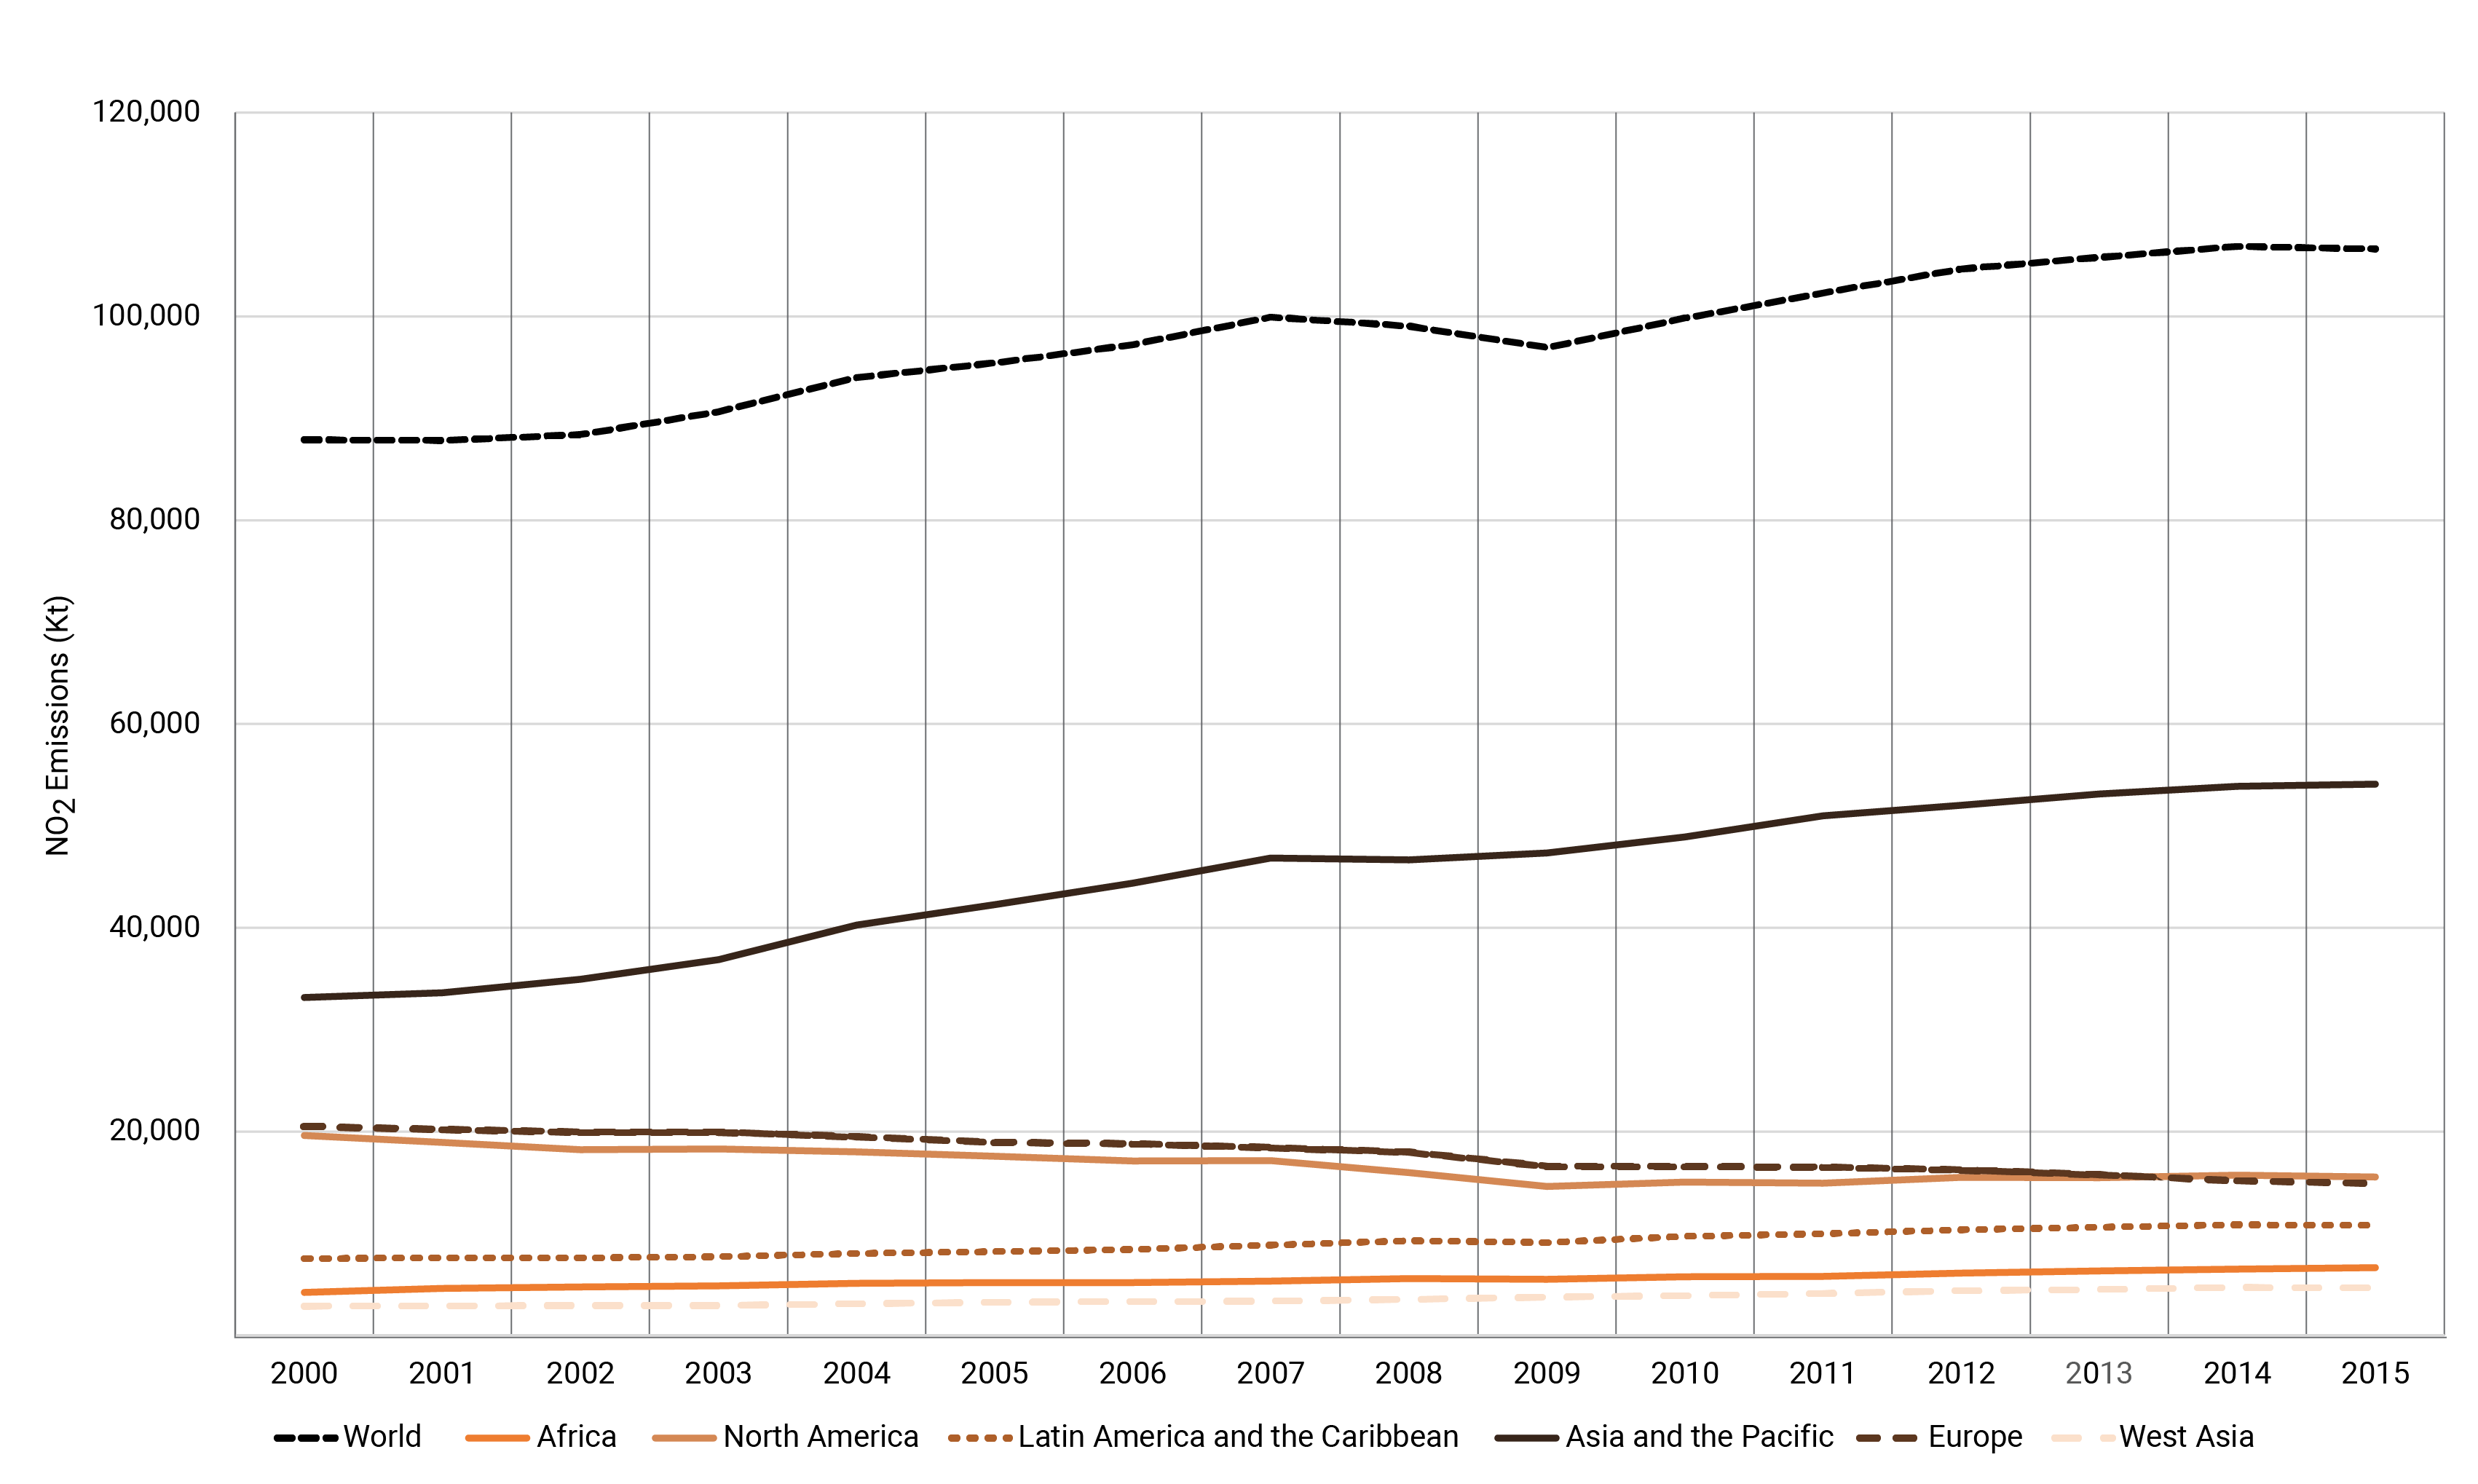
Global emissions of nitrogen oxides (i.e. nitrogen dioxide [NO2] and nitric oxide [NO], which is oxidized in the atmosphere to become NO2) increased moderately between 2000 and 2015. The highest emission levels were in Asia and the Pacific, reflecting economic growth and urbanization.
See detailed information▼ or the data source
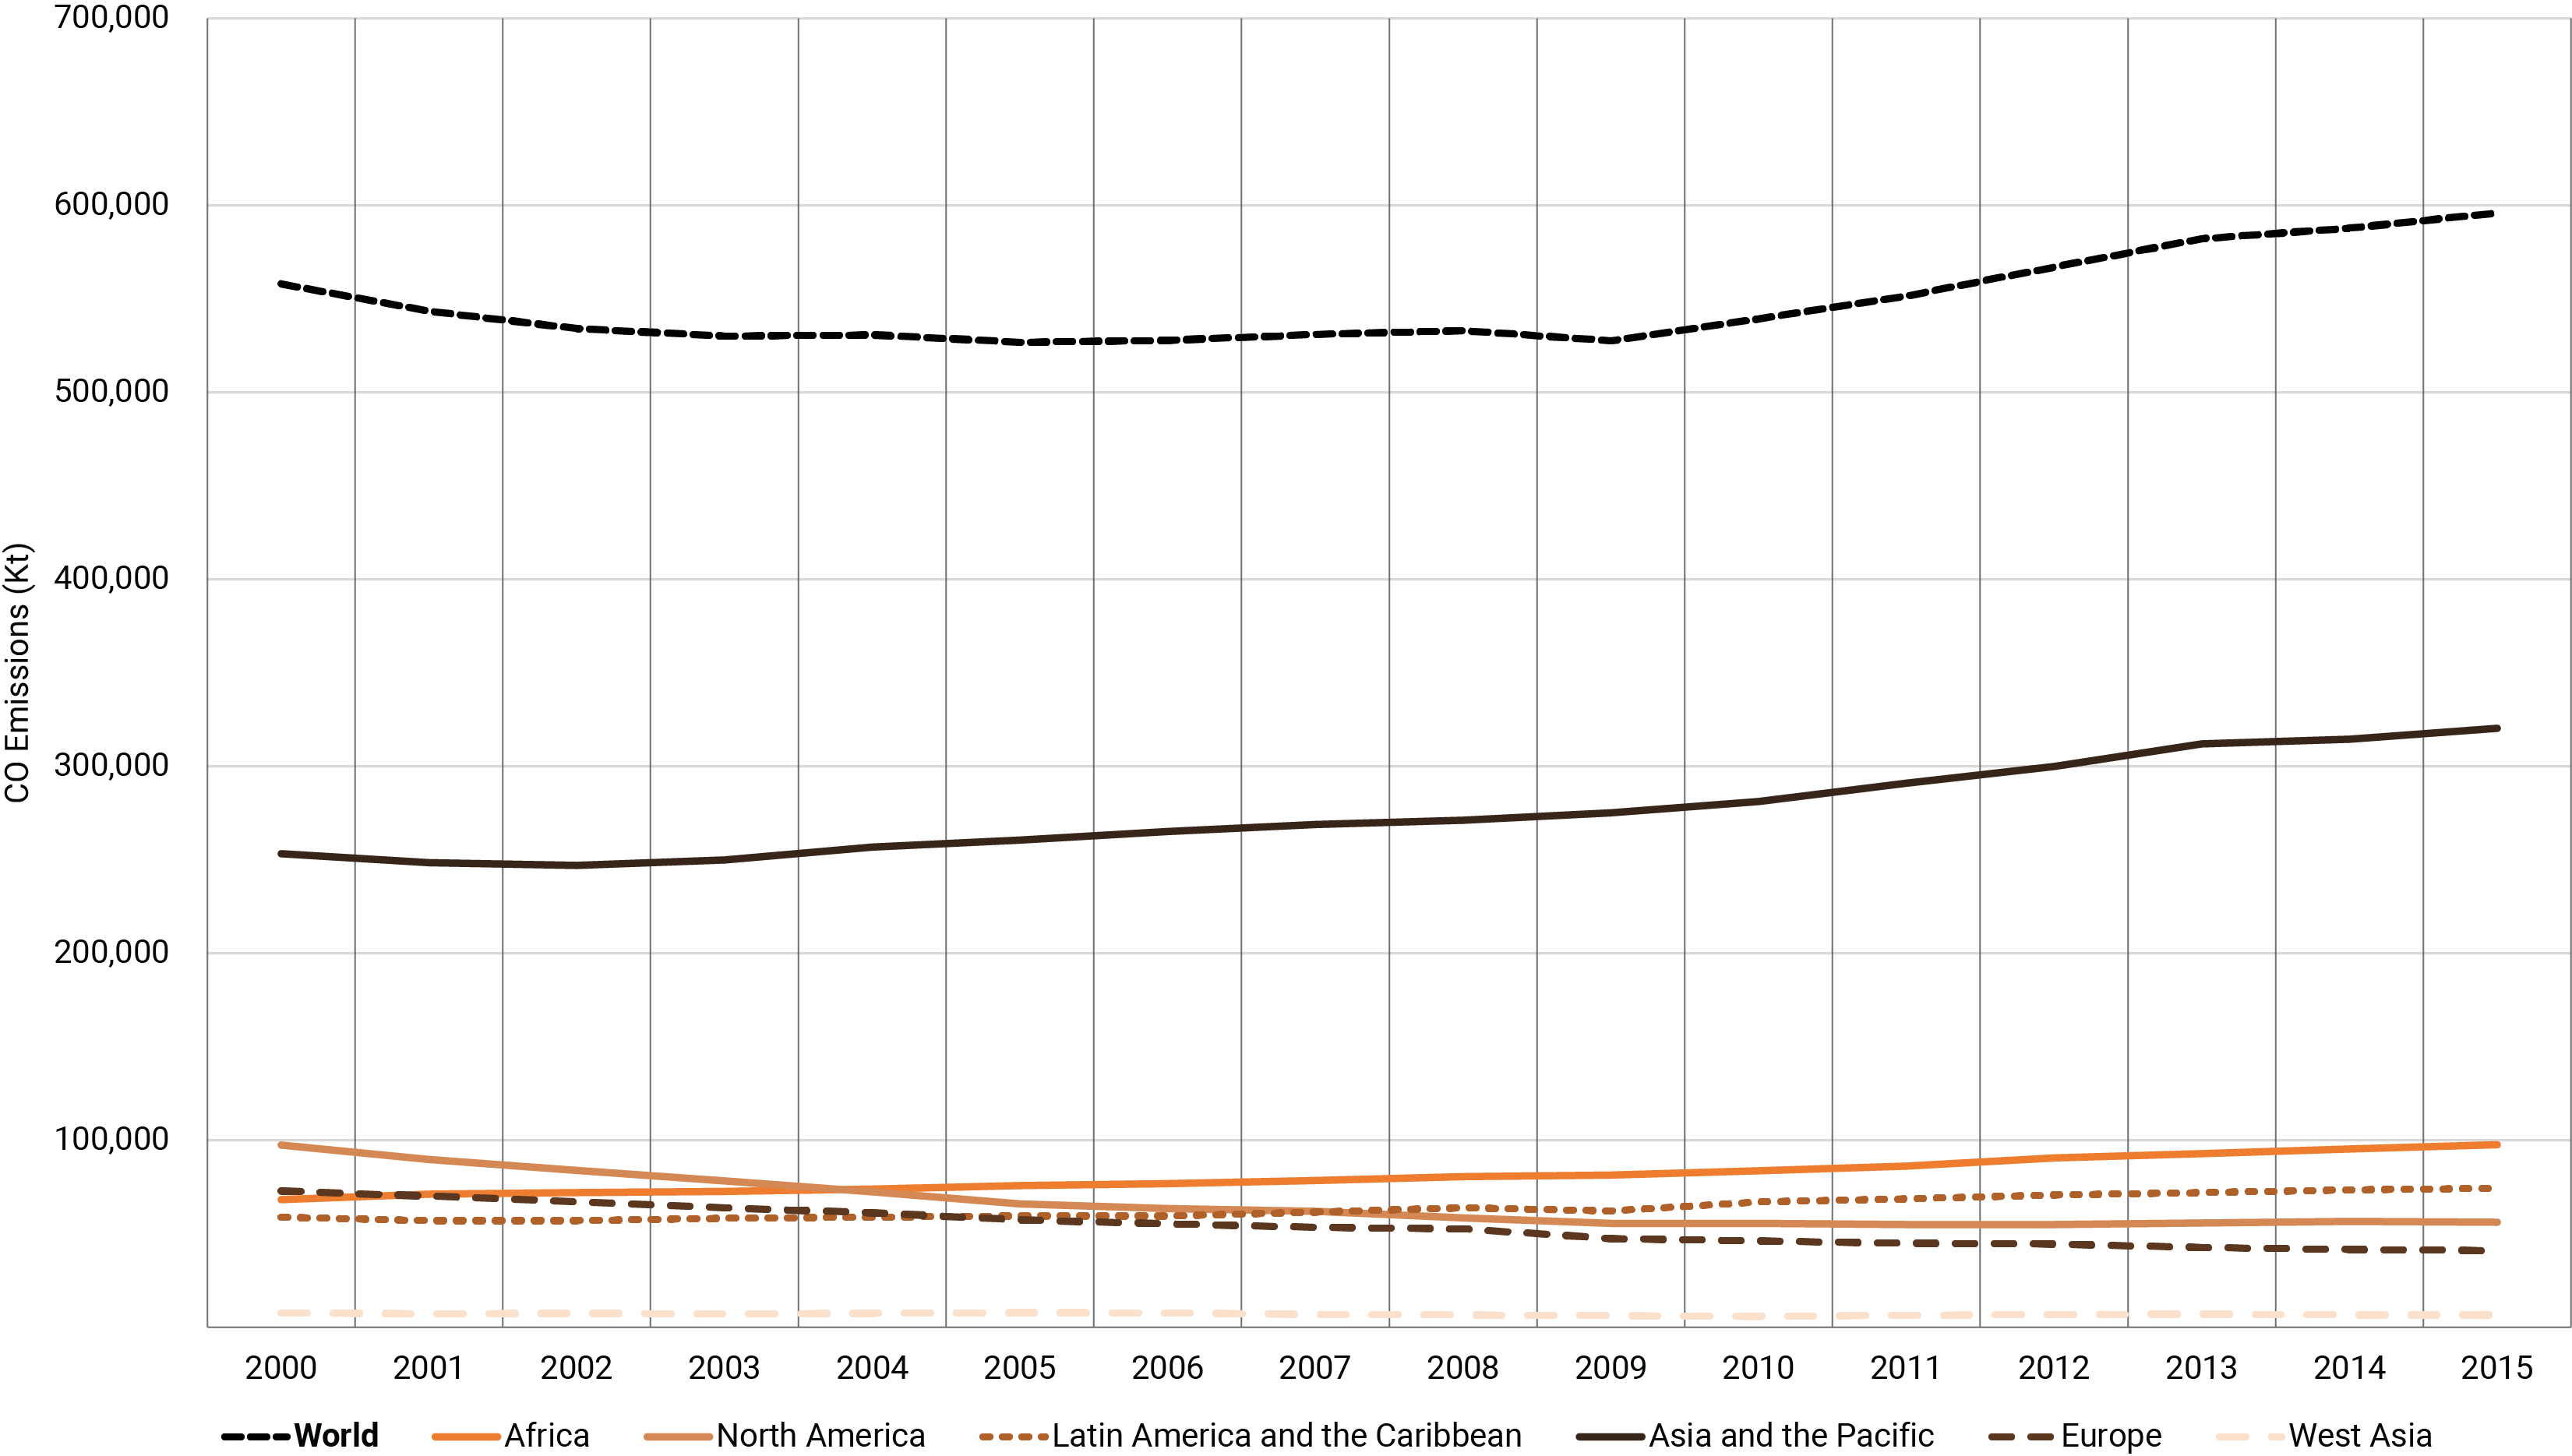
Global carbon monoxide emissions decreased between 2000 and 2009, followed by a sharp increase in 2015. In Asia and the Pacific emissions steadily increased, accounting for more than 50 per cent of the world’s total CO emissions in 2015. This region is responsible for more than half of global energy consumption, 85 per cent of which is currently estimated to be sourced from fossil fuels (IRENA 2022). In North America and Europe CO emissions decreased during this period, while they slowly increased in Africa and in Latin America and the Caribbean. They were lowest in West Asia, which showed a relatively stable trend.
See detailed information▼ or the data source
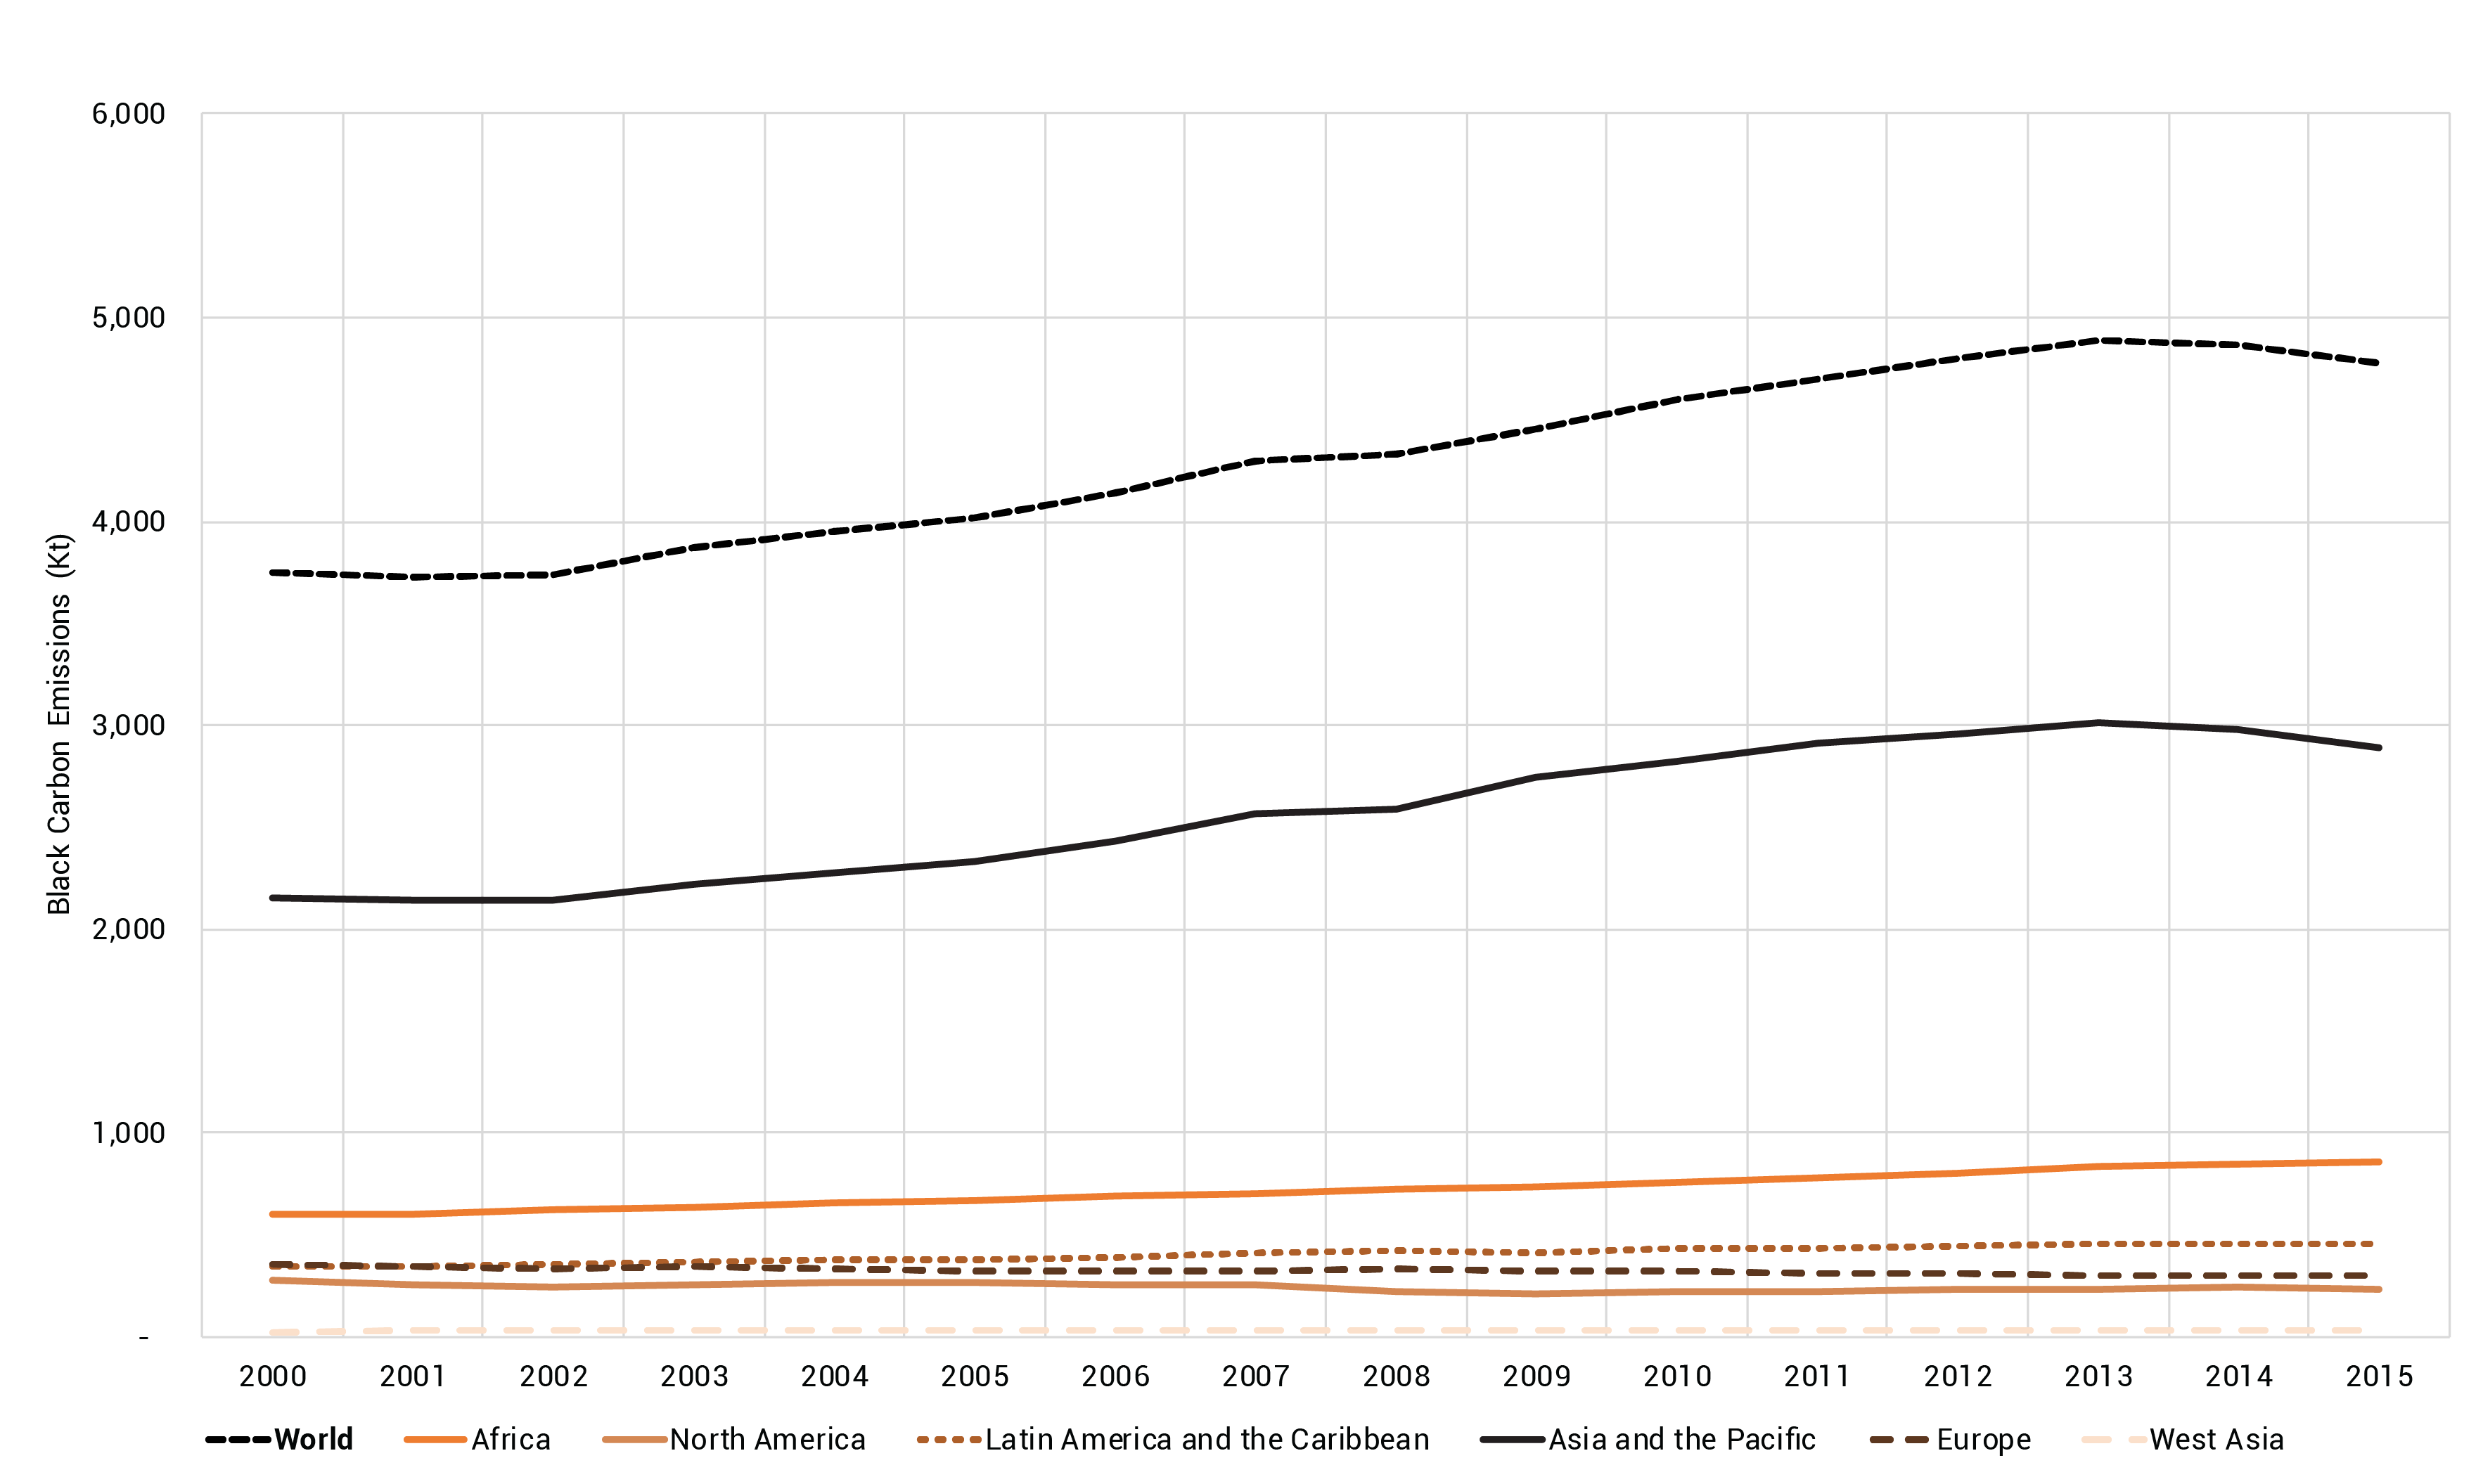
Global emissions of black carbon (BC), one of the Short-Lived Climate Pollutants (SLCPS), increased globally by more than 30 per cent between 2000 and 2015. Emissions in Asia and the Pacific followed a similar trend, accounting for about 60 per cent of all black carbon emissions in 2015. Black carbon emissions in Africa increased by about 44 per cent between 2000 and 2015. In the other regions these emissions were relatively stable.
See detailed information▼ or search the most up to date data
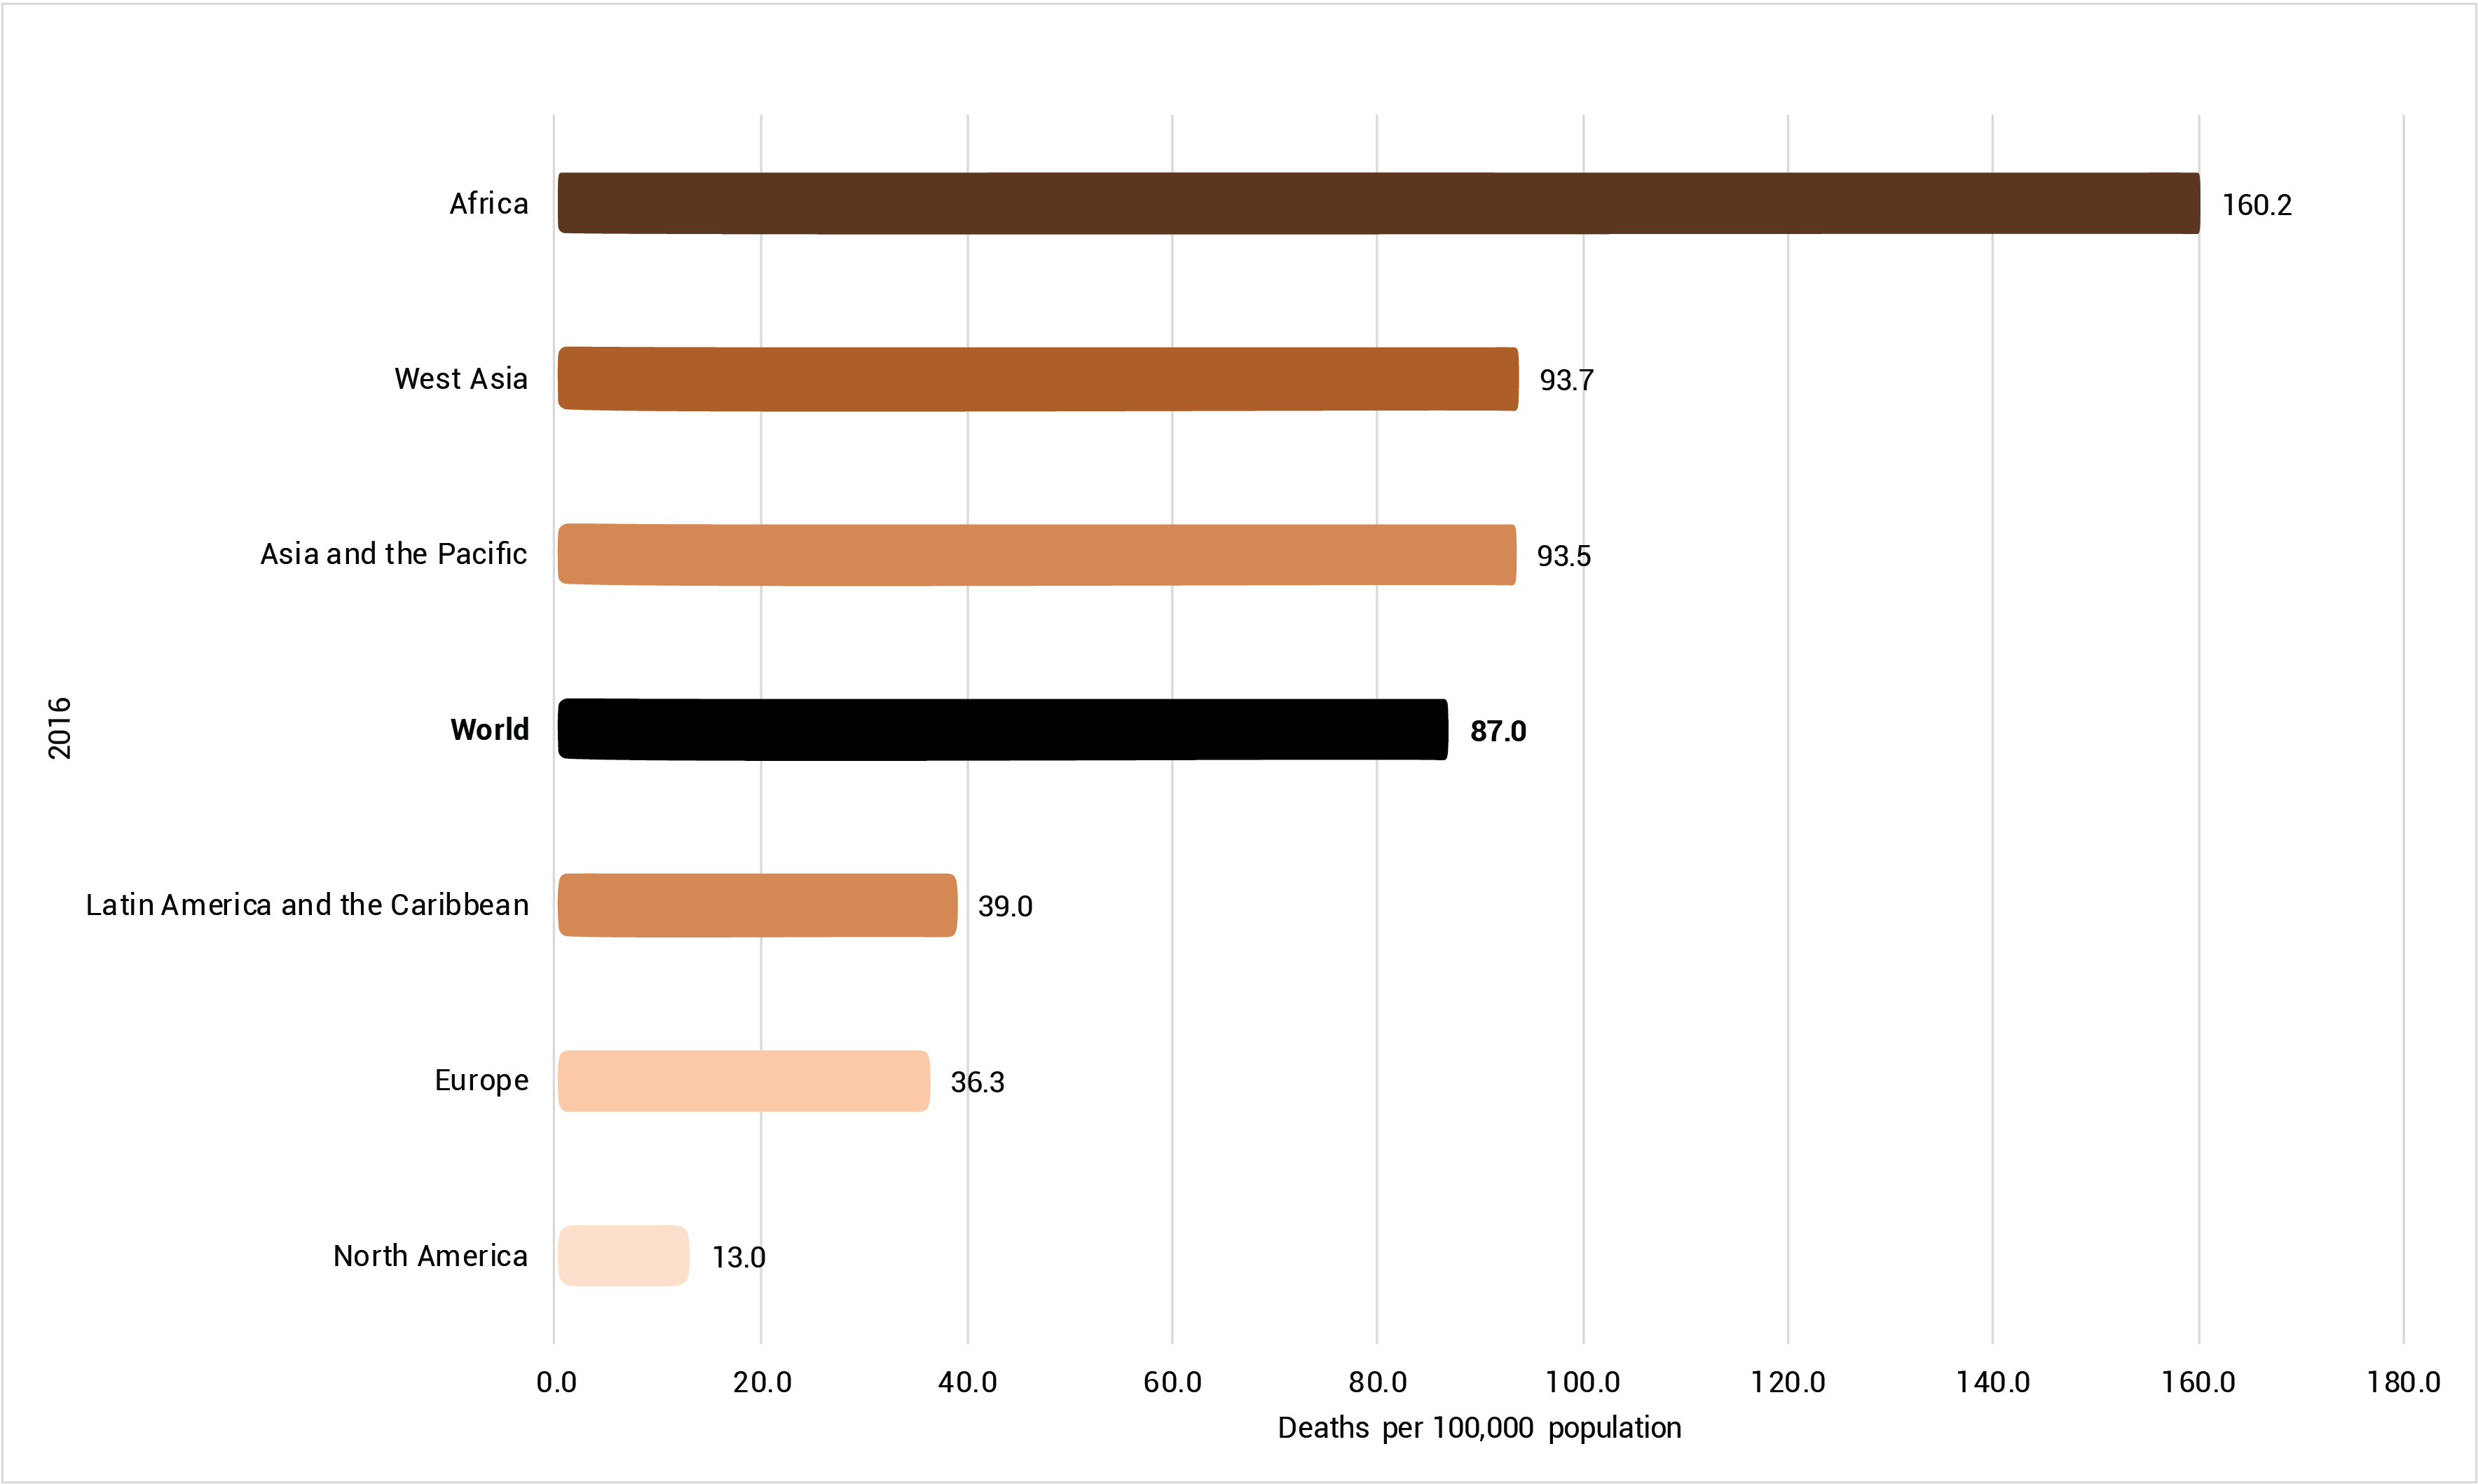
Indicator 3.9.1 is under SDG 3: “Ensure healthy lives and promote well-being for all at all ages”, Target 3.9: “By 2030 substantially reduce the number of deaths and illnesses from hazardous chemicals and air, water, and soil pollution and contamination”. Two of the indicators described above, 7.1.2 (proportion of population with primary reliance on clean fuels and technology) and 11.62 (annual mean levels of fine particulate matter in urban areas), are closely related to this indicator.
The number of deaths per 100,000 population attributed to the joint effects of indoor or household air pollution (HAP) and outdoor or ambient air pollution (AAP) in 2016 ranged from 13.0 in North America to 160.2 in Africa. The world average was 87.0. Globally, 7 million deaths were attributable to the joint effects of HAP and AAP in that year. About 94 per cent of these deaths occurred in low- and middle‐income countries: 2.4 and 2.2 million, respectively, in the Southeast Asian and Western Pacific regions; 980,000 in Africa; 475,000 in the Eastern Mediterranean region; 348,000 in Europe; and 233,000 in the Americas. The remainder were in high‐income countries in Europe (208,000), the Americas (96,000), the Western Pacific (83,000) and the Eastern Mediterranean (18,000) (WHO 2018a).
See detailed information▼ or search the most up to date data
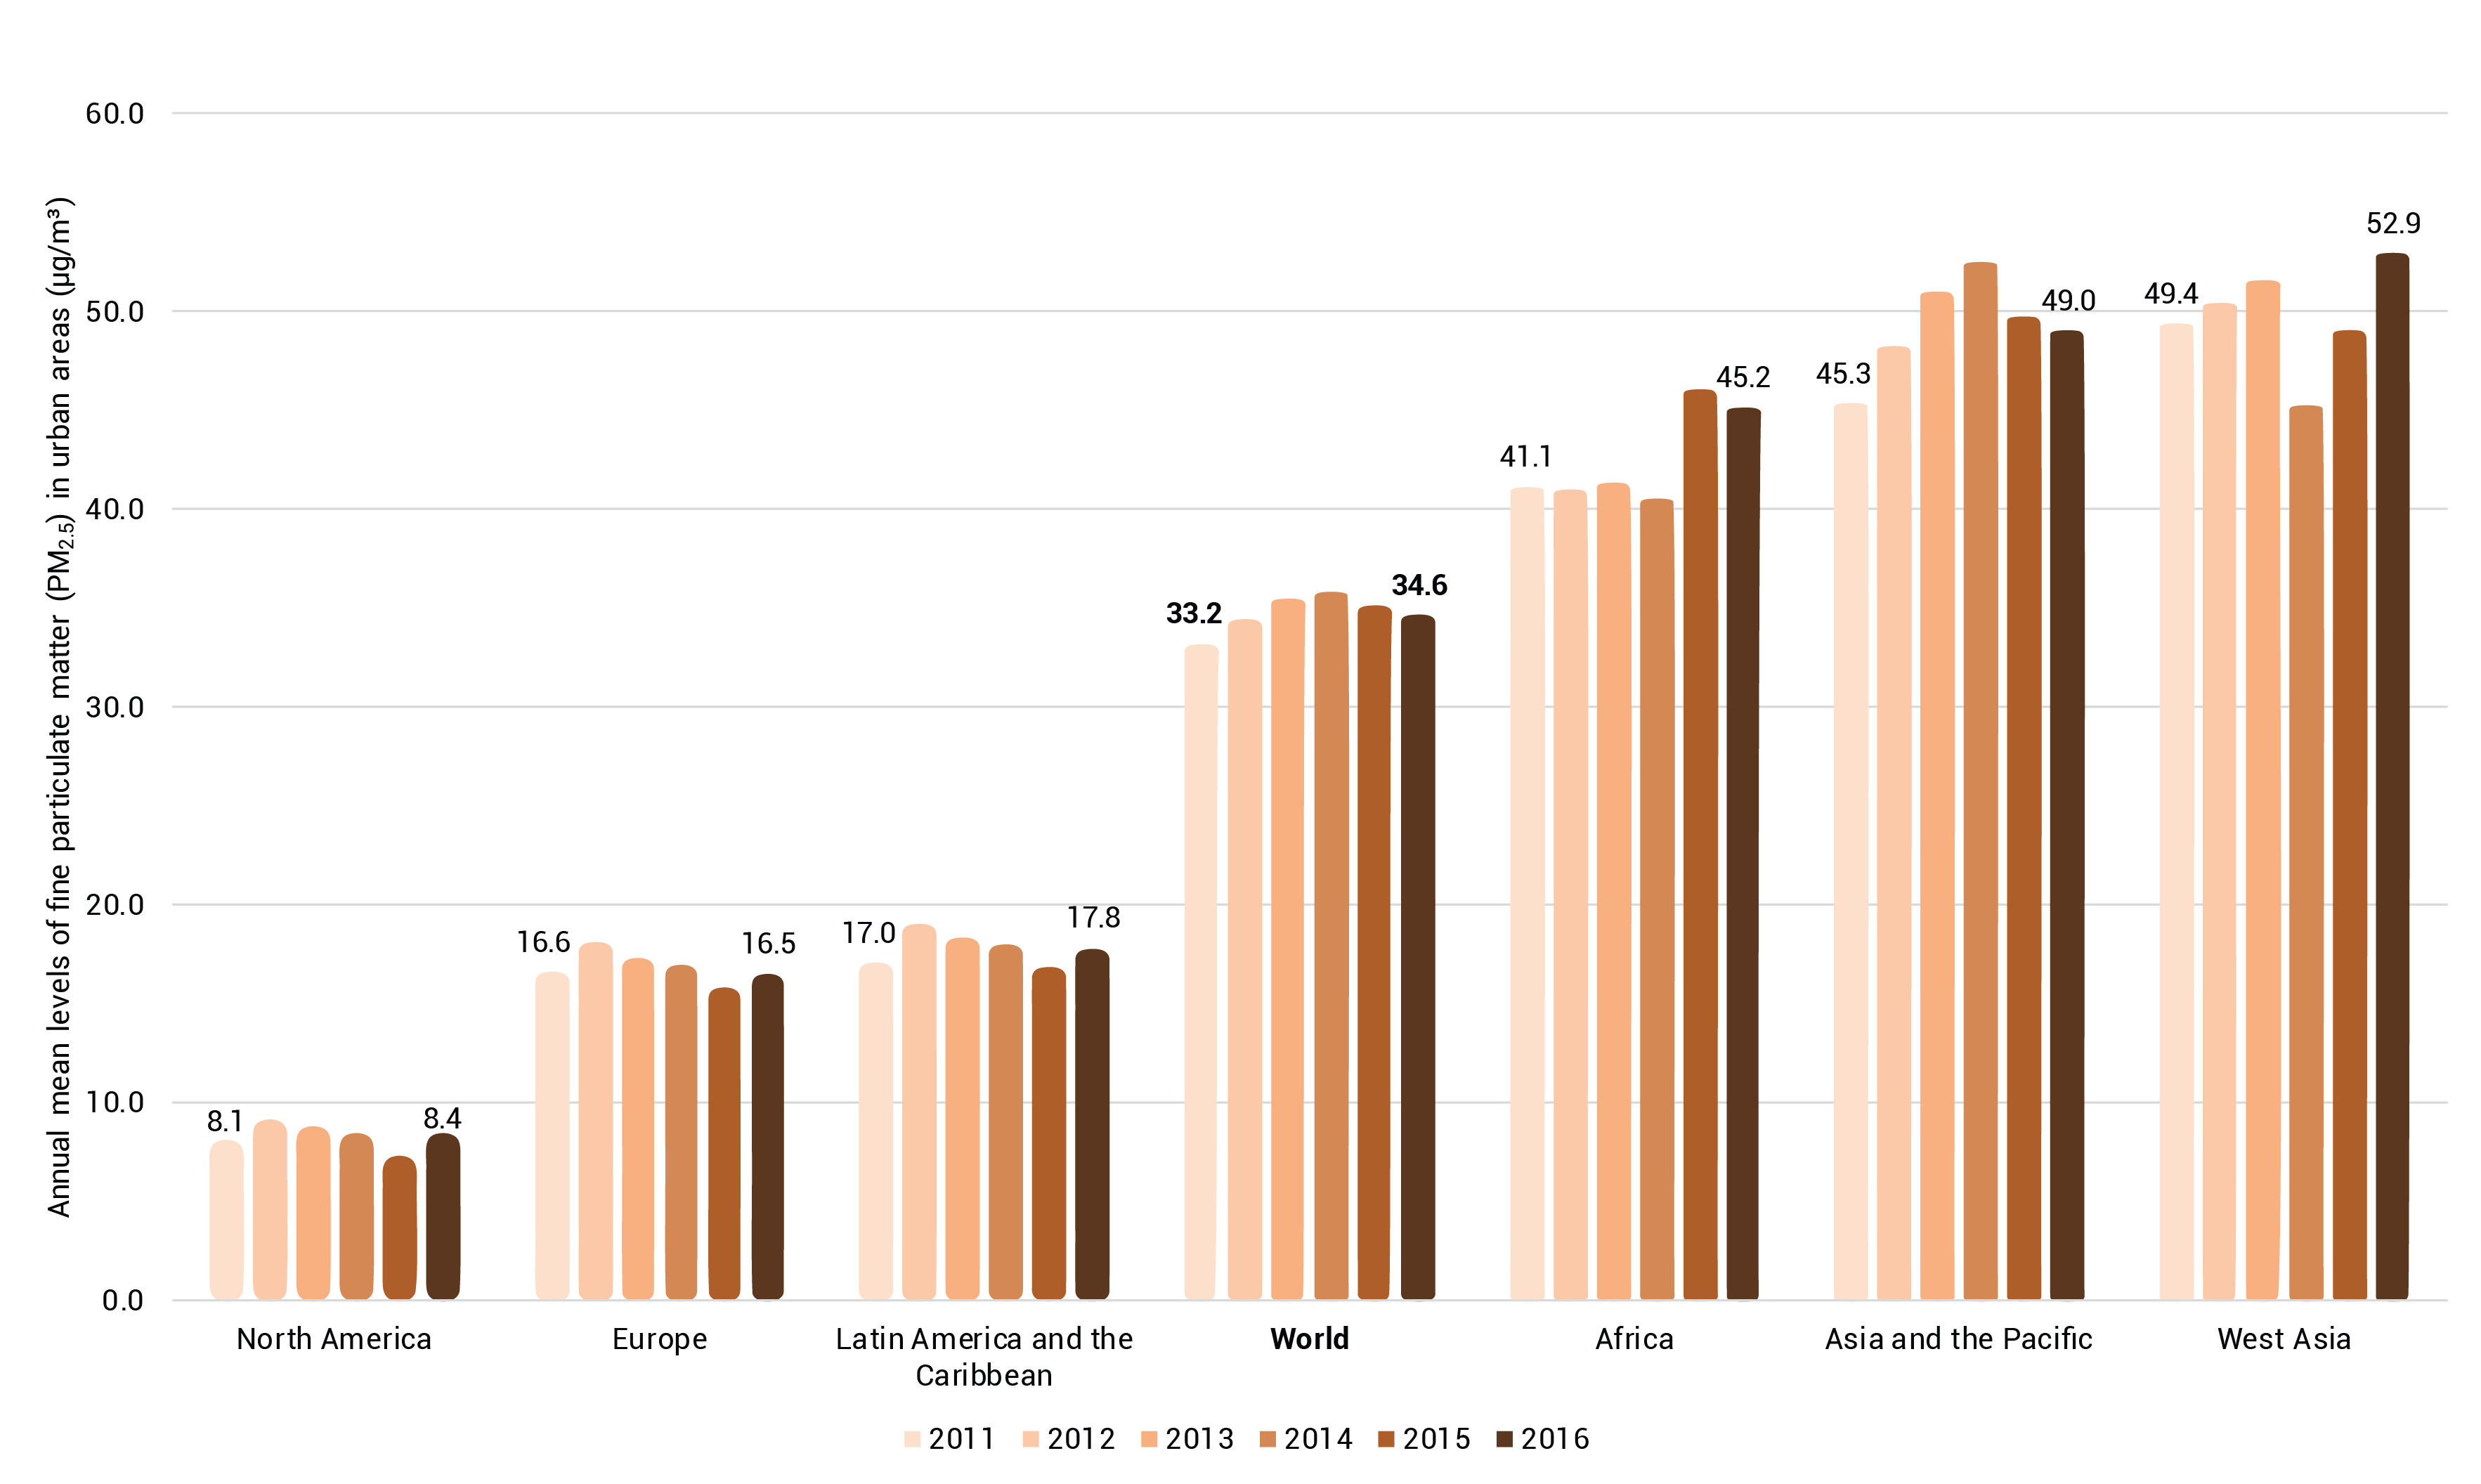
Indicator 11.6.2 is under SDG 11: “Make cities and human settlements inclusive, safe, resilient and sustainable”, Target 11.6: “By 2030, reduce the adverse per capita environmental impact of cities, including by paying special attention to air quality and municipal and other waste”. The mean annual concentration of fine suspended particles (or fine particulate matter) of 2.5 microns or less in diameter (PM2.5) is a common measure of air pollution.
The lowest PM2.5 concentrations between 2011 and 2016 were in North America (8.1 mg/m3 in 2011 and 8.4 mg/m3 in 2016). The highest were in Asia and the Pacific (45.3 and 49.0 mg/m3) and West Asia (49.4 and 52.9 mg/m3).
See detailed information▼ or search the most up to date data
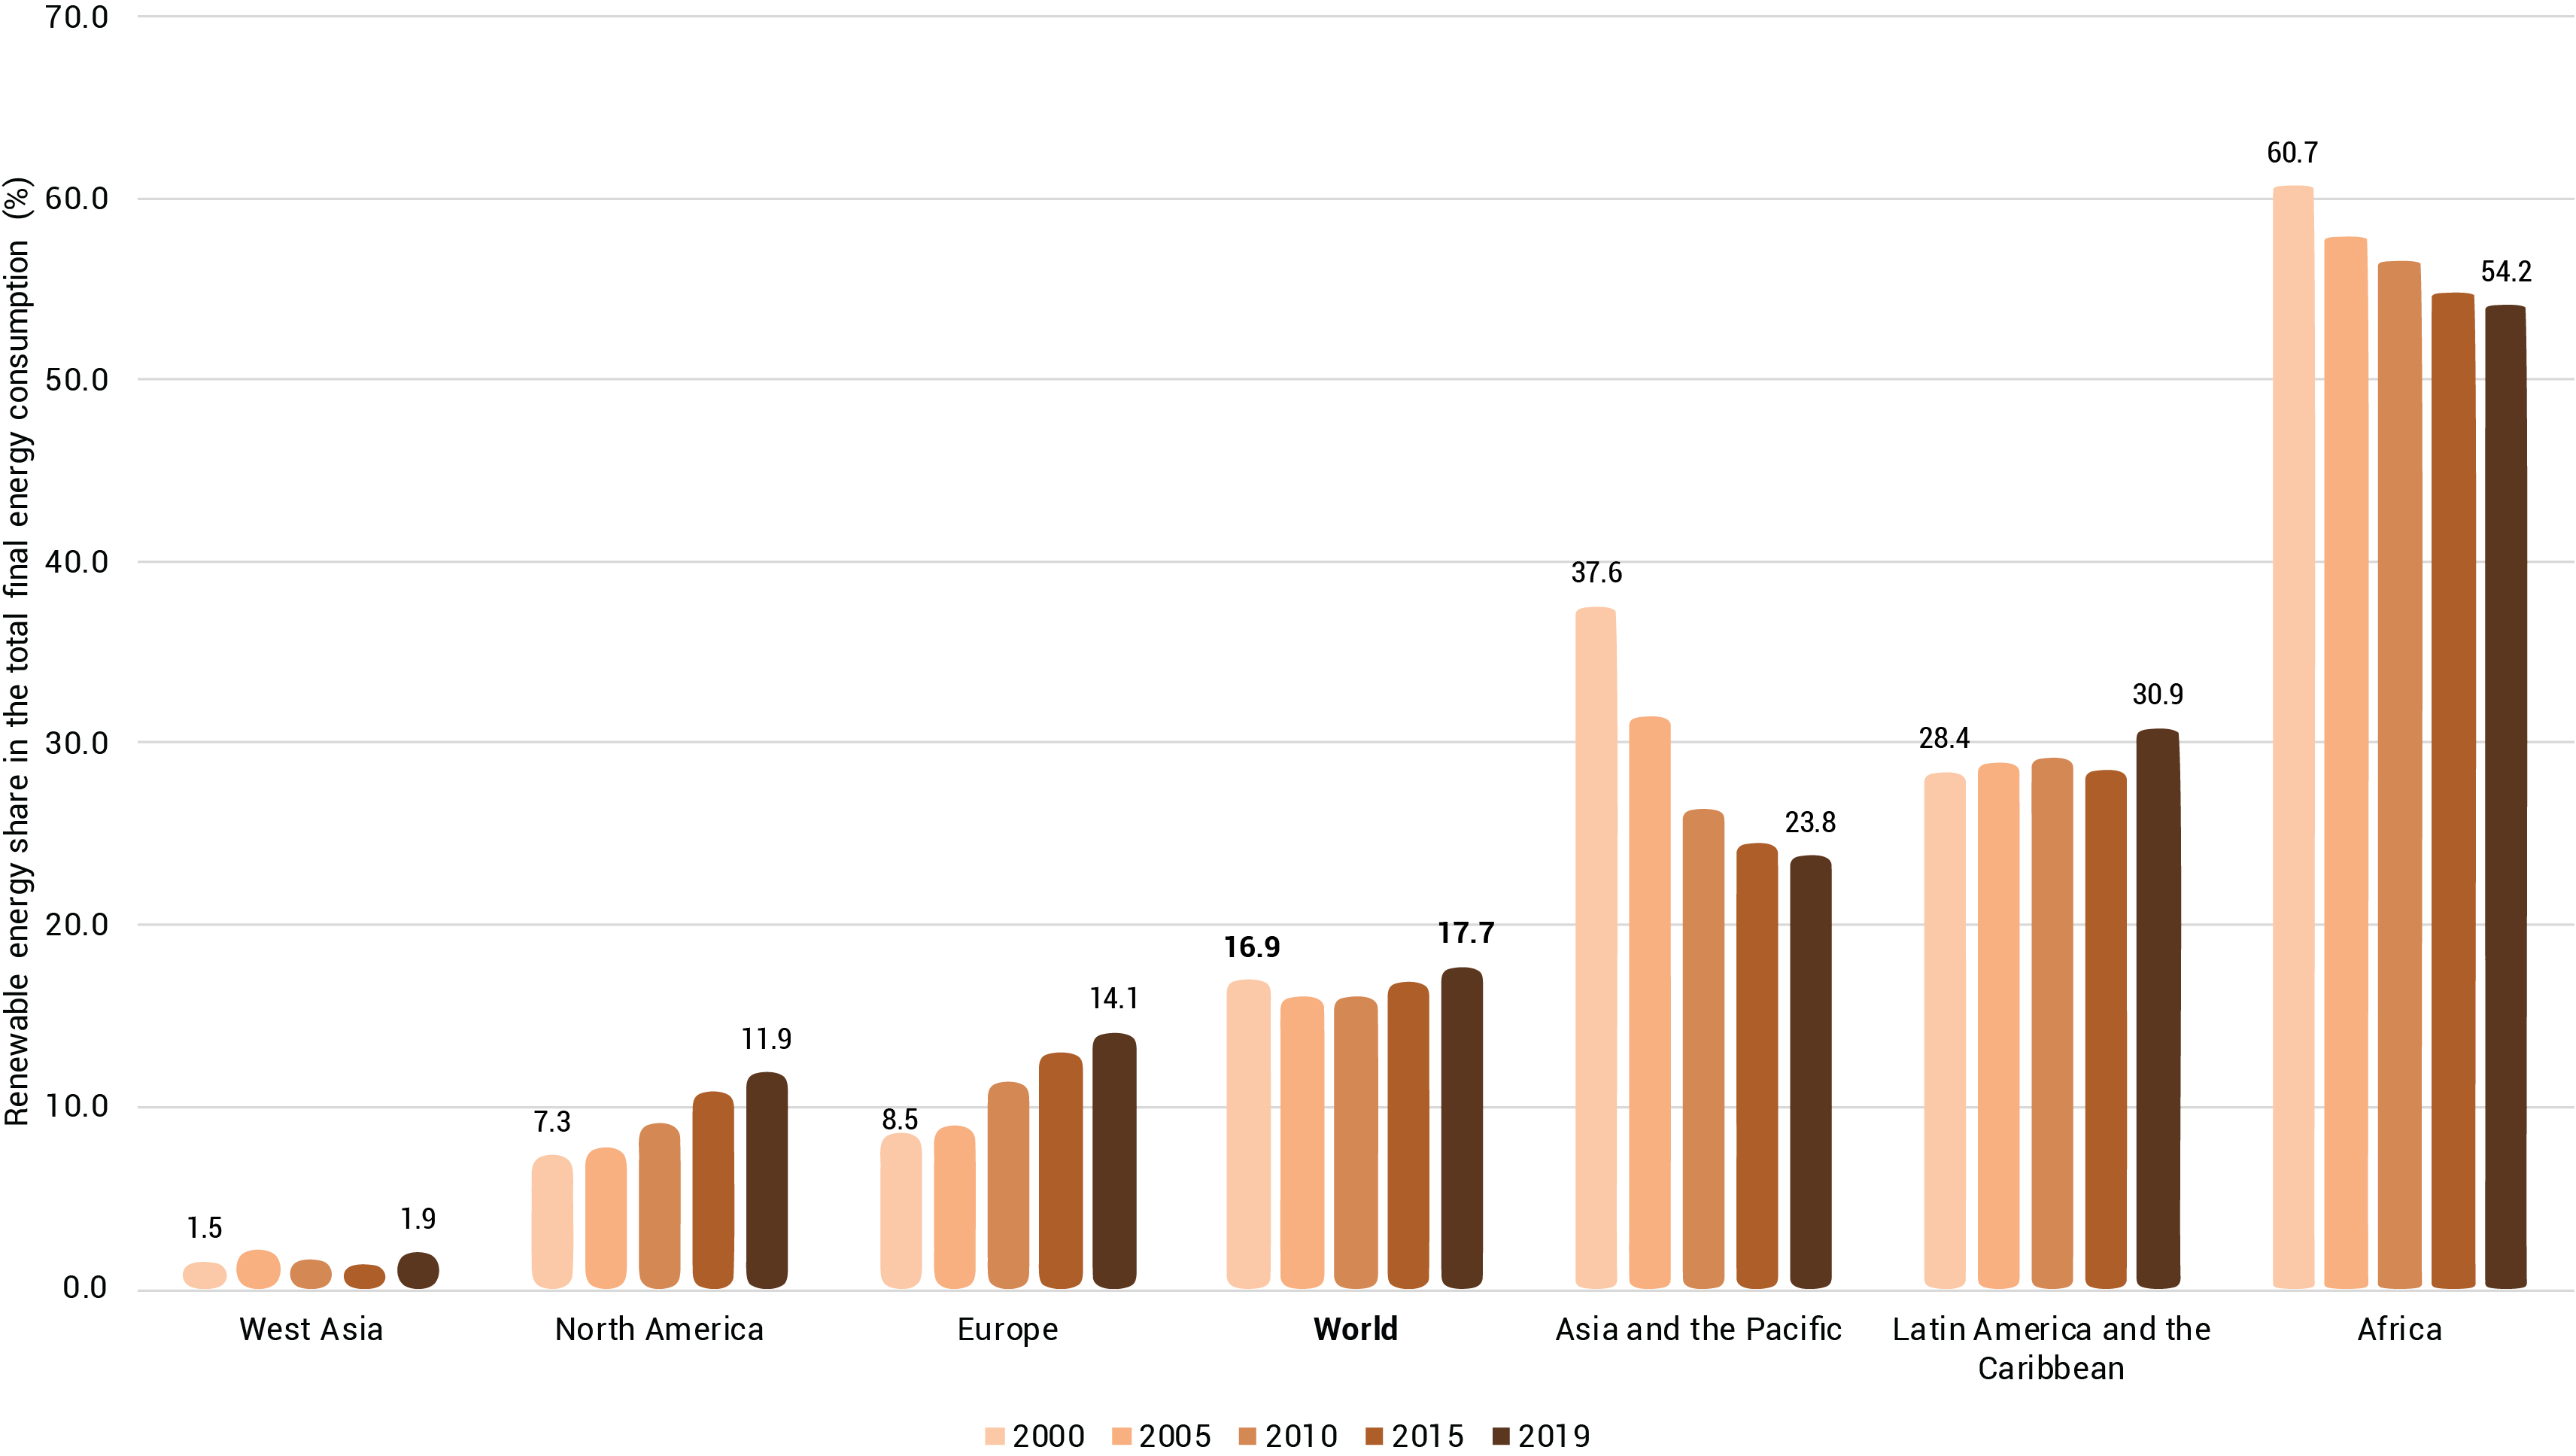
Indicator 7.2.1 is under SDG 7.2: “By 2030, increase substantially the share of renewable energy in the global energy mix”, Goal 7: “Ensure access to affordable, reliable, sustainable and modern energy for all”.
Globally, the share of renewable energy in total final energy consumption increased from 16.9 to 17.7 per cent between 2000 and 2019. The largest share was in Africa (54.2 per cent in 2019), mainly due to its high level of traditional biomass use, whereas use of modern renewables in Africa is significantly below the global average (PricewaterhouseCoopers 2021; IEA 2022b; IEA et al. 2022). Biomass used for energy production is not always fully renewable (Masera et al. 2015). Moreover, indoor and outdoor biomass burning has long been acknowledged to adversely affect the climate, air quality and human health (Johnston et al. 2019; Karanasiou et al. 2021; Zhang et al. 2022). In addition the use of wood fuel for cooking is responsible for indoor exposure to particulate matter estimated to cause 3.76 million premature deaths globally in 2016 (WHO, The Global Health Observatory, 2022b).
If traditional use of biomass in Africa is excluded, Latin America and the Caribbean is the region with the highest renewable energy share because of its modern renewable energy consumption (e.g. hydropower and bioenergy) (IEA et al. 2022). Shares in North America and Europe increased from 7.3 to 11.9 per cent and from 8.5 to 14.1 per cent, respectively. The lowest share was in West Asia, which increased from 1.5 to 1.9 per cent).
See detailed information▼ or search the most up to date data
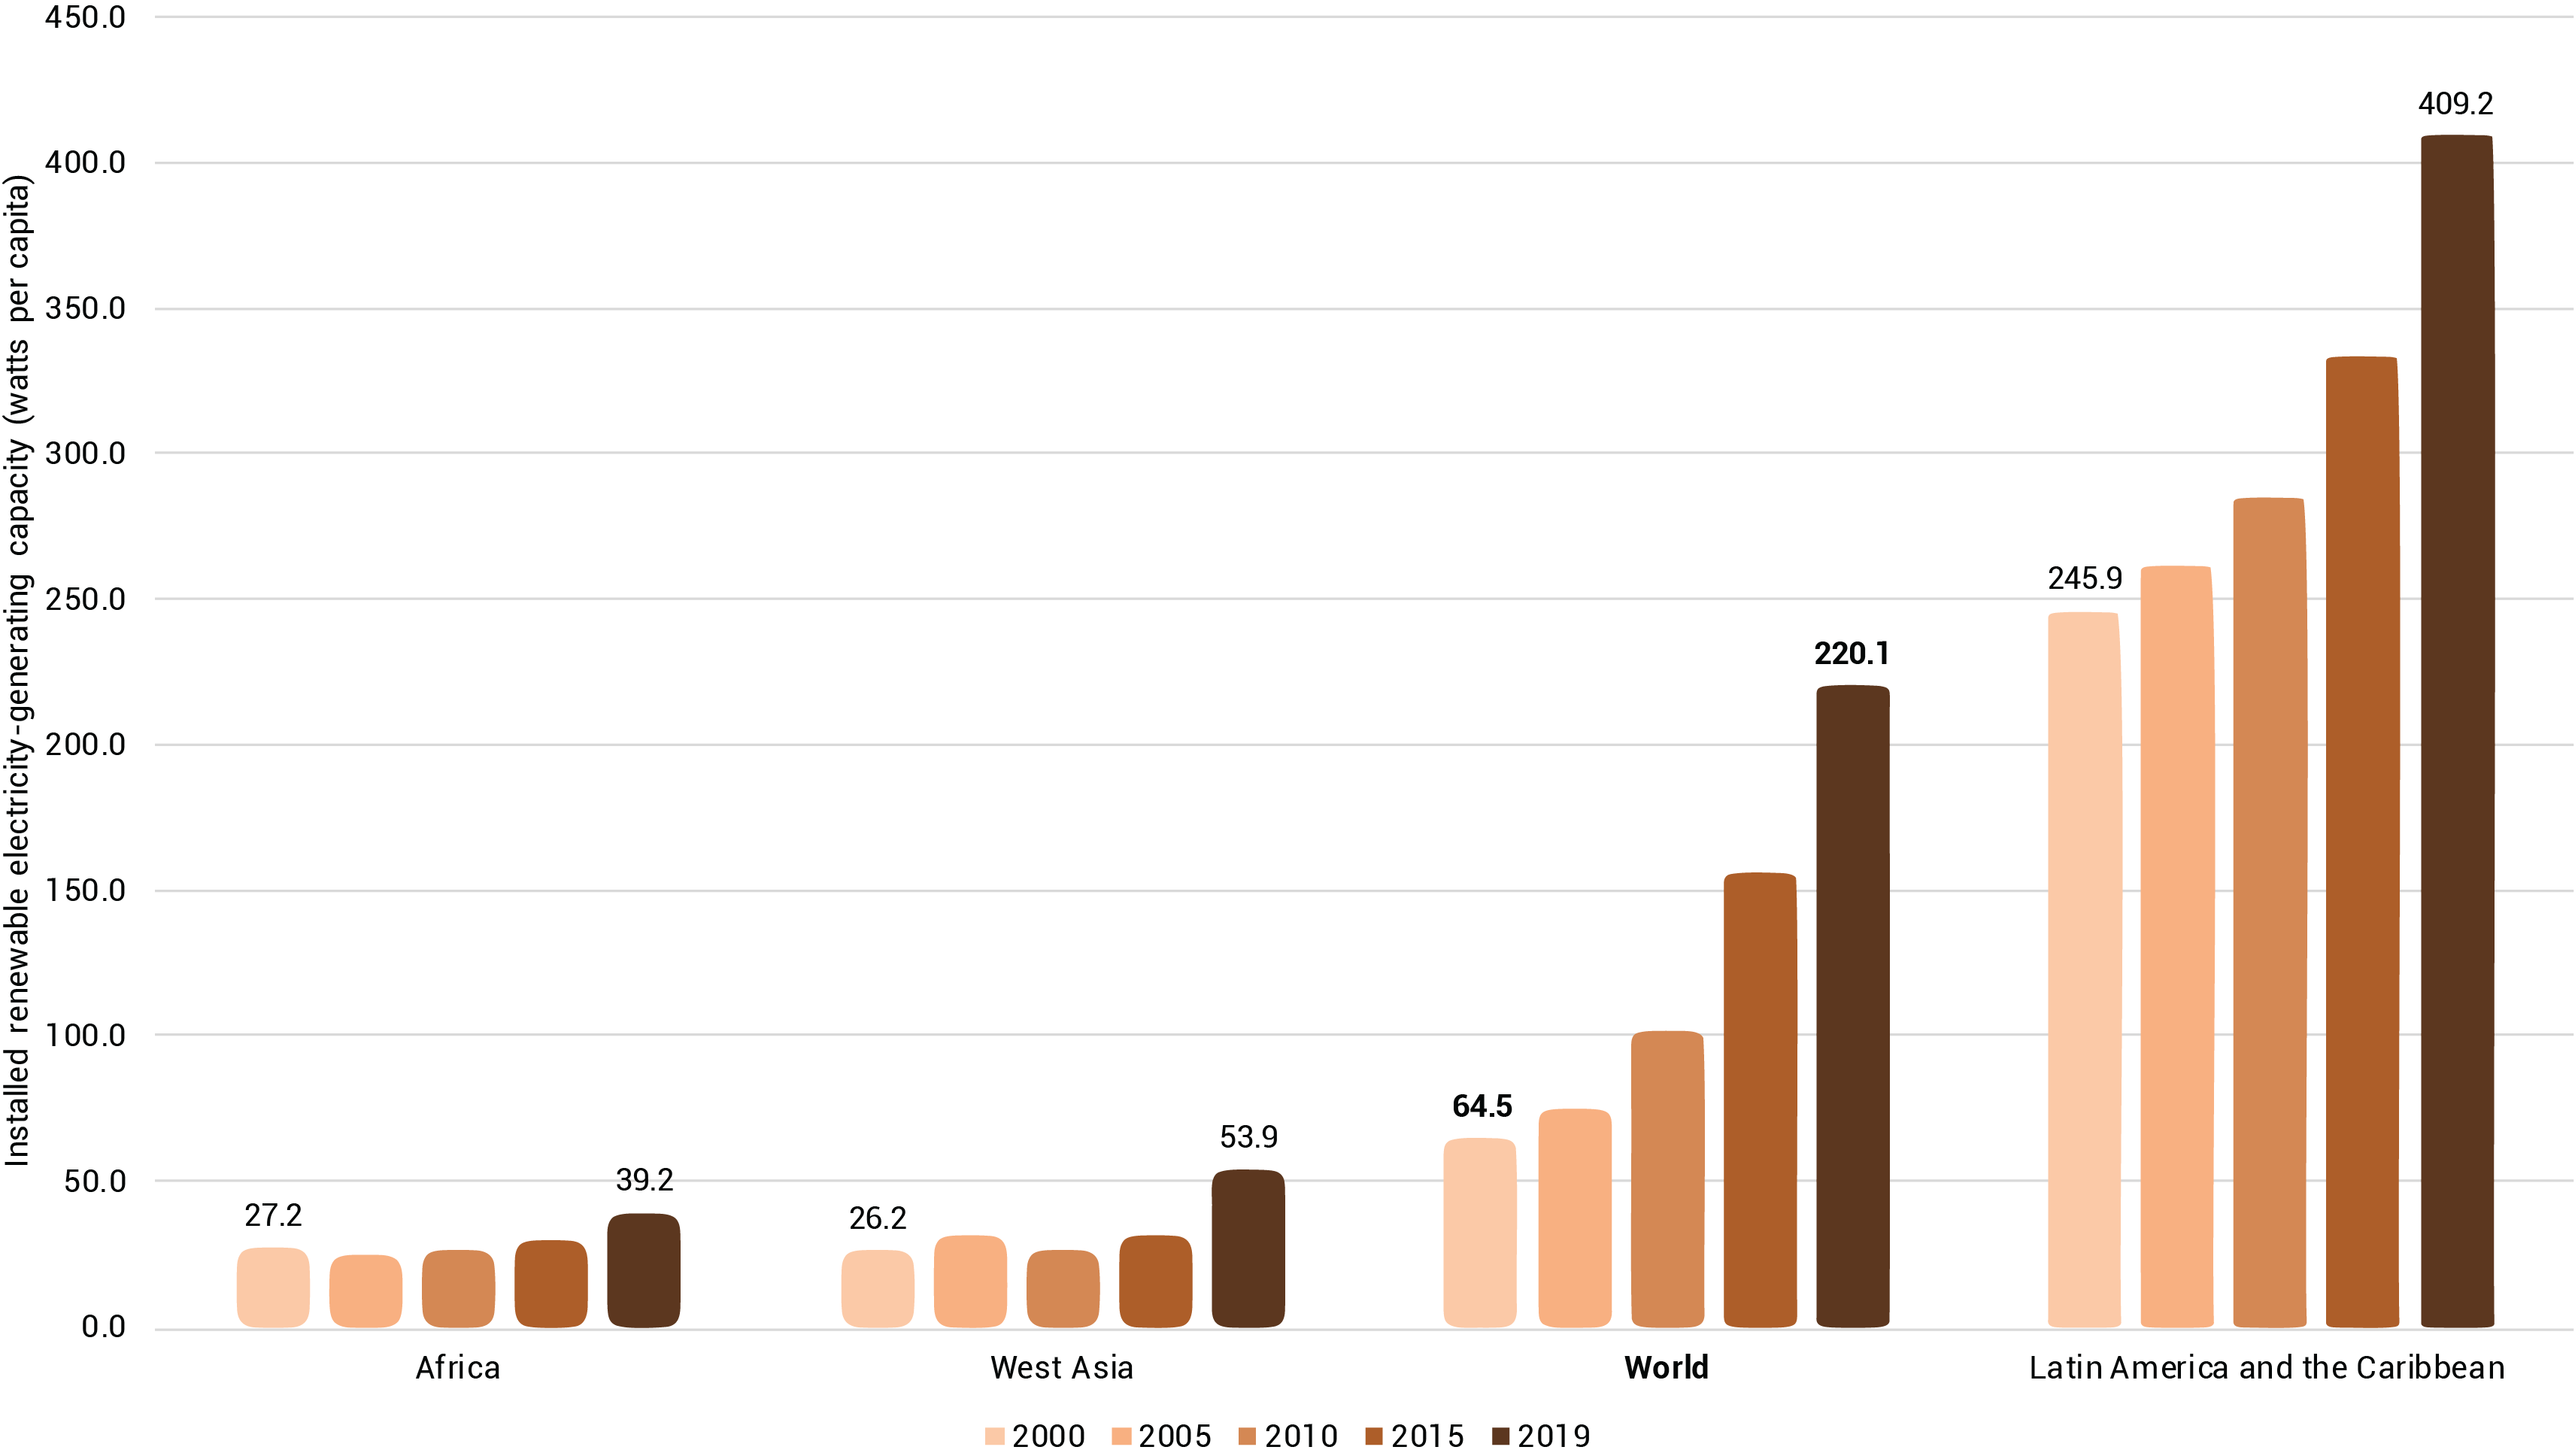
Indicator 12.a.1/7.b.1 is under SDG 7.2: “By 2030, increase substantially the share of renewable energy in the global energy mix”, Goal 7.b: “By 2030, expand infrastructure and upgrade technology for supplying modern and sustainable energy services for all in developing countries, in particular least developed countries, small island developing States and landlocked developing countries, in accordance with their respective programmes”.
Globally, installed renewable energy-generating capacity increased sharply between 2000 and 2019 from 64.5 to 220.1 watts per capita. In the regions shown here the largest capacity was in Latin America and the Caribbean, where it increased from 245.9 to 409.2 watts per capita. Africa and West Asia had the smallest capacity, increasing from 27.2 to 39.2 and from 26.2 to 53.9 watts per capita, respectively.
DPSIR Indicator Framework: Freshwater Pollution
See detailed information▼ or search the most up to date data
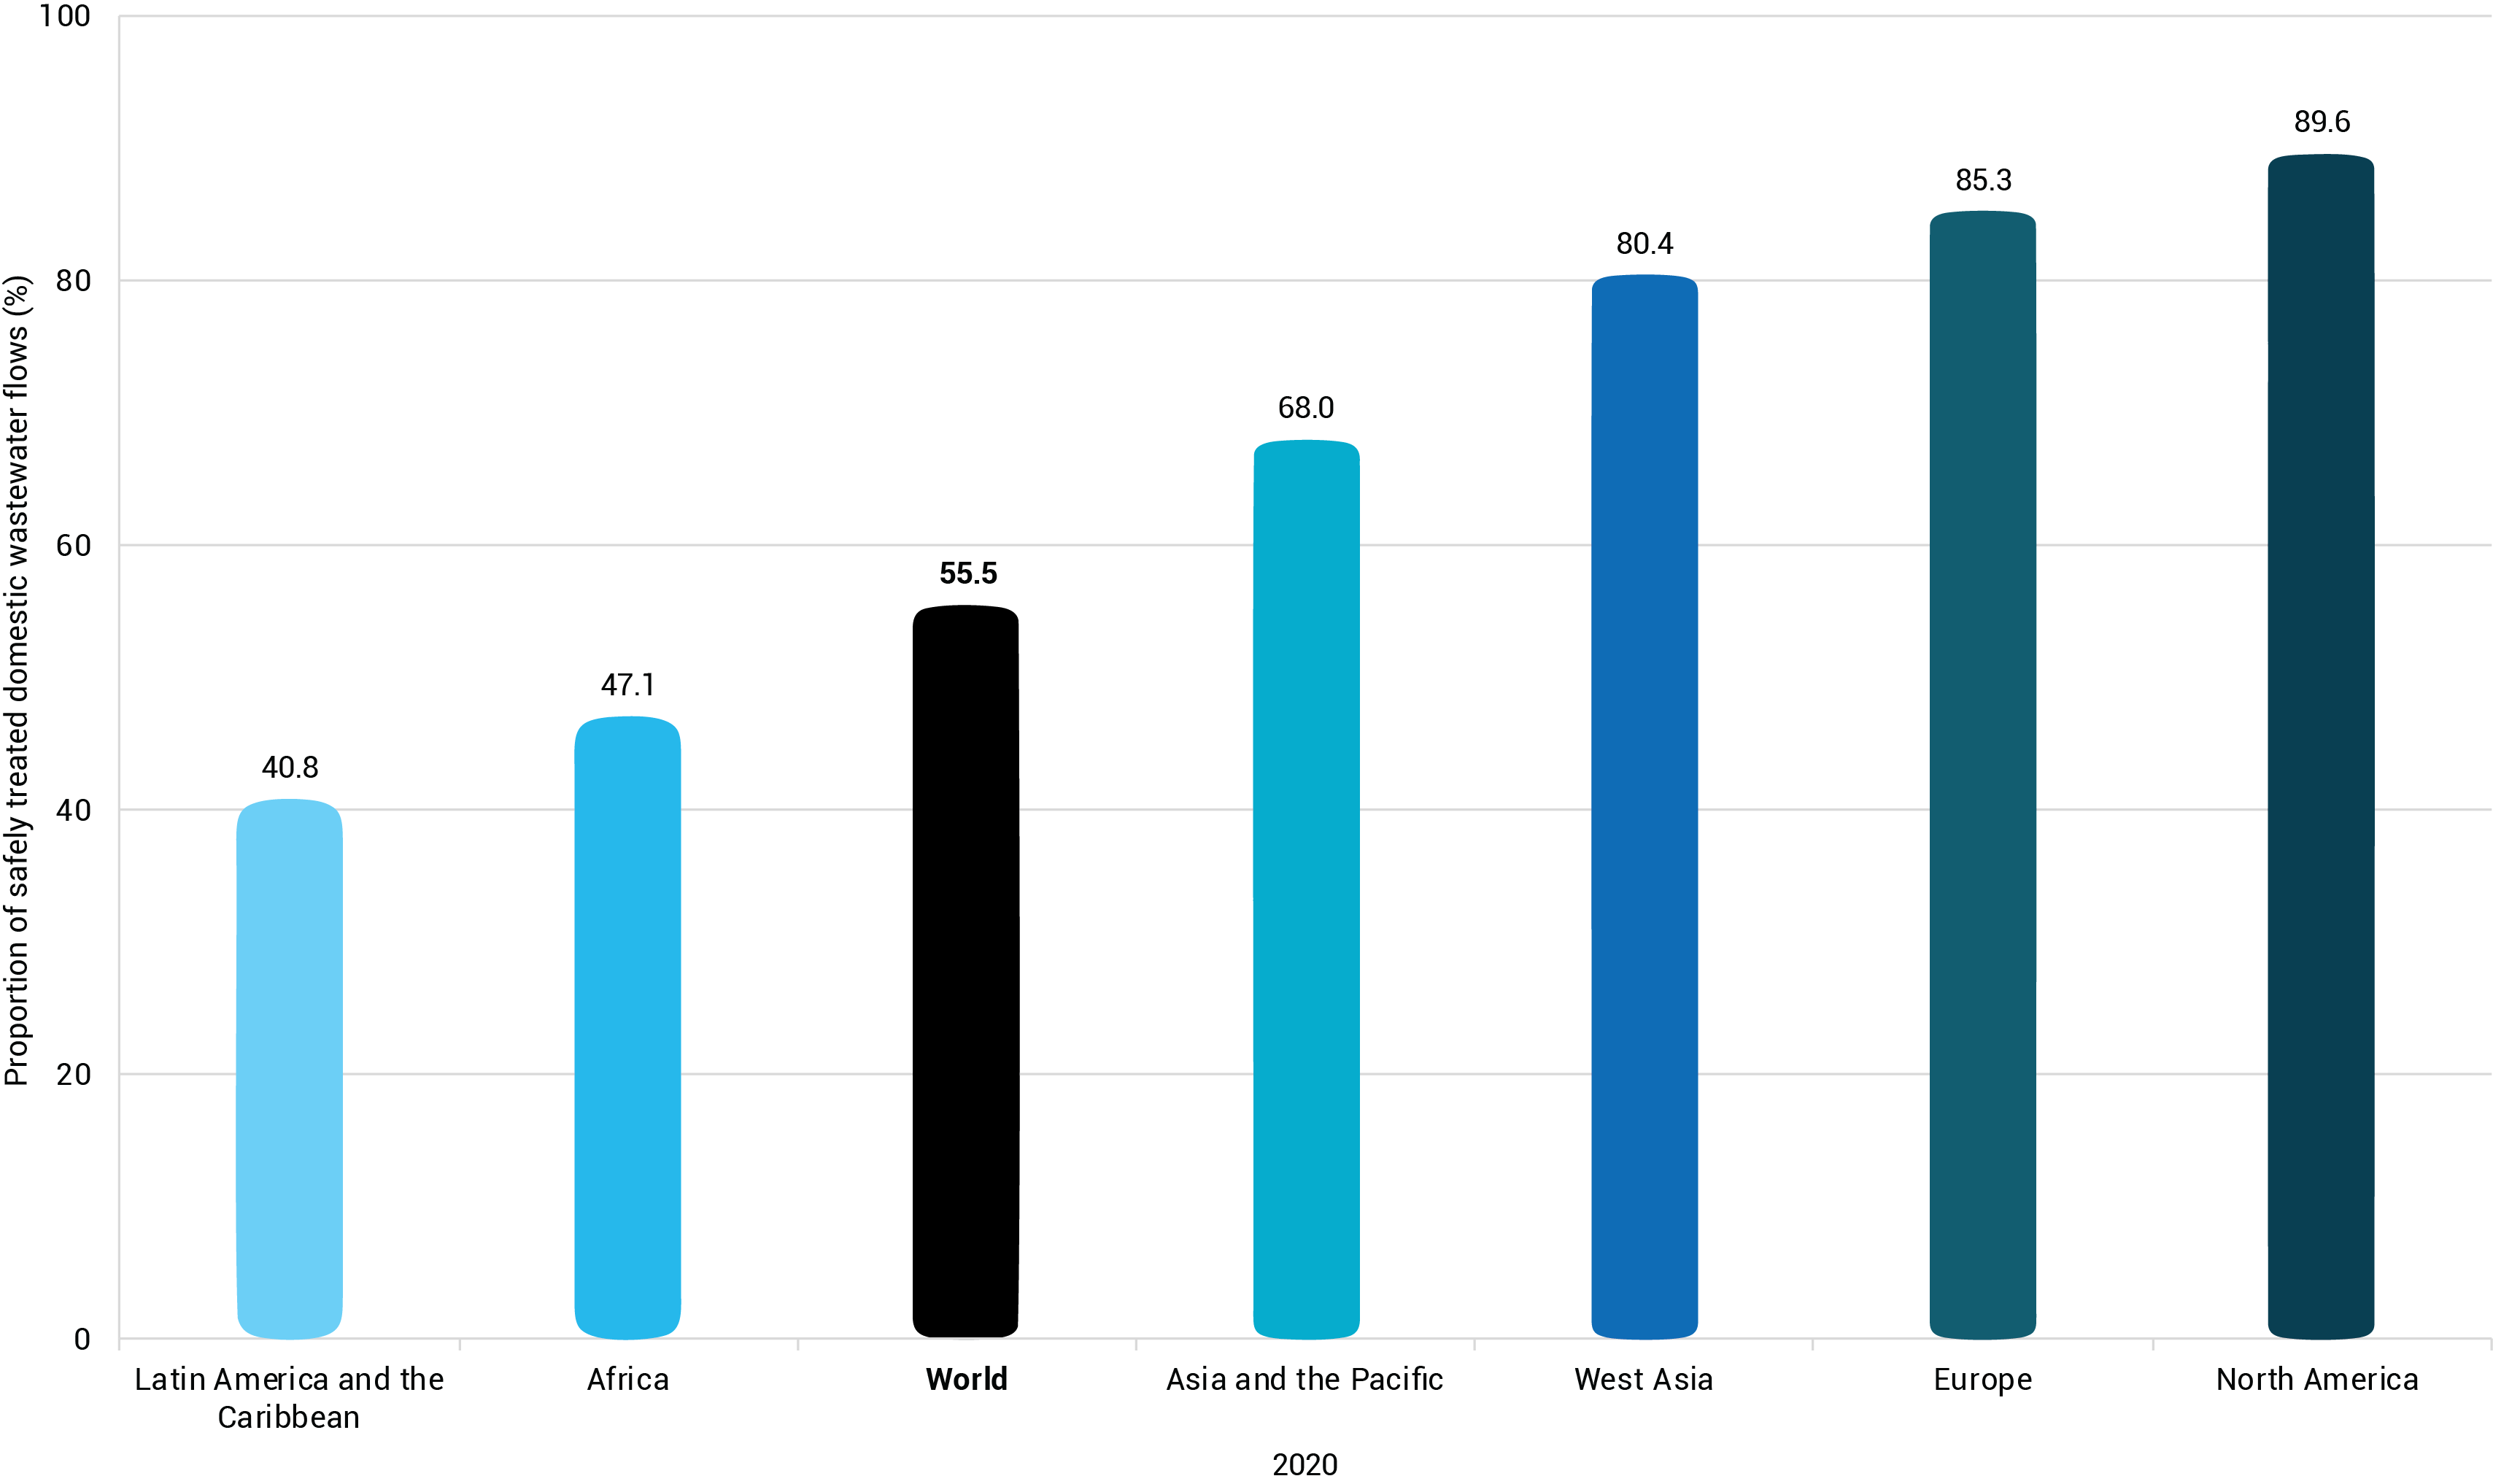
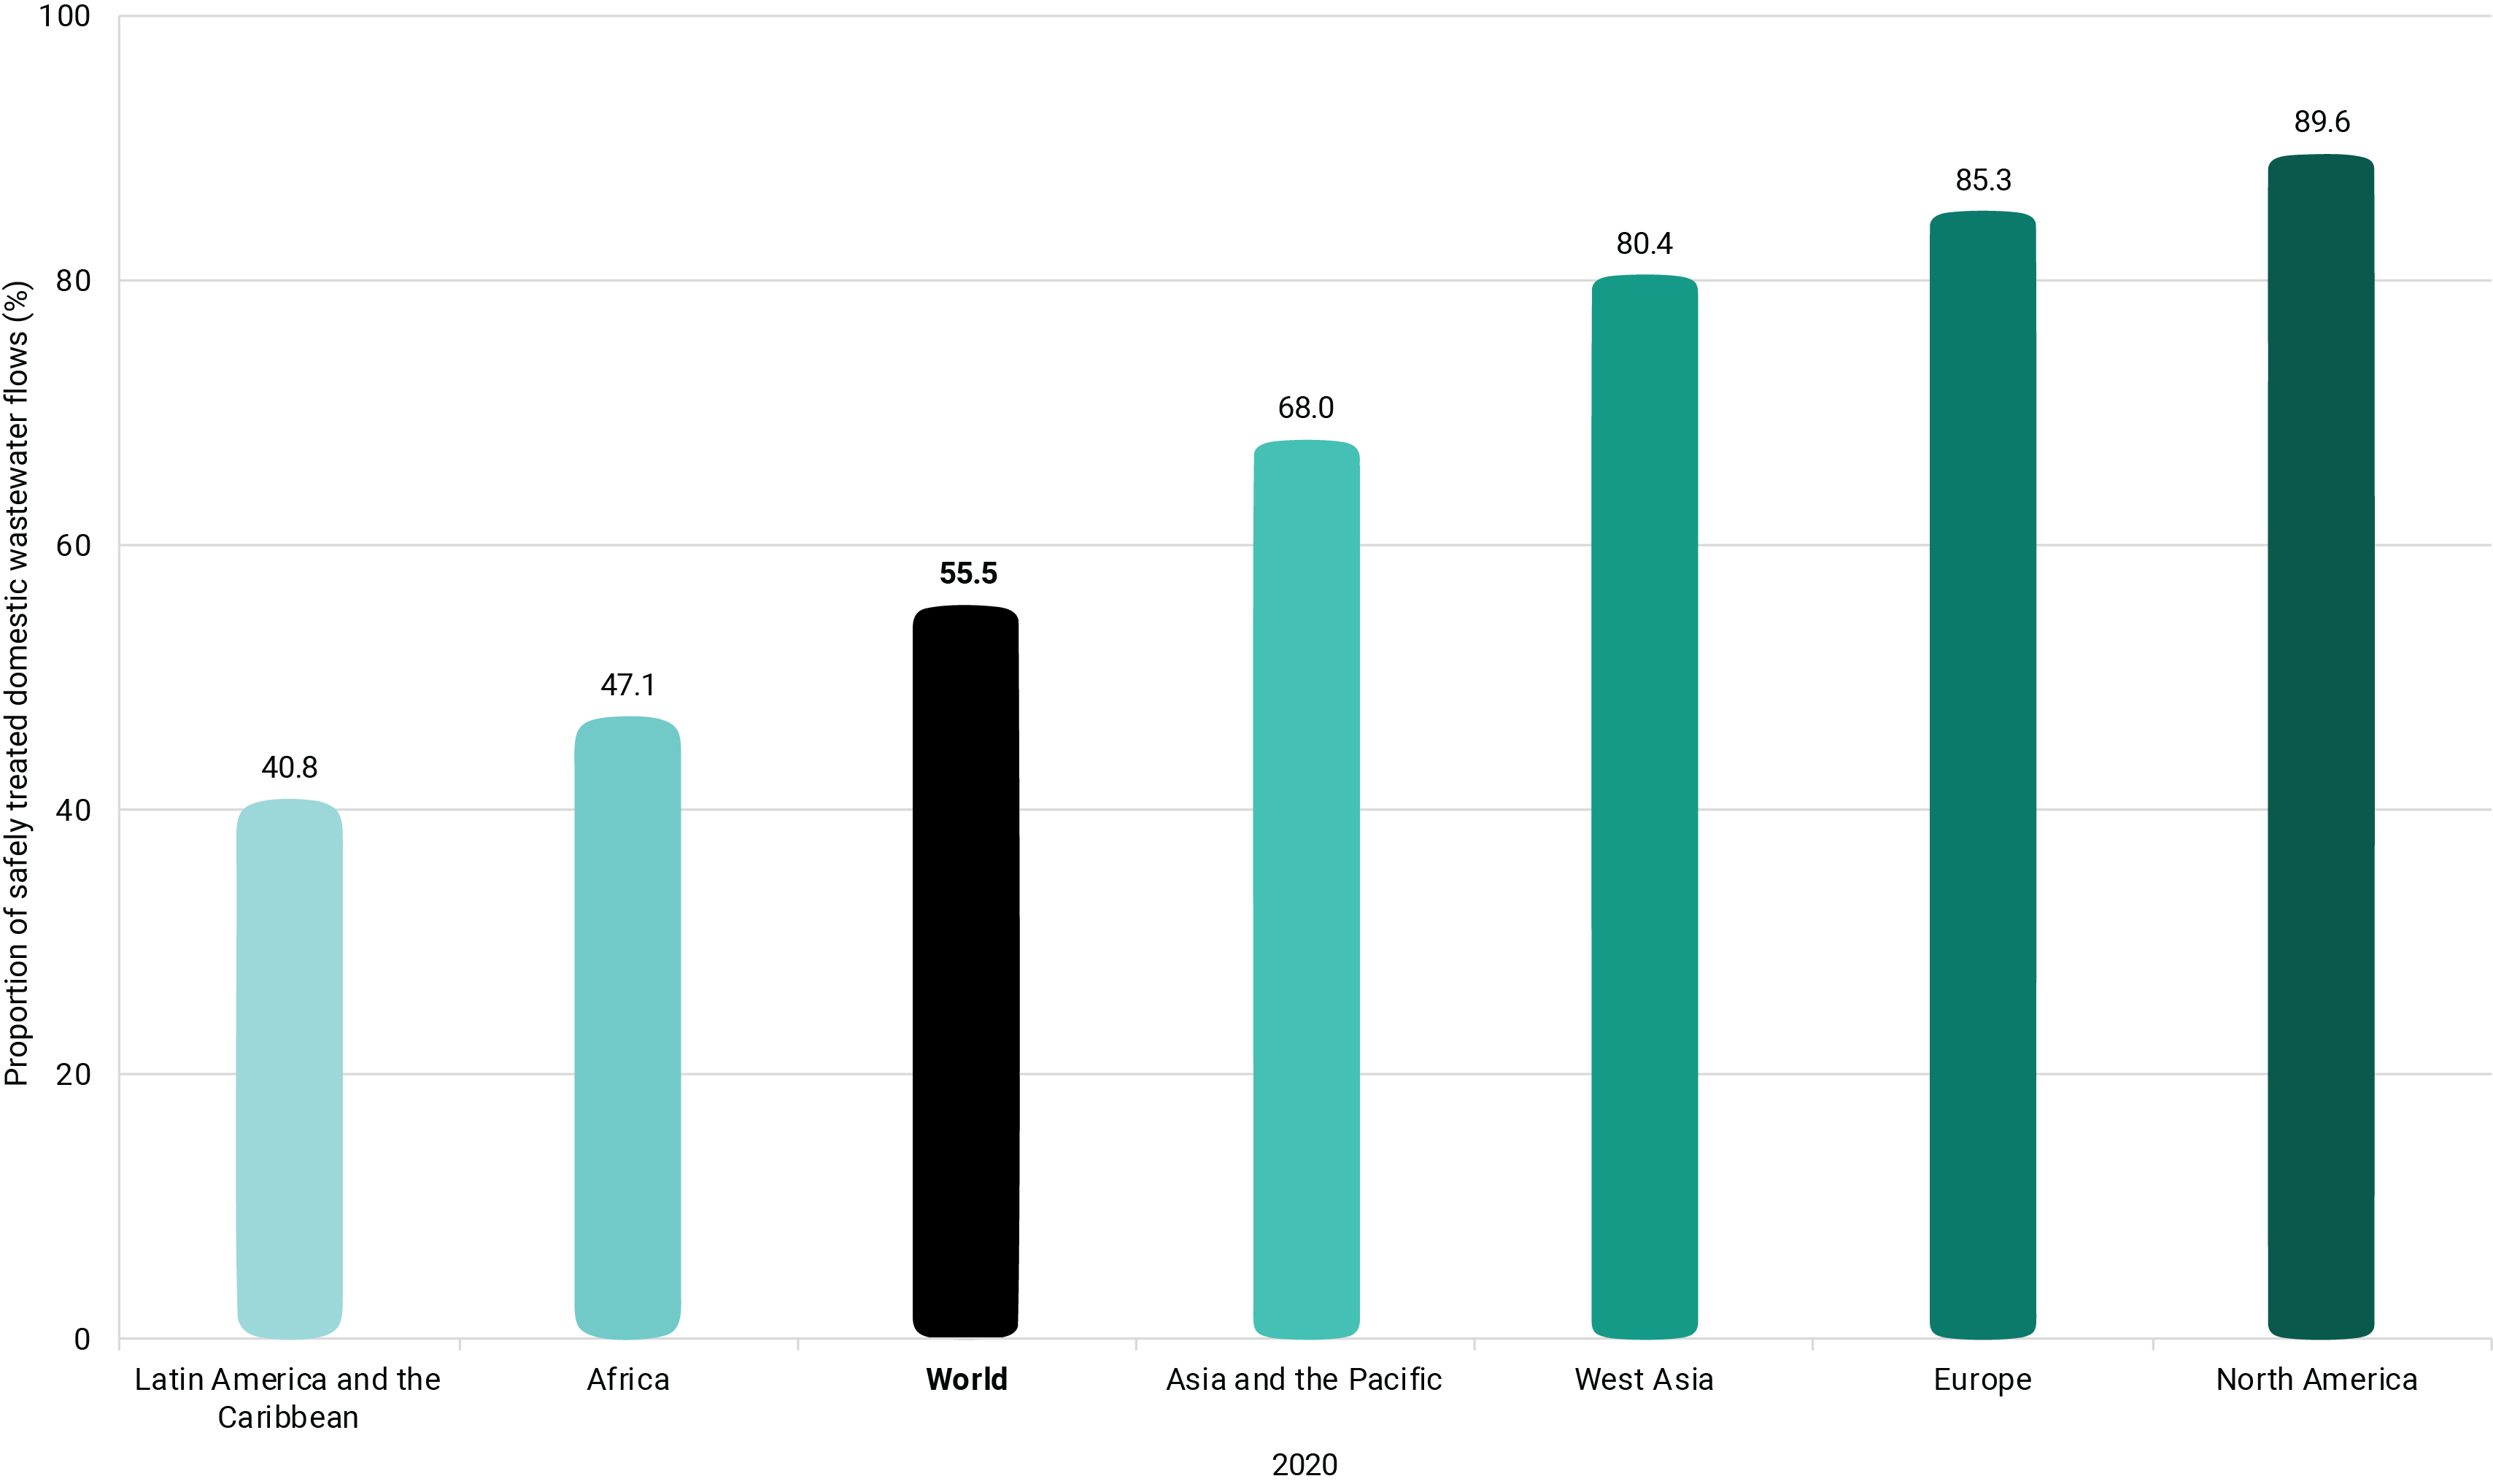
Indicator 6.3.1 is under SDG 6: “Ensure availability and sustainable management of water and sanitation for all”, Target 6.3: “By 2030, improve water quality by reducing pollution, eliminating dumping and minimizing release of hazardous chemicals and materials, halving the proportion of untreated wastewater and substantially increasing recycling and safe reuse globally”.
Globally in 2020, only around 55 per cent of domestic and industrial wastewater was considered to be safely treated. In North America almost 90 per cent was considered to be safely treated, followed by Europe at about 85 per cent. The lowest values were observed in Latin America and the Caribbean and in Africa (around 41 per cent and around 47 per cent, respectively).
Efficient wastewater treatment is indispensable to improve public health and minimize the adverse impacts of untreated wastewater flows on nature and the environment (UNEP 2019). Accelerated population growth, rapid urbanization and climate change all increase pressures on existing wastewater treatment plants, leading to insufficiently treated effluent discharges (Naidoo and Olaniran 2014; Hughes et al. 2021). Untreated wastewater presents potential threats to the environment and human health through contamination with bacteria, viruses, hazardous chemicals and micropollutants (Talvitie et al. 2017; UNEP 2017) that cause widespread diseases such as cholera, diarrhea, and dysentery (UNEP, 2017a).
Stringent methods for monitoring discharged effluents are essential if pollution laws and discharge permits are to be strictly enforced (World Health Organization [WHO] and United Nations Human Settlements Programme [UN-Habitat] 2018). Where conventional wastewater treatment methods are not in place or cannot be implemented, the use of alternative and low-cost treatment technologies can be encouraged if they are applied with appropriate insulation to avoid seepage to groundwater and freshwater streams.
See detailed information▼ or search the most up to date data
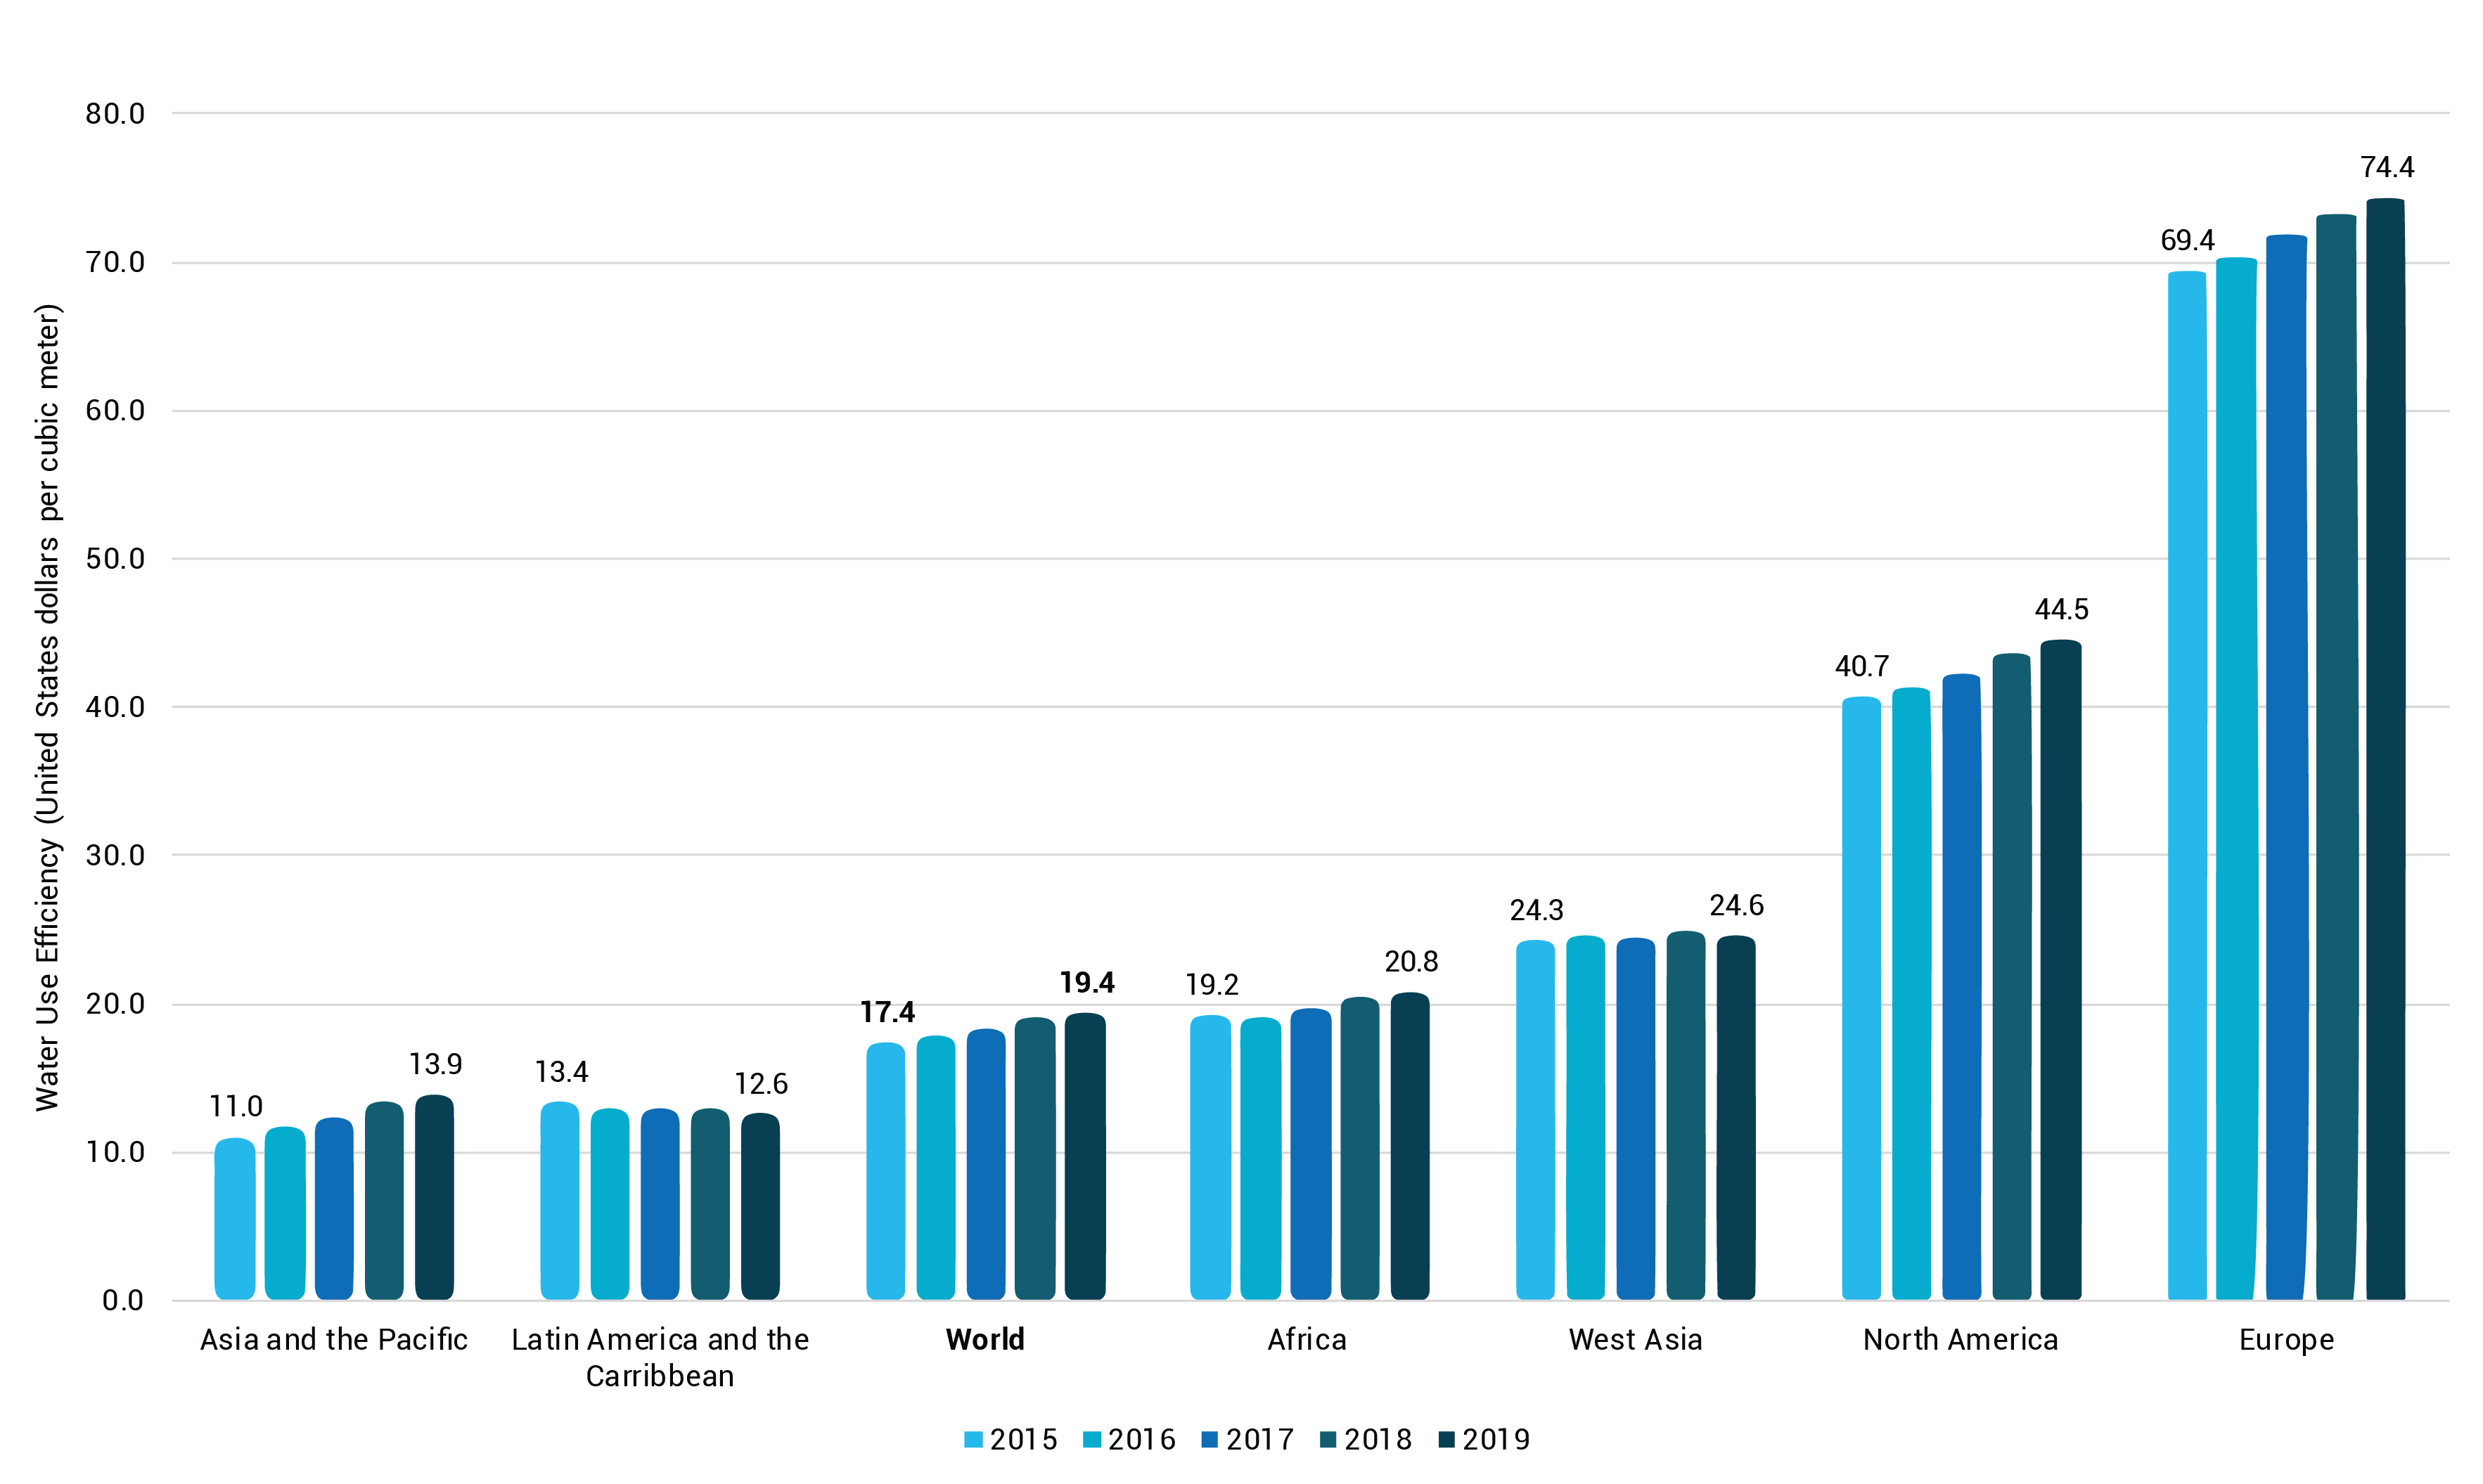
Globally, water-use efficiency (WUE) was US$ 17.4/m3 in 2015 and US$ 19.4/m3 in 2019. It was considerably higher in Europe than in other regions (US$ 69.4/m3 and US$ 74/m3). Significant differences among the other regions can be observed, ranging from US$ 40.7/m3 and US$ 44.5/m3 in North America to US$ 11.0/m3 and US$ 13.9/m3 in Asia and the Pacific.
The WUE indicator tracks the extent to which economic growth is dependent on use of water resources. It considers water use by all economic activities, with a focus on agriculture, industry and the service sector. The rapid development of economies is often accompanied by greater water use. Increasing WUE can alleviate pollution of sensitive freshwater ecosystems, enhance food security, ecosystem services, job creation and human well-being, and help to enable sustainable economic development (Long and Pijanowski 2017).
Improving WUE is an effective way to limit water scarcity and decouple economic development from the exploitation of finite freshwater resources (Velasco-Muñoz et al. 2018). Efforts to meet growing demand for water can push ecosystems to the edge of their environmental boundaries, highlighting the importance of increasing the efficiency of water use from available freshwater resources (FAO 2021).
See detailed Information▼ or Search the most up to date data
Indicator 6.4.2 is under SDG 6: “Ensure availability and sustainable management of water and sanitation for all”, Target 6.4: “By 2030, substantially increase water-use efficiency across all sectors and ensure sustainable withdrawals and supply of freshwater to address water scarcity and substantially reduce the number of people suffering from water scarcity.”
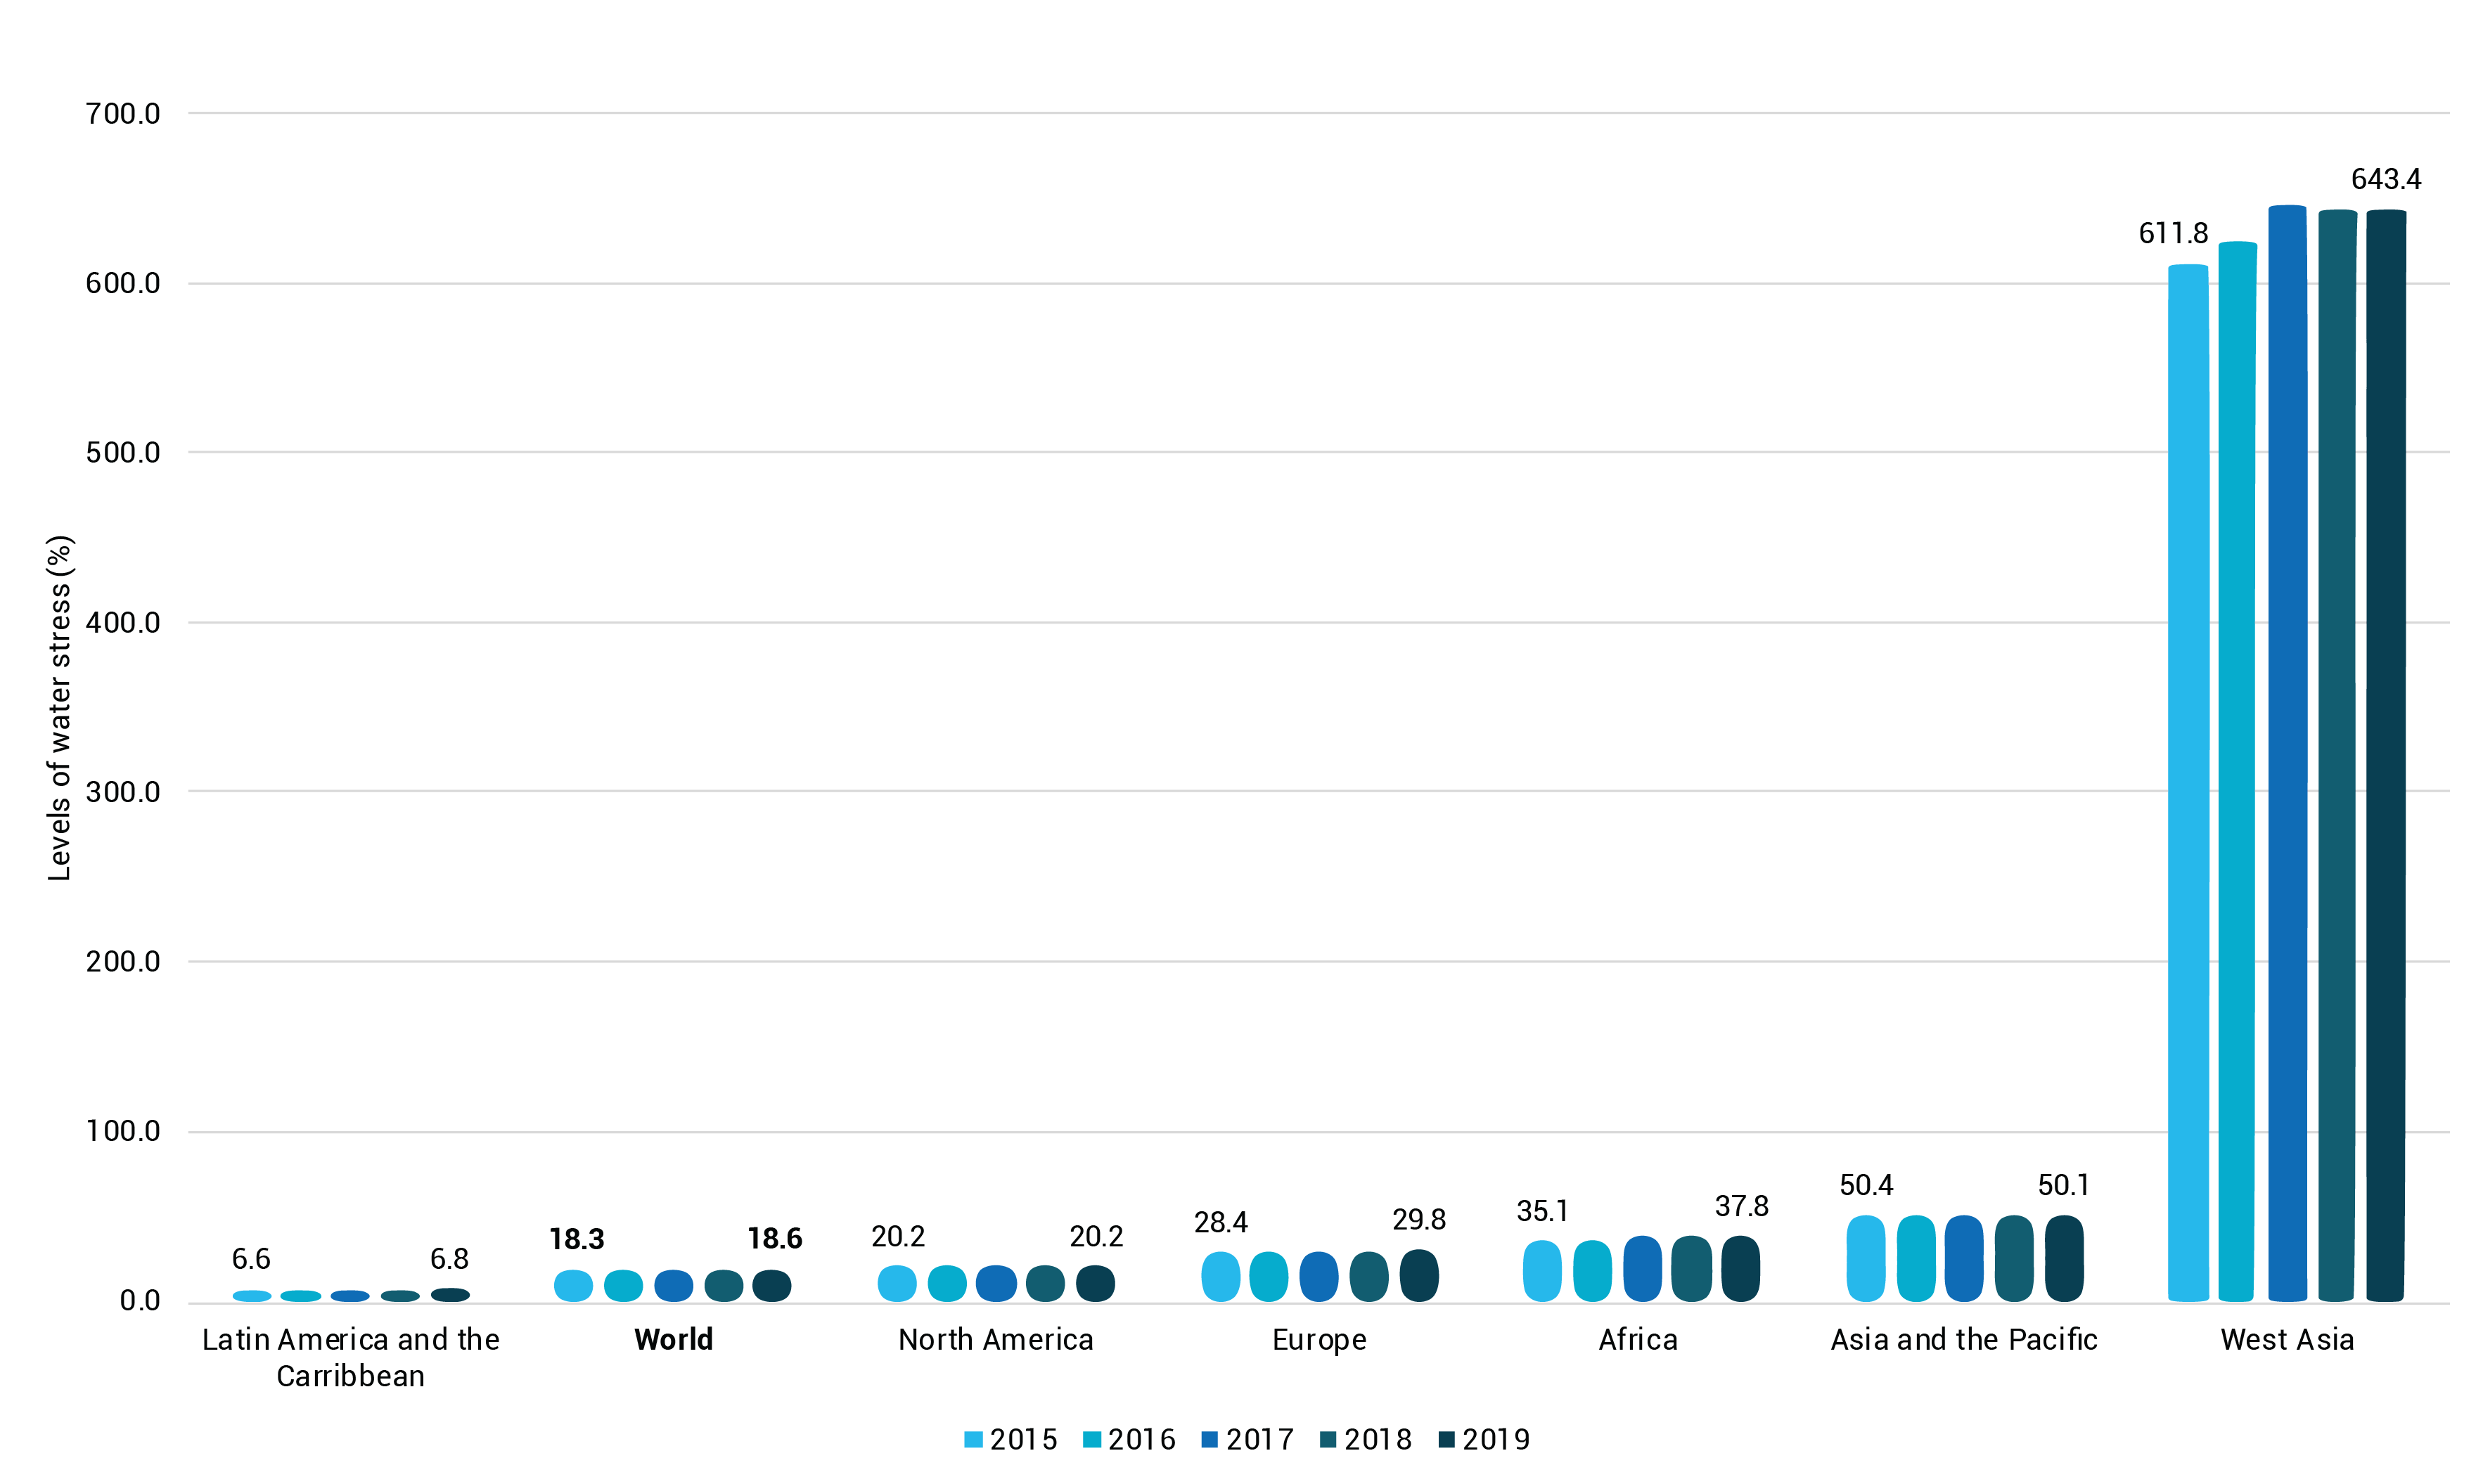
The level of water stress globally was 18.3 per cent in 2015 and had slightly worsened, to 18.6 per cent, in 2019. It was considerably higher in Asia and the Pacific (50.4 per cent and 50.1 per cent) than in other regions. It was lowest in Latin America and the Caribbean (6.6 per cent and 6.8 per cent).
Water stress exists when demand for water exceeds the available amount during a certain period or when poor quality restricts water use. It causes deterioration of freshwater resources in terms of quantity (e.g. aquifer overexploitation, dry rivers) and quality (e.g. eutrophication, pollution with organic matter, saline intrusion) (European Environment Agency 2020; FAO 2022). In parts of the world where water is abundant, intensive use of water resources may lead to a structural water abundance deficit, adversely affecting human health and economic development.
Withdrawal of water resources alters freshwater ecosystems through changes in quantity (altered flow and water levels) and quality (excess nutrients, pollution, biodiversity loss) (UNEP 2018). Freshwater ecosystems affected by high levels of water stress are more vulnerable to pollutants; these two stressors may act synergistically, as less water in water bodies leads to higher pollutant concentrations (Karaouzas et al. 2018). Desiccation can liberate pollutants and toxicants from dried sediments (Horwitz, Finlayson and Weinstein 2012). High levels of water stress have adverse effects on socioeconomic development by increasing competition and potential conflict among users (FAO 2021).
See detailed information▼ or Search the most up to date data
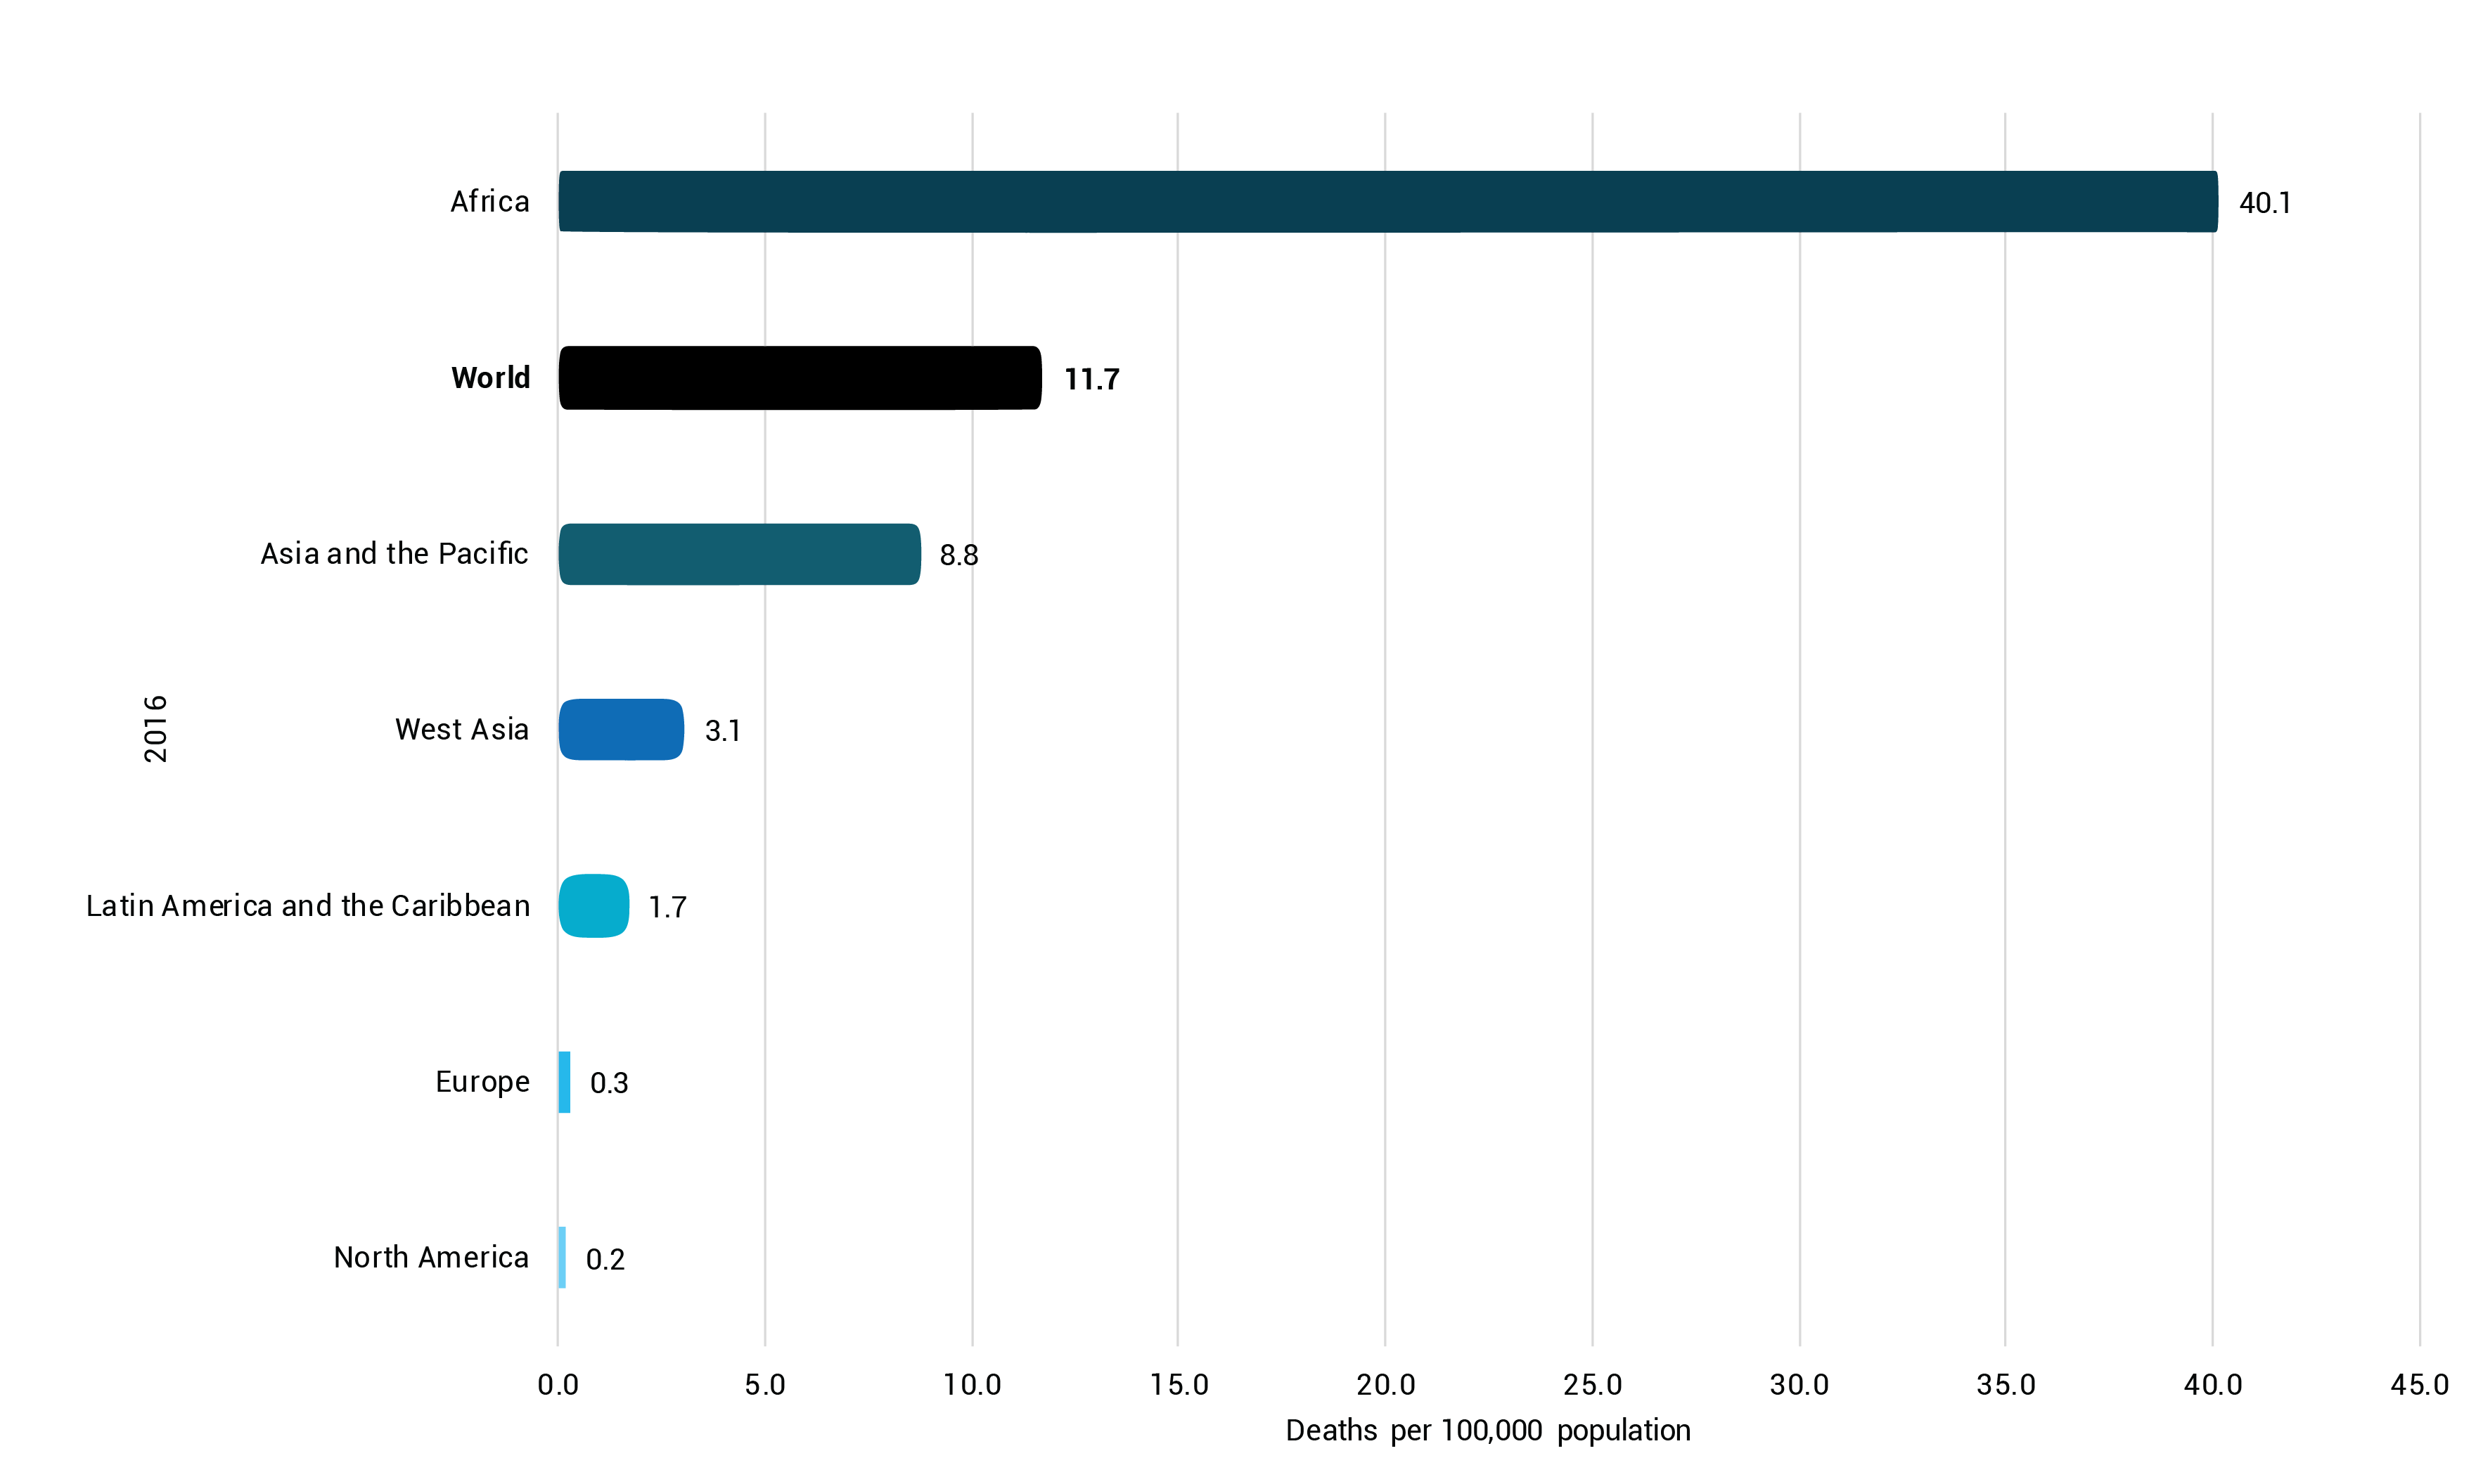
Indicator 3.9.2 is under SDG 3: “Ensure healthy lives and promote well-being for all at all ages”, Target 3.9: “By 2030, substantially reduce the number of deaths and illnesses from hazardous chemicals and air, water and soil pollution and contamination.”
Rates of mortality attributed to unsafe water, unsafe sanitation and lack of hygiene in 2016 differed significantly. The highest rate was in Africa, where there were 40.1 deaths per 100,000 population, almost four times the global average (11.7). The rate in Asia and the Pacific (8.3), West Asia (3.1) and Latin America and the Caribbean (1.1) was substantially higher than in Europe (0.3) and North America (0.2).
Inadequate access to Water, Sanitation and Hygiene (WASH) facilities entails significant human health risks. It is a major cause of diarrhoeal diseases and premature deaths, particularly in low-income environments (Prüss-Ustün et al. 2014). Untreated excreta in water bodies have adverse effects on human health (WHO and UN-Habitat 2018). They are the root cause of a plethora of diseases, with improper faecal sludge management and poor sanitation contributing to child and adult mortality (UNEP and International Water Management Institute [IWMI] 2020). Polluted surface water is often used by rural and poor communities for bathing, clothes washing, cooking and even drinking (UNEP 2016). Improving WASH facilities and freshwater ecosystems can alleviate heavy health and environmental burdens on communities as well as reducing the global burden of disease and mortality.
See detailed information▼ or Search the most up to date data
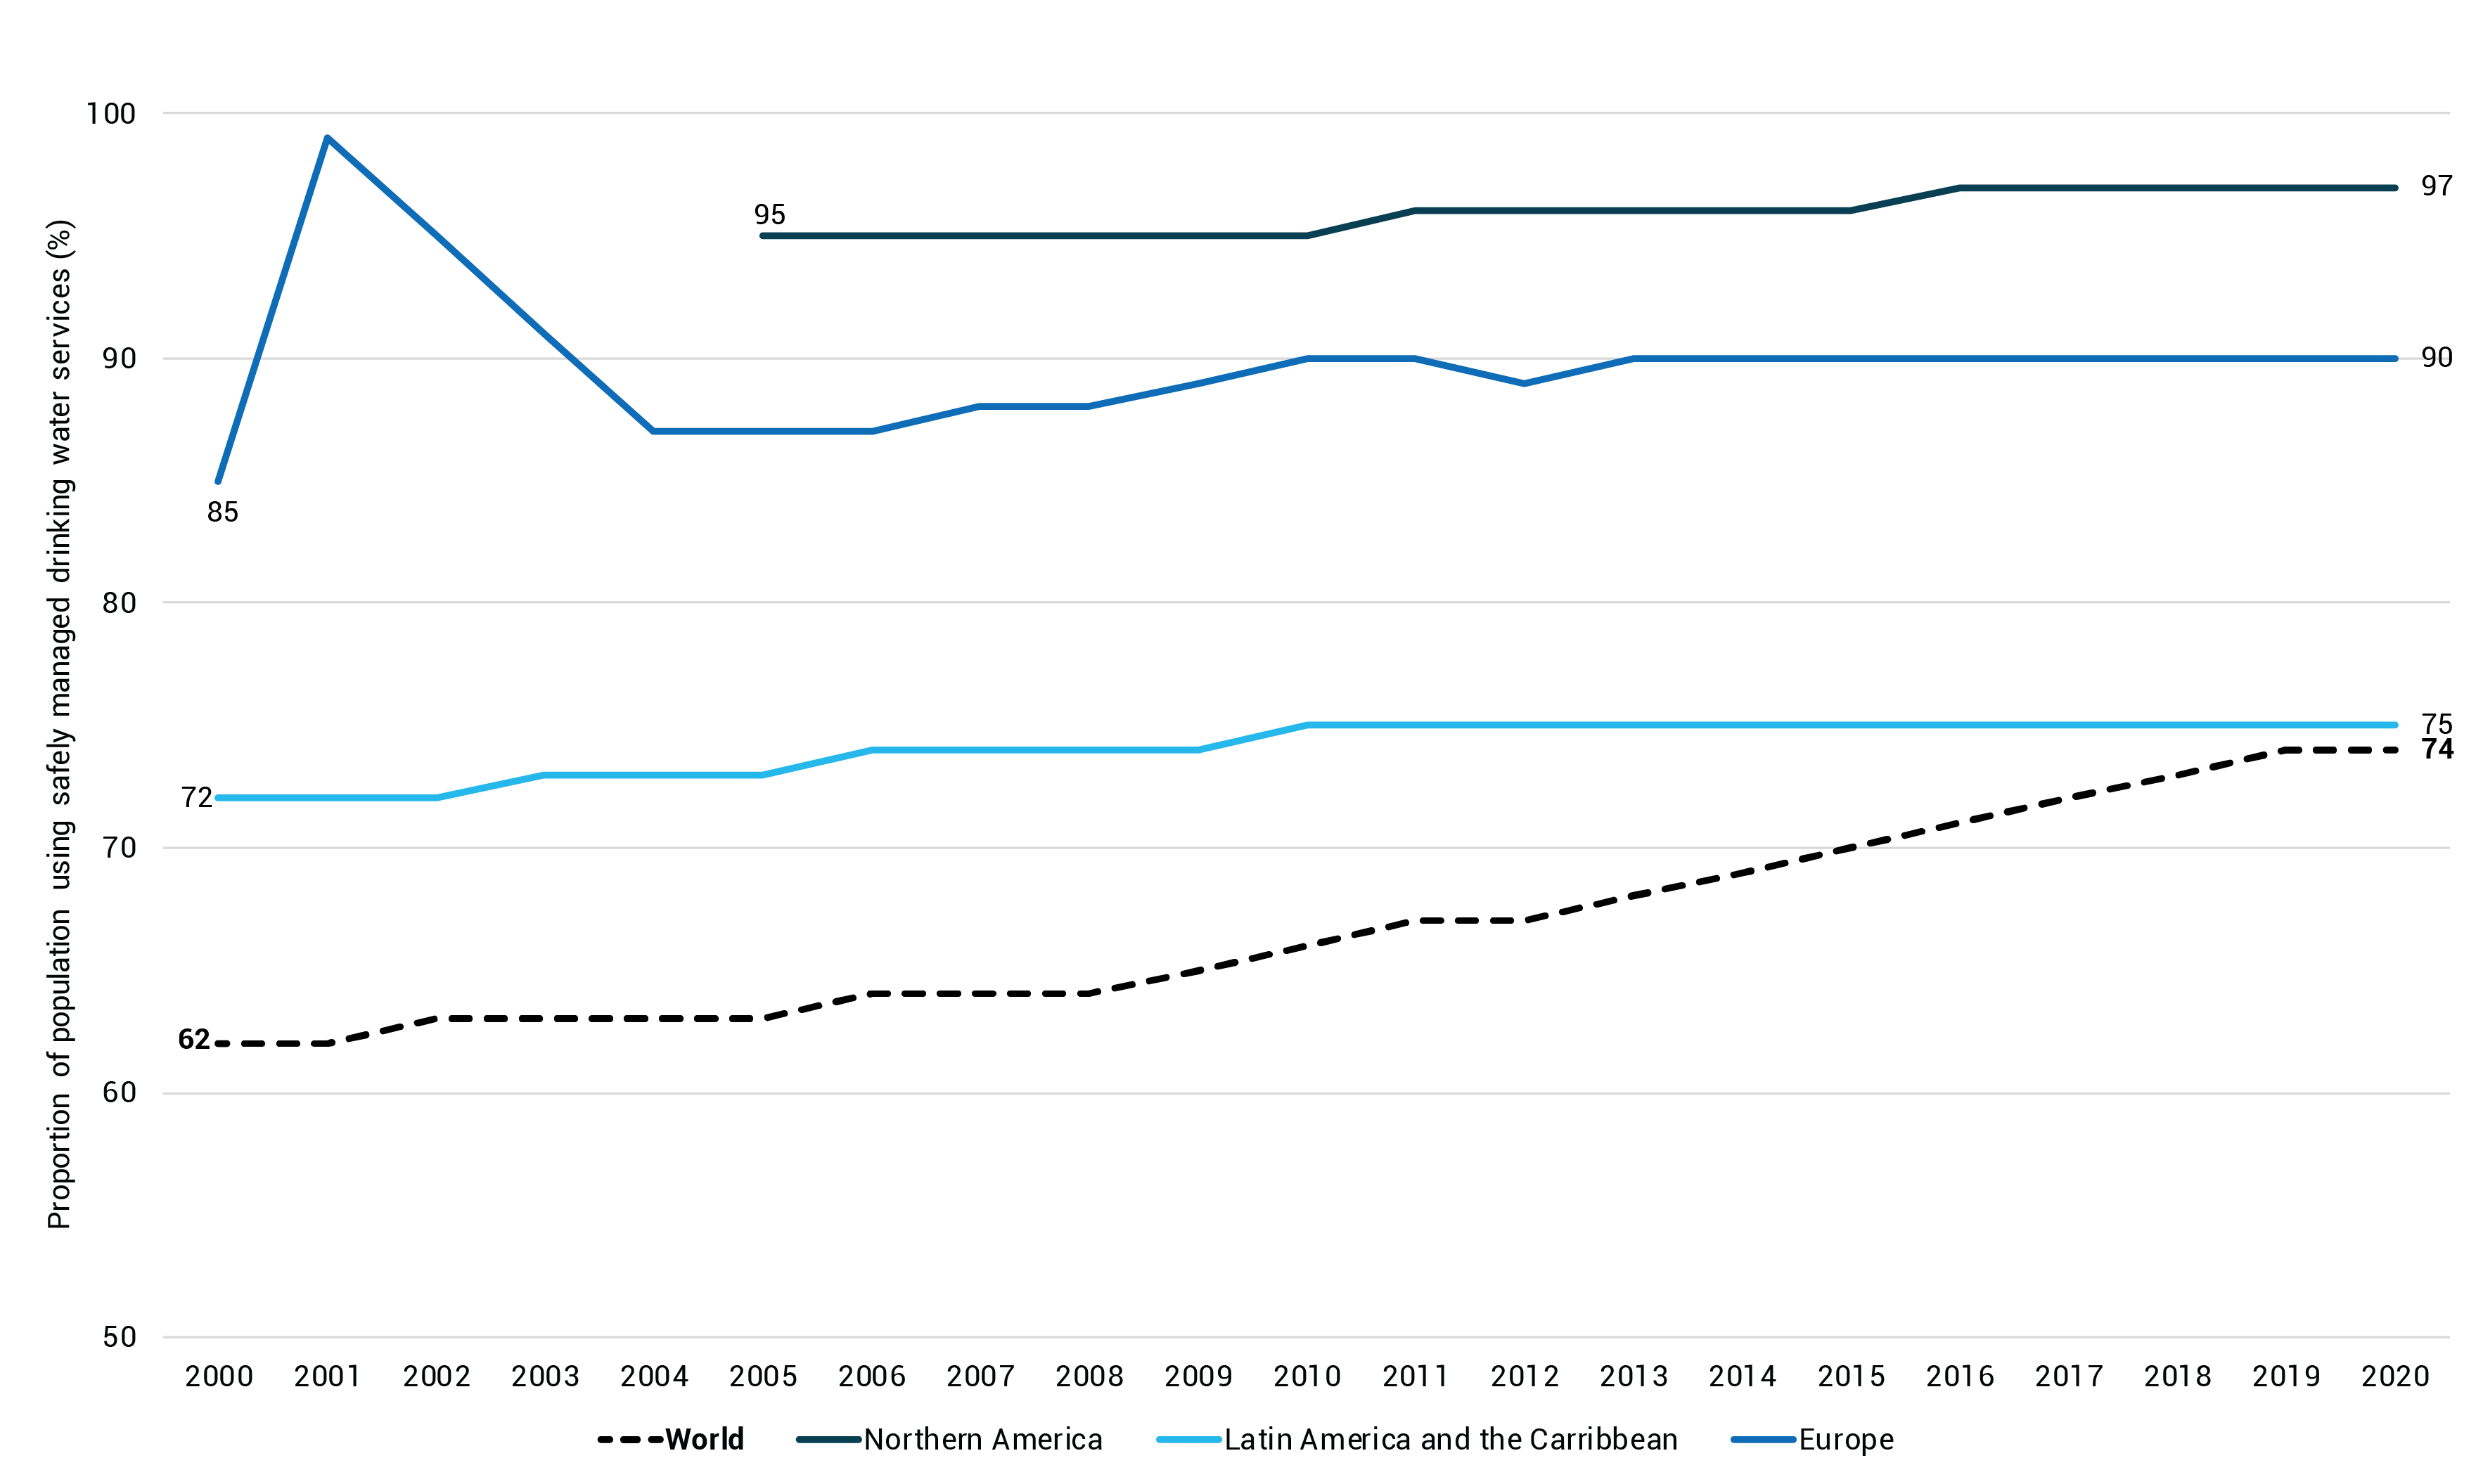
Indicator 6.1.1 is under SDG 6: “Ensure availability and sustainable management of water and sanitation for all”, Target 6.1: “By 2030, achieve universal and equitable access to safe and affordable drinking water for all”.
Drinking water is considered safely managed when its source is located on the premises, available when needed, and free from faecal and prior chemical contamination. Waterborne pathogens due to inadequate sewage treatment or agricultural facilities contaminate drinking water in the form of disease-causing bacteria and viruses (United Nations Children’s Fund [UNICEF] and WHO 2021).
The proportion of the world population using safely managed drinking water increased steadily from 62 per cent in 2000 to 74 per cent in 2020. This progress is partly due to the Millennium Development Goals, which have advocated for safely managed drinking water services since 2000. In North America and Europe there were slight increases in the share of the population using safely manged drinking water services. These regions show the highest proportions for this indicator. National data for Africa, West Asia, and Asia and the Pacific are insufficient to generate regional aggregates; hence these regions are not included in the analysis.
Water-related diseases such as diarrhoea, cholera, dysentery and protozoan diseases are common where drinking water is contaminated. These diseases can be prevented through adequate sanitation, safe drinking water and good hygiene (UNEP and IWMI 2020). Safely managed drinking water is indispensable for reducing inequalities and ensuring universal access to all basic services (Bain et al. 2018).
See detailed information▼ or Search the most up to date data
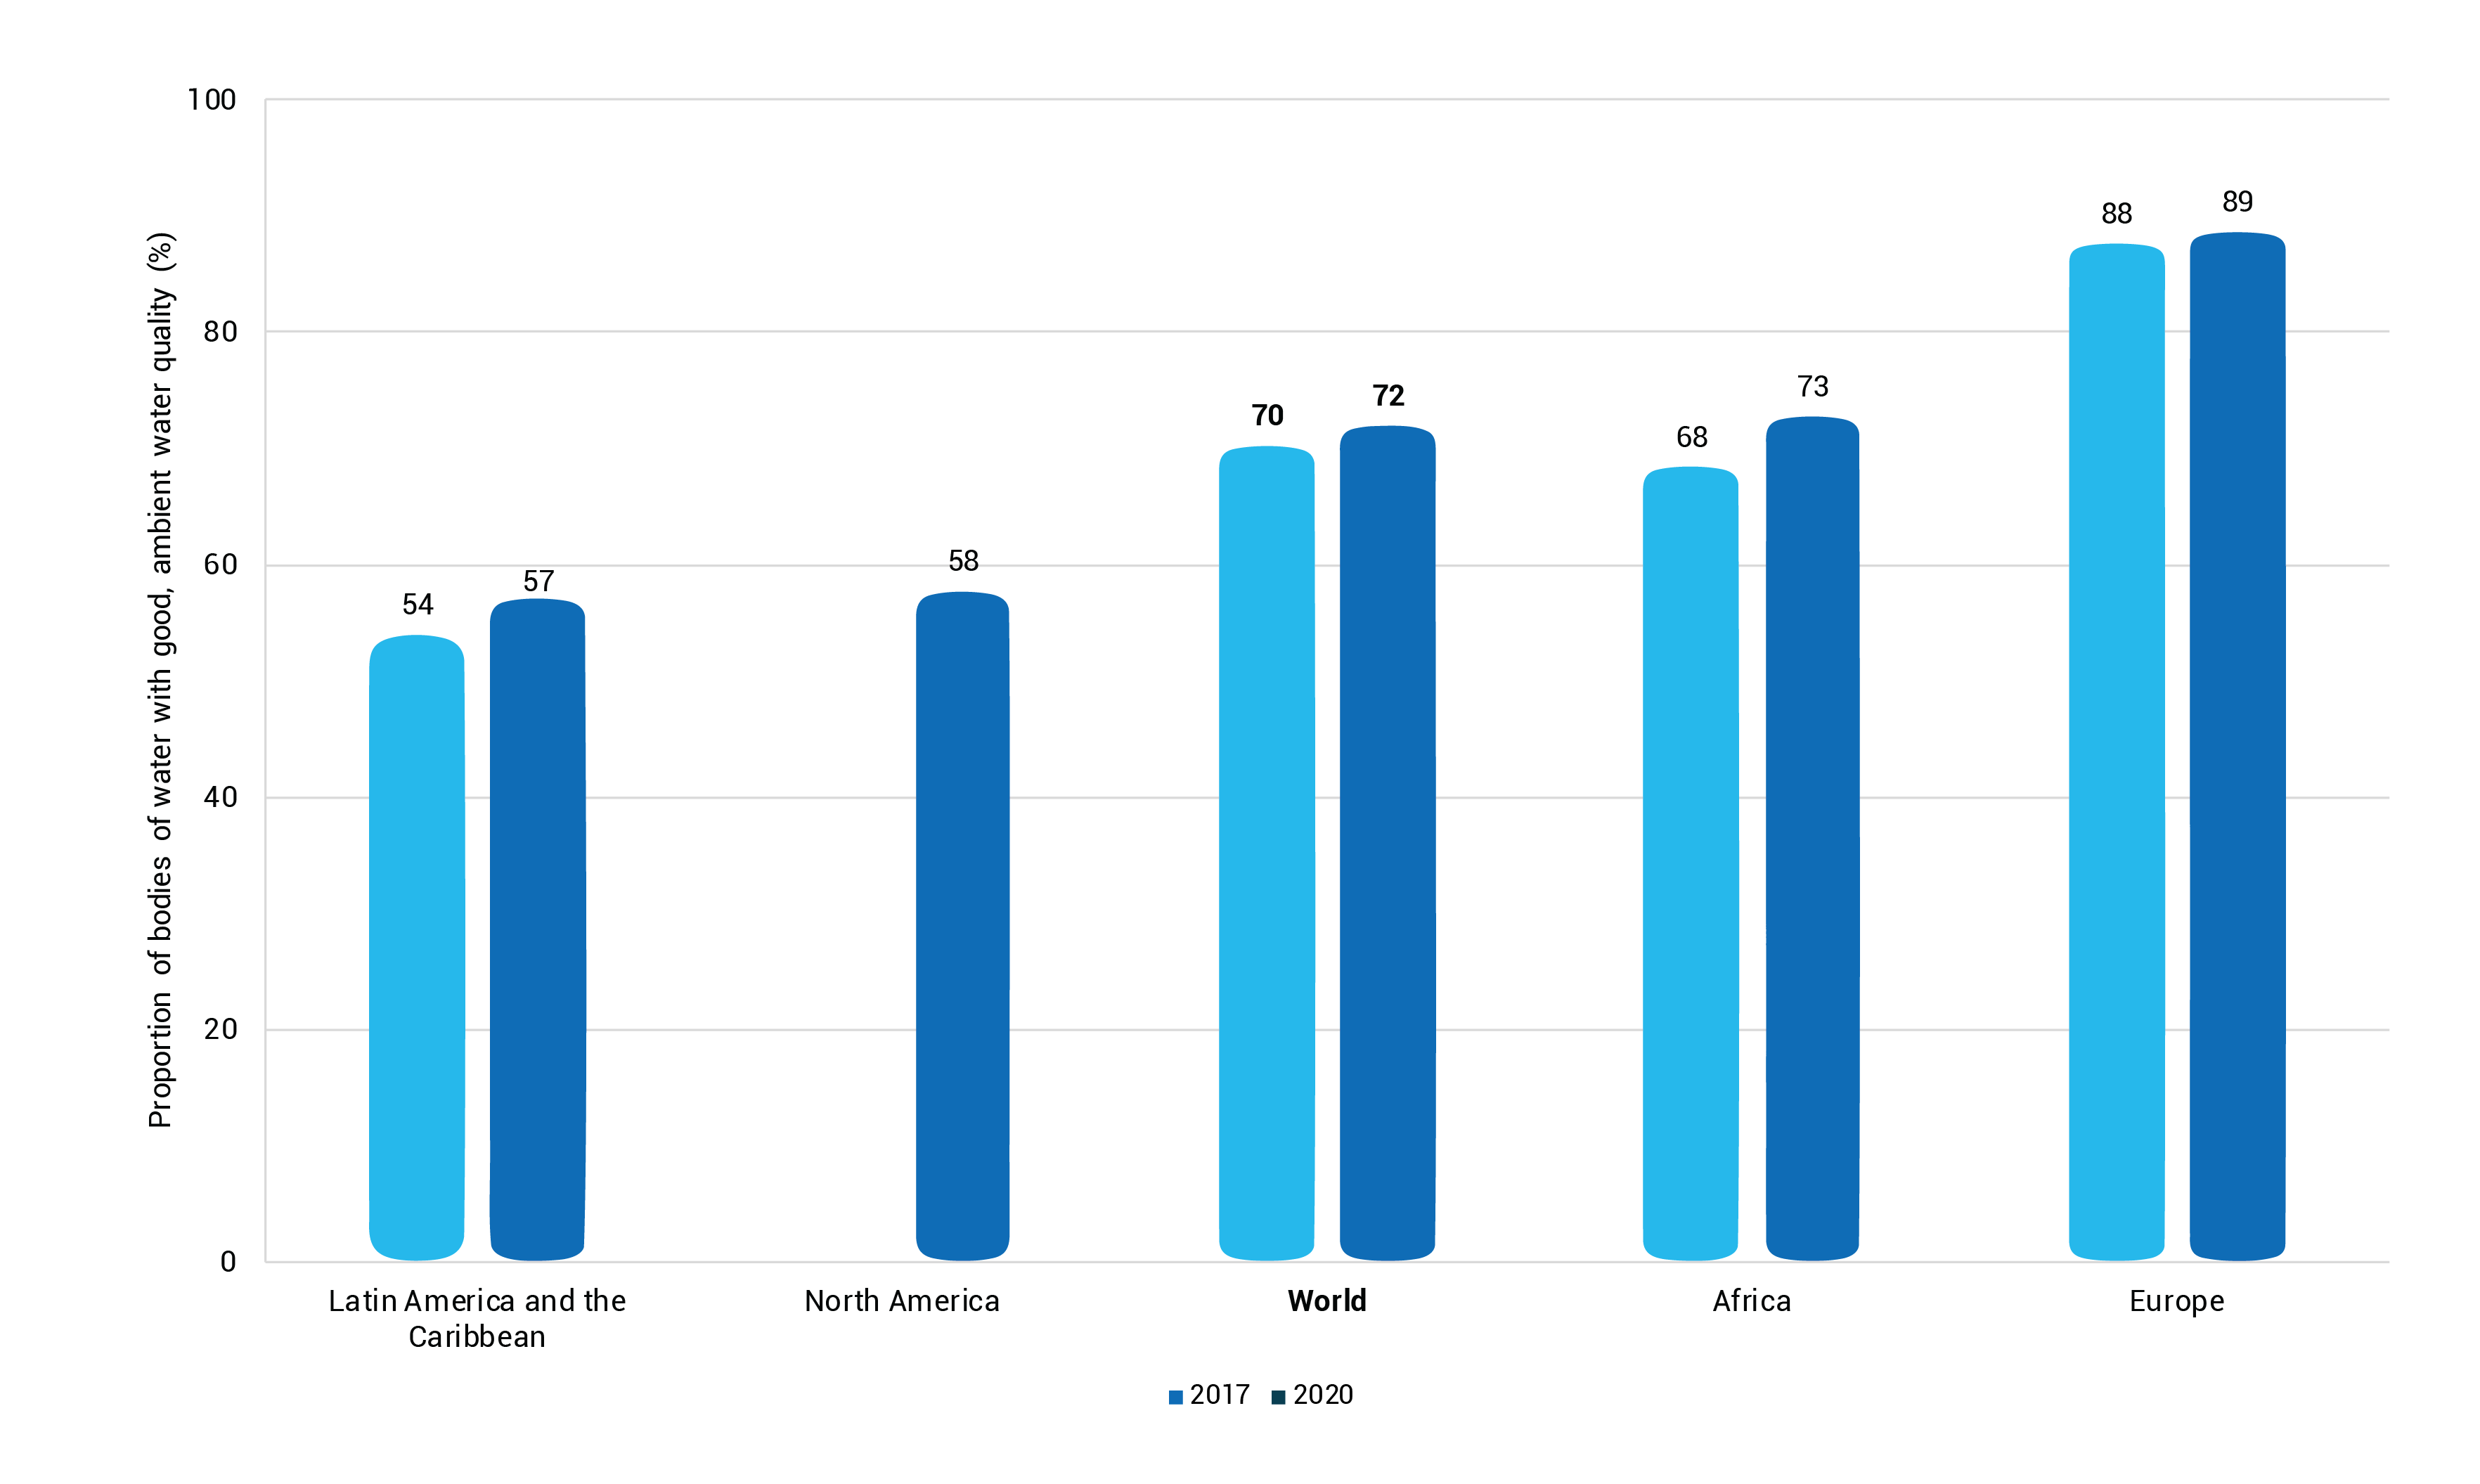
Indicator 6.3.2 is under SDG 6: “Ensure availability and sustainable management of water and sanitation for all”, Target 6.3: “By 2030, improve water quality by reducing pollution, eliminating dumping and minimizing release of hazardous chemicals and materials, halving the proportion of untreated wastewater and substantially increasing recycling and safe reuse globally”.
At the global level there was a slight increase in the proportion of bodies of water with good ambient water quality between 2017 and 2020, from 70 to 72 per cent. Europe had the highest proportion (88 and 89 per cent). The lowest was in Latin America and the Caribbean (54 and 57 per cent). There was a considerable increase in Africa (68 to 75 per cent). No data were reported for North America in 2017, but 58 per cent of the waterbodies in that region reportedly had good ambient water quality in 2018. In 2016 severe organic pollution, including material depleting the concentration of oxygen, was reported to affect around one-seventh of all river stretches in Latin America, Africa and Asia (UNEP 2016).
Good quality ambient surface water and groundwater are critical for sustainable development and human and ecosystem health. To understand where water quality is under pressure, good quality monitoring data are essential. These data help policy makers determine where to direct resources to reduce pollution. Owing to the significant human and financial resources required, however, reliable freshwater quality data are scarce (UNEP 2018) and data for SDG indicator 6.3.2 are limited at the country level for both 2017 and 2020.
See detailed information▼ or Search the most up to date data
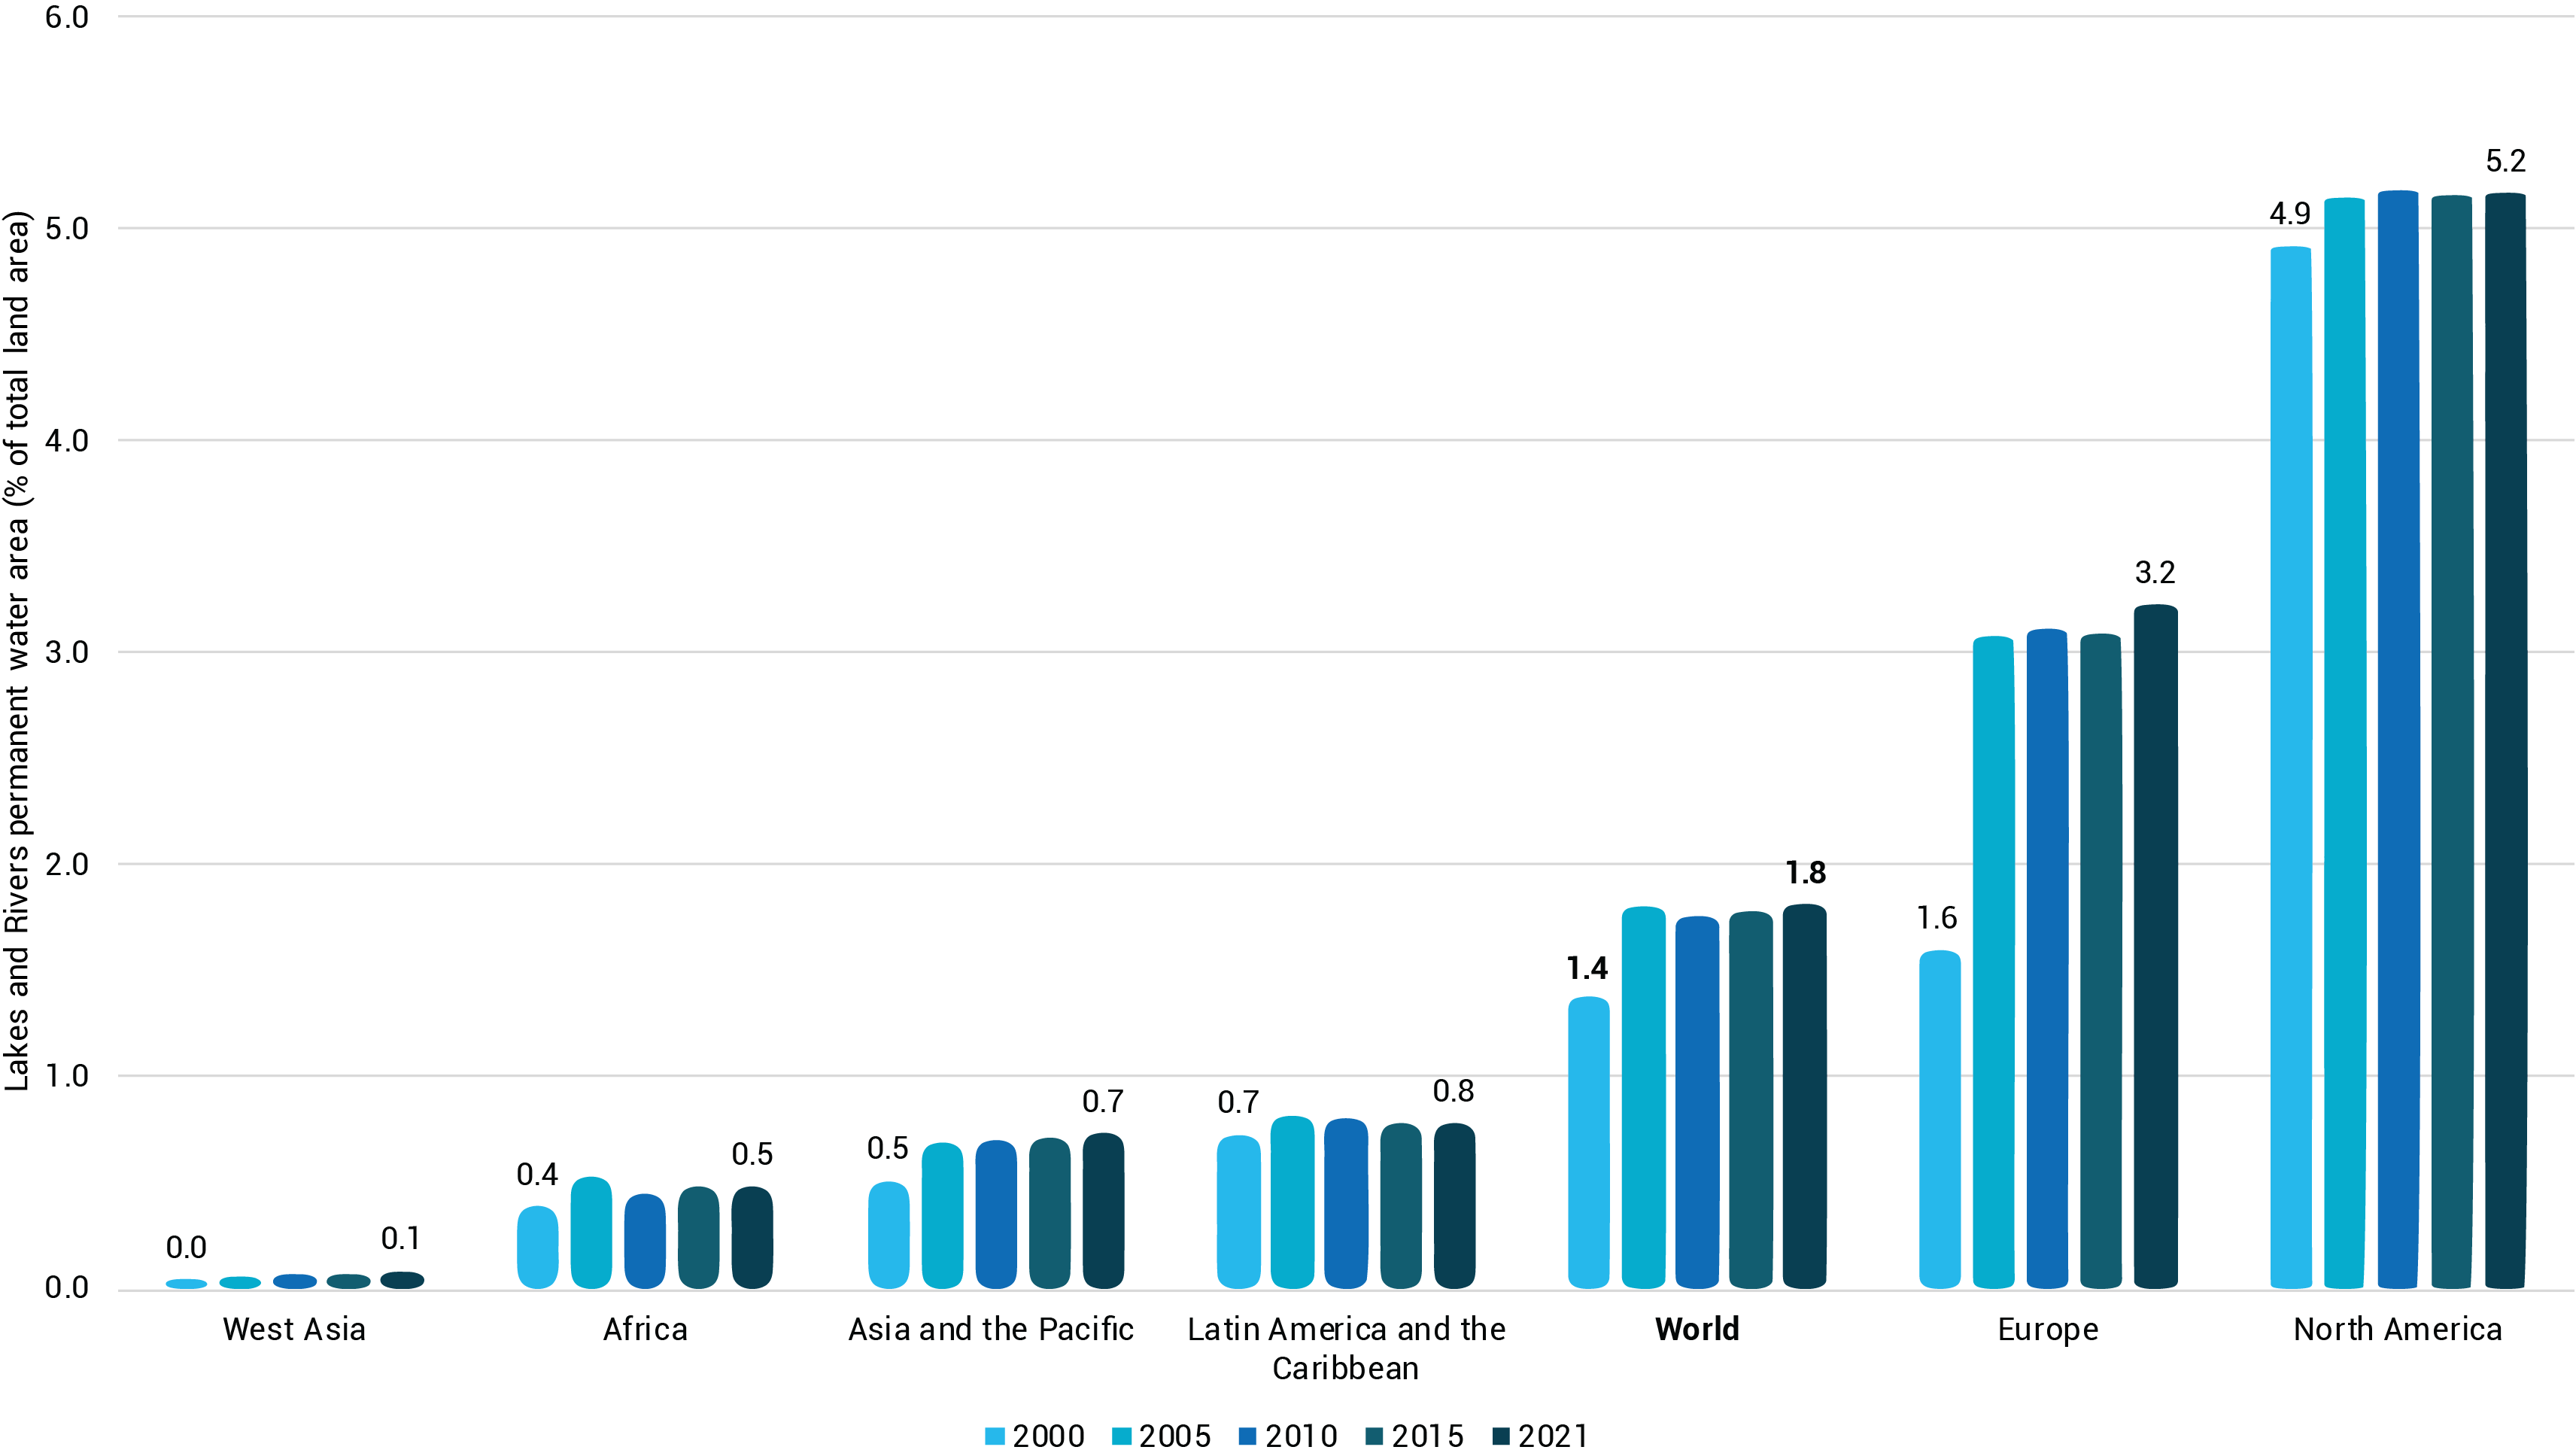
Indicator 6.6.1 is under SDG 6: “Ensure availability and sustainable management of water and sanitation for all”, Target 6: “By 2020, protect and restore water-related ecosystems, including mountains, forests, wetlands, rivers, aquifers and lakes”. The indicator provides information on lakes and rivers, mangroves, wetlands and groundwater in their permanent and seasonal states. The turbidity and trophic state of lake water quality are also measured.
Globally in 2021, 1.8 per cent of land was covered by lakes or rivers compared with 1.4 per cent in 2000. The spatial extent of freshwater bodies increased in all regions during the previous two decades, a result of new reservoirs and dams as well as of climate change (flooding) (UNESCO and UN-Water 2020). The largest increase was in Europe (1.8 per cent in 2021 compared with 1.4 per cent in 2000). Overall, the highest freshwater to land ratio was in North America (5.2 per cent in 2021 compared with 4.9 in 2000); the lowest was in West Asia (0.1 per cent in 2021 compared with 0.0 per cent in 2000).
Water is both a recipient and carrier of pollution. Freshwater ecosystems are increasingly at risk of disturbance, degradation and loss, mainly owing to human activities, climate change and extreme weather events, all of which are linked to pollution (including severe pathogen pollution) (United Nations Environment Assembly 2017). Pollution adversely impacts water quality and limits the amount of clean freshwater available for human needs, further incentivizing the withdrawal of already depleted water resources (UNEP 2021).
See detailed information▼ or Search the most up to date data
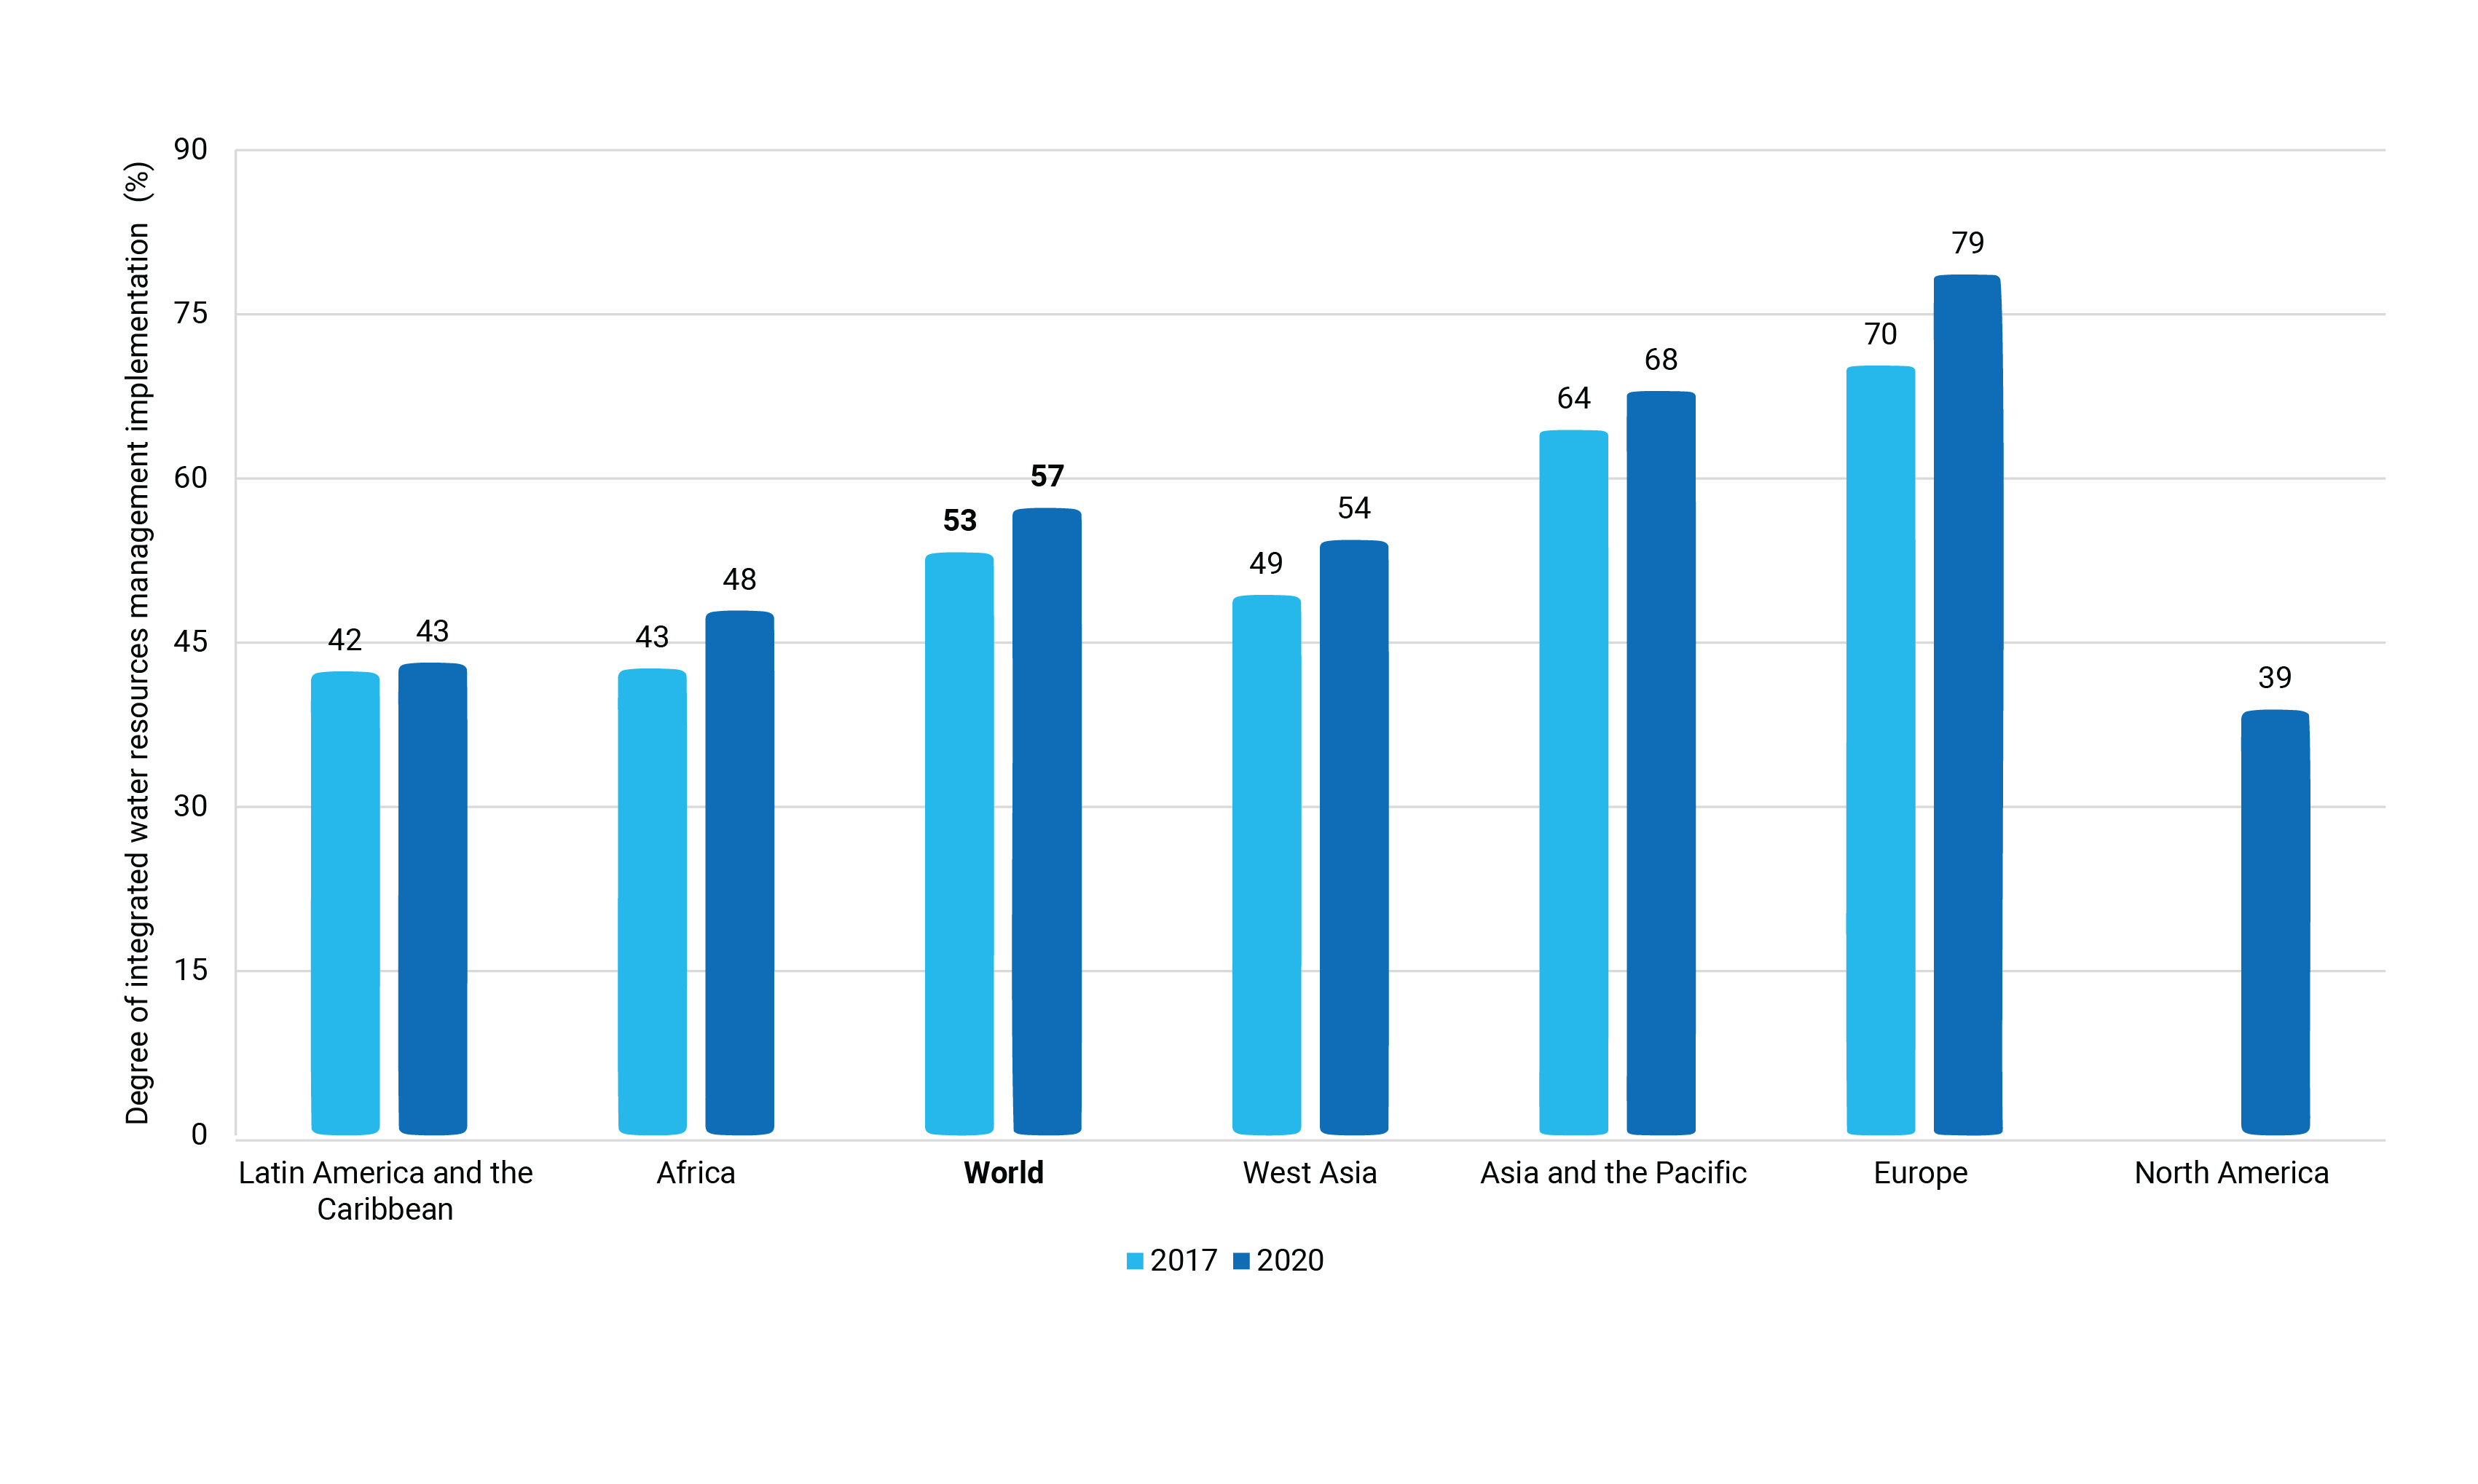
Indicator 6.5.1 is under SDG 6, “Ensure availability and sustainable management of water and sanitation for all”, Target 6.5: “By 2030, implement integrated water resources management at all levels, including through transboundary cooperation as appropriate”.
In 2020 the degree of integrated water resources management (IWRM) implementation globally was 57 per cent, compared with 53 per cent in 2017. The highest degree of implementation was in Europe (79 per cent and 70 per cent). Implementation rates in Latin America and the Caribbean, Africa, West Asia, and Asia and the Pacific were 42 and 43, 43 and 48, 49 and 54, and 64 and 68 per cent, respectively. The lowest reported implantation rate was in North America (39 per cent in 2020).
Freshwater ecosystems are vulnerable. The implementation of water resources management faces increasingly complex problems related to inadequate infrastructure, transboundary competition, withdrawal or deviation of river flows, pollution by industry and agriculture, nutrient loading, salination, excessive fishing, and invasive species (Ingold and Tosun 2020). The inability of water resource systems to meet diverse water needs is related to deficiencies in planning, management and decision-making (Loucks and van Beek 2017).
Integrated water resource management can be defined as “a process which promotes the coordinated development and management of water, land and related resources, to maximise economic and social welfare in an equitable manner, without compromising the sustainability of vital ecosystems” (Global Water Partnership 2000). IWRM attempts to solve intricate water-related problems through policies, management and financing instruments to control pollution and protect freshwater ecosystems using effective policy actions (Hernández-Bedolla et al. 2019).
See detailed information▼ or Search the most up to date data
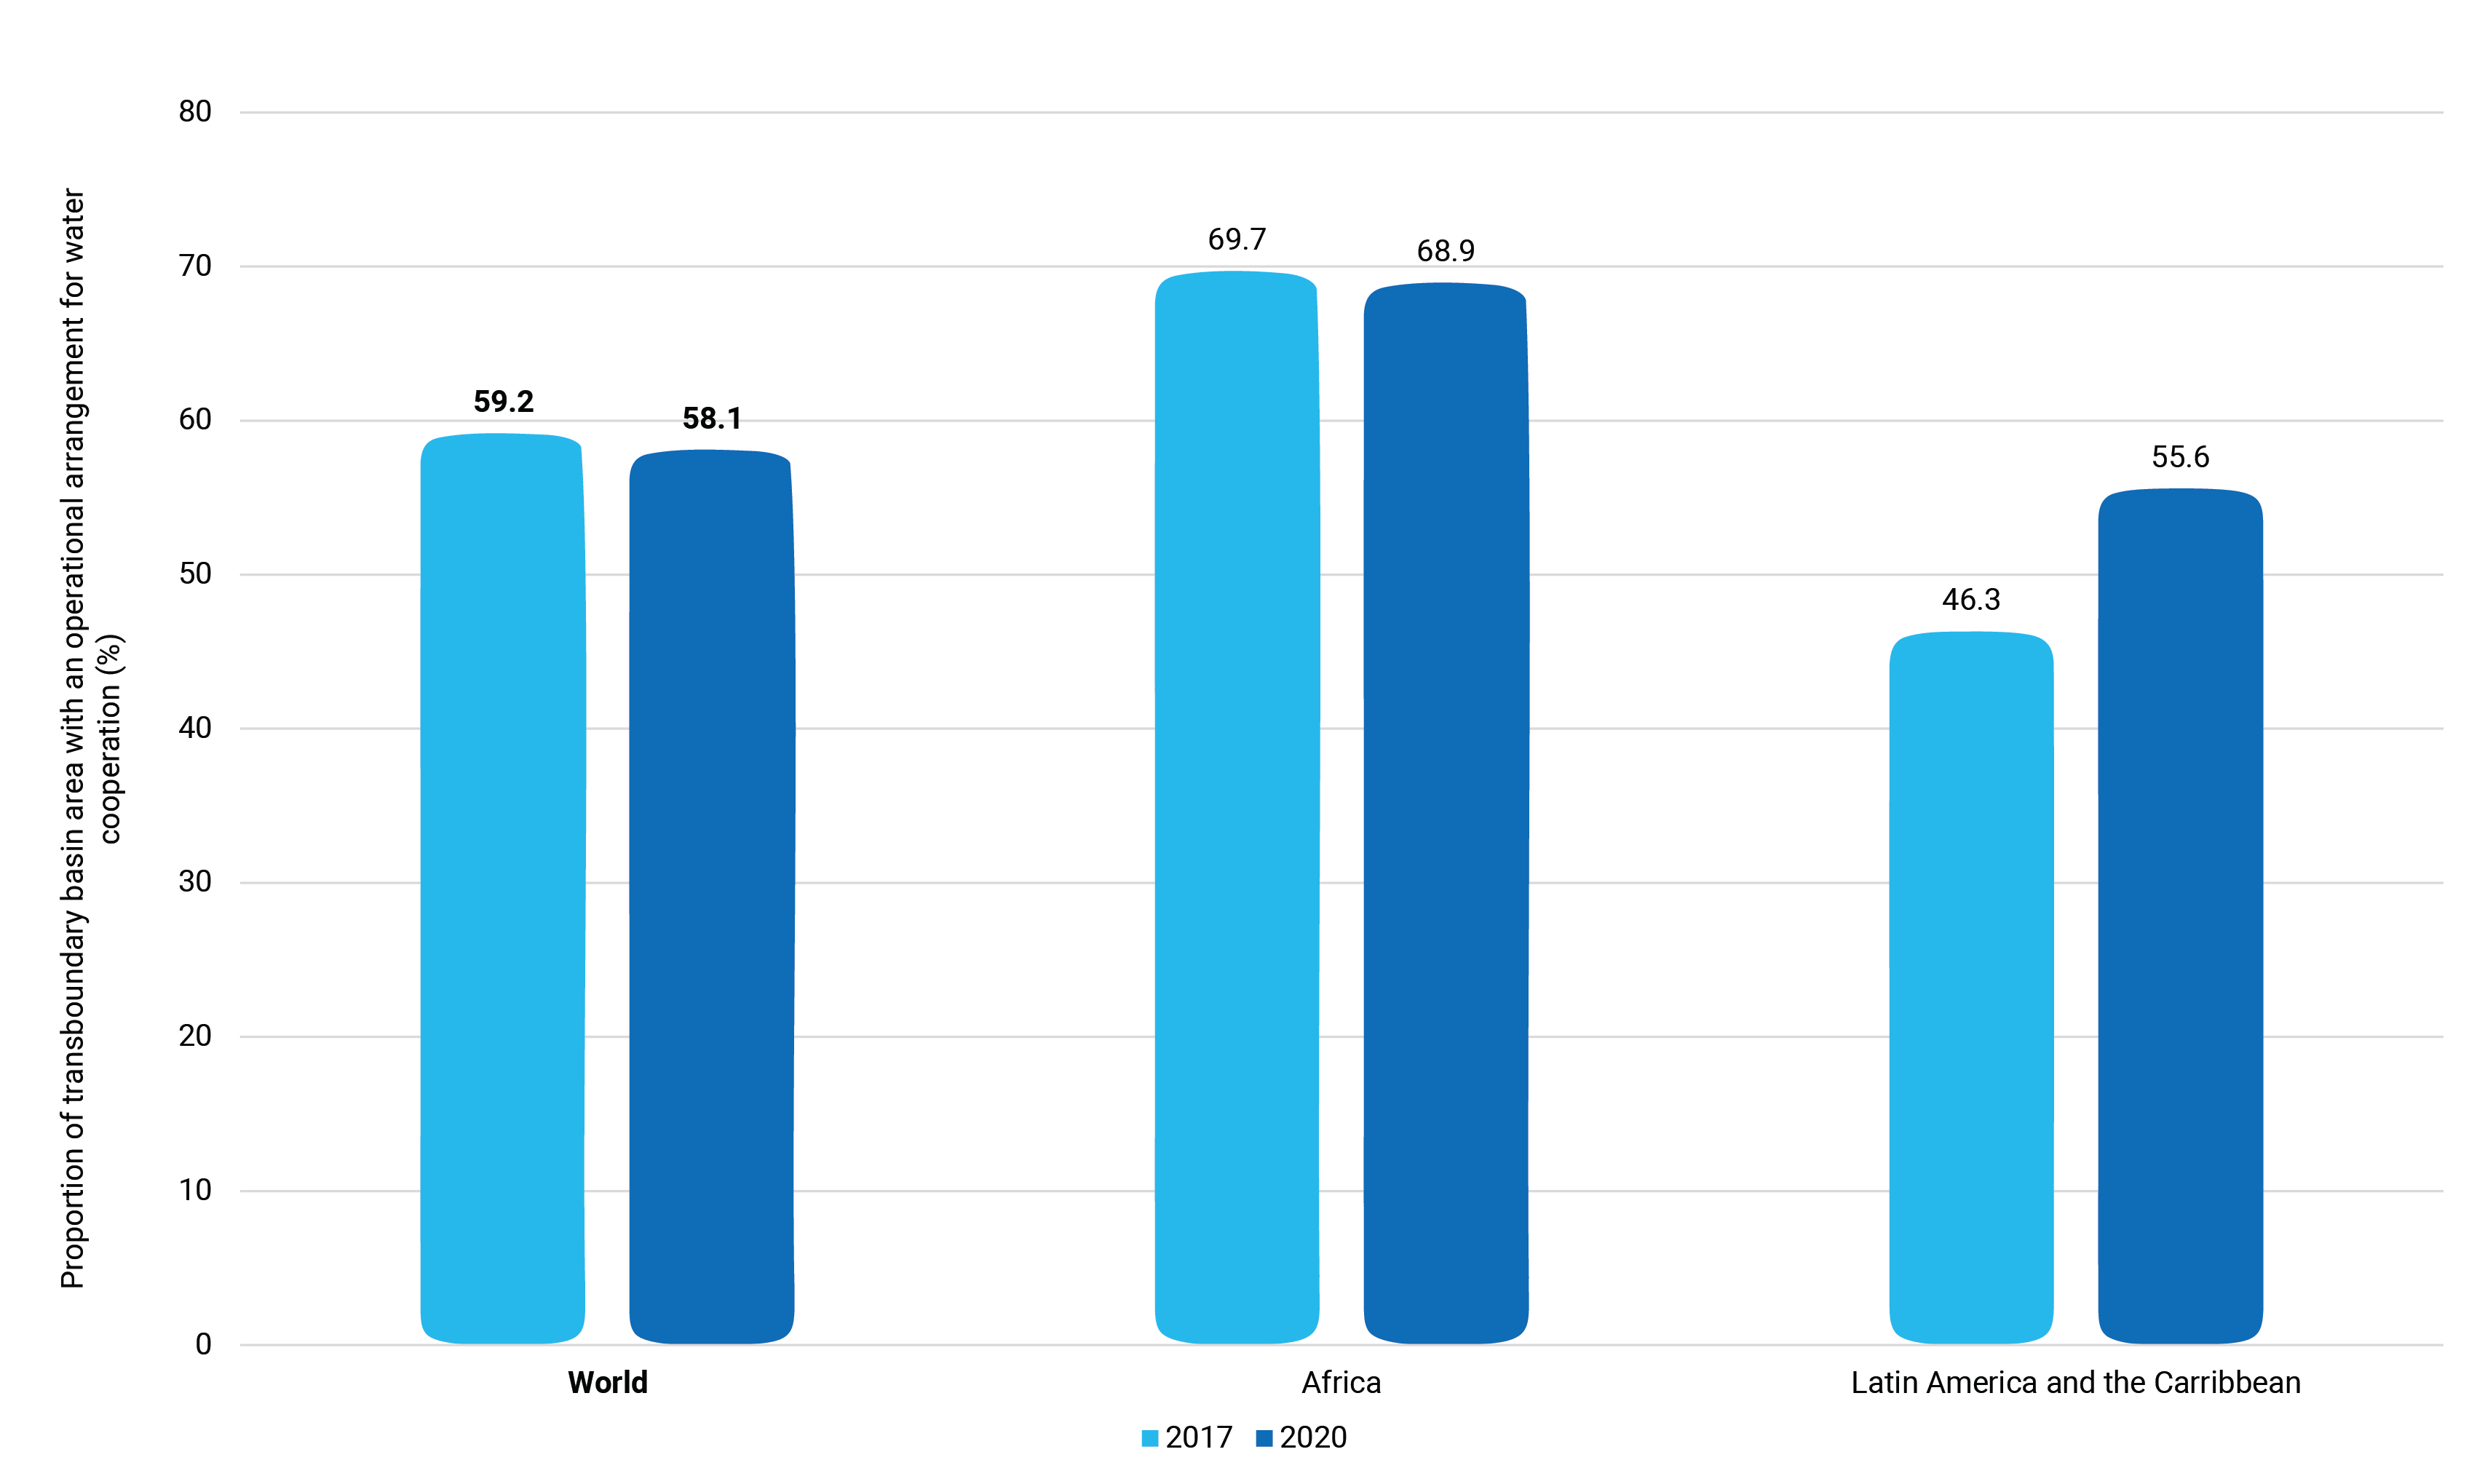
Indicator 6.5.2 is under SDG 6: “Ensure availability and sustainable management of water and sanitation for all”, Target 6.5: “By 2030, implement integrated water resources management at all levels, including through transboundary cooperation as appropriate”.
Globally, the proportion of transboundary basin area with an operational arrangement for water cooperation in 2017 and 2020 was around 60 per cent. This proportion decreased slightly in Africa, which nevertheless exceeded the global proportion by around 10 per cent. In Latin America and the Caribbean the proportion improved significantly between 2017 and 2020, by almost 10 per cent. Insufficient data were available for other regions.
This indicator covers 592 transboundary aquifers with transboundary lakes and river basins, covering nearly half the Earth´s land surface. Most of the world’s water resources are shared. In addition, about 40 per cent of the world population lives in river and lake basins shared by two or more countries (UNEP 2016).
Indicator 6.5.2 promotes cooperation among countries to “implement integrated water resources management at all levels, including through transboundary cooperation as appropriate”, as stated in SDG Target 6.5. Operational arrangements for water cooperation are in place in 58 per cent of transboundary basin areas (UN-Water 2021). Transboundary cooperation among riparian countries is a key to easing pressures on freshwater aquatic ecosystems caused by withdrawal and contamination. Monitoring transboundary cooperation provides valuable information which countries can use to assess the status of their cooperation and set targets for improved coordination.
See detailed information▼ or Search the most up to date data
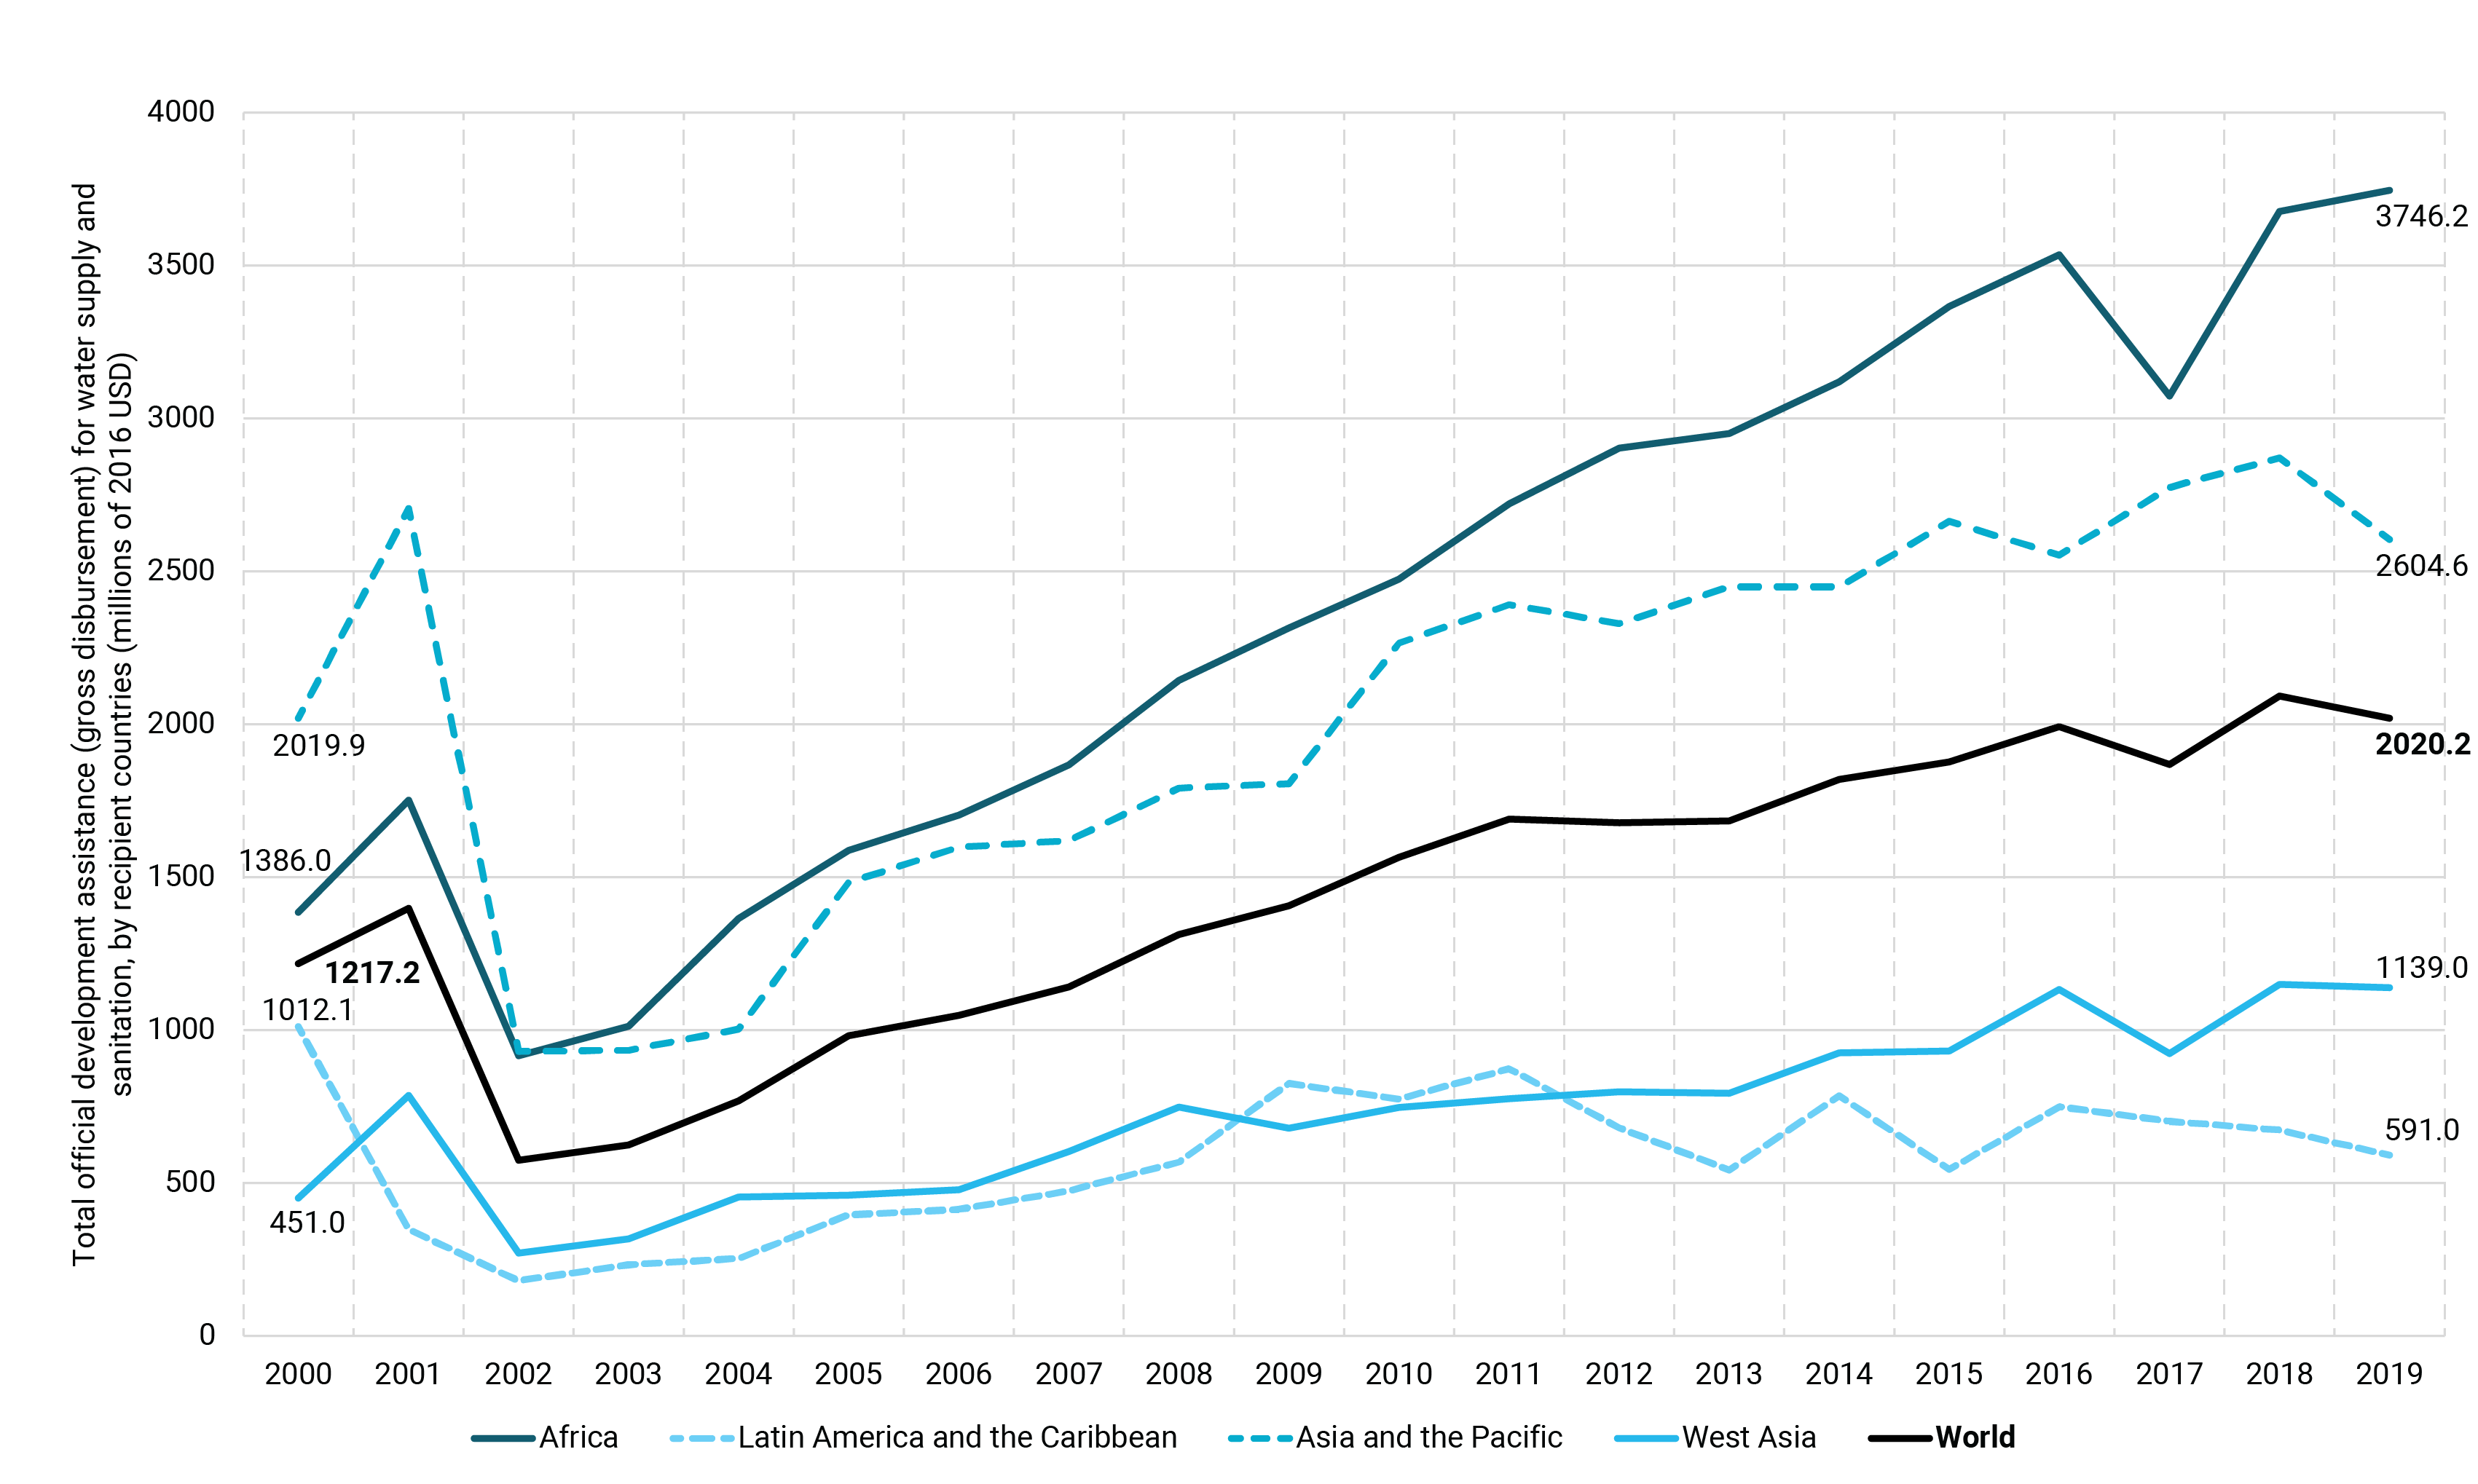
Indicator 6.a.1 is under SDG 6: “Ensure availability and sustainable management of water and sanitation for all”, Target 6.a: “By 2030, expand international cooperation and capacity-building support to developing countries in water- and sanitation-related activities and programmes, including water harvesting, desalination, water efficiency, wastewater treatment, recycling and reuse technologies.”
Total water- and sanitation-related development assistance (ODA) increased from US$ 1.4 billion to US$ 3.8 billion in Africa, and from US$ 2.0 billion to US$ 2.7 billion in Asia and the Pacific. In Latin America and the Caribbean and West Asia, ODA flows were smaller and remained relatively stable.
Infrastructure for water and sanitation is financed by users through tariffs or charges, by taxpayers through local and national taxes, or by aid donors (Hahm 2019). Governments of low- and middle-income countries rely on complementing their own resources with ODA. Water- and sanitation-related ODA includes assistance for drinking water supply, sanitation, wastewater treatment, water resources conservation, development and management, agricultural water resources, flood protection, and hydroelectric power (WHO 2019). ODA assists in reducing negative human health impacts from exposure to modern pollutants and toxicity (Swinehart et al. 2019), strengthens government systems in recipient countries (Bartram et al. 2018), and supports water resource conservation, river basin development, and waste management and disposal (WHO 2019).
See detailed information▼ or Search the most up to date data
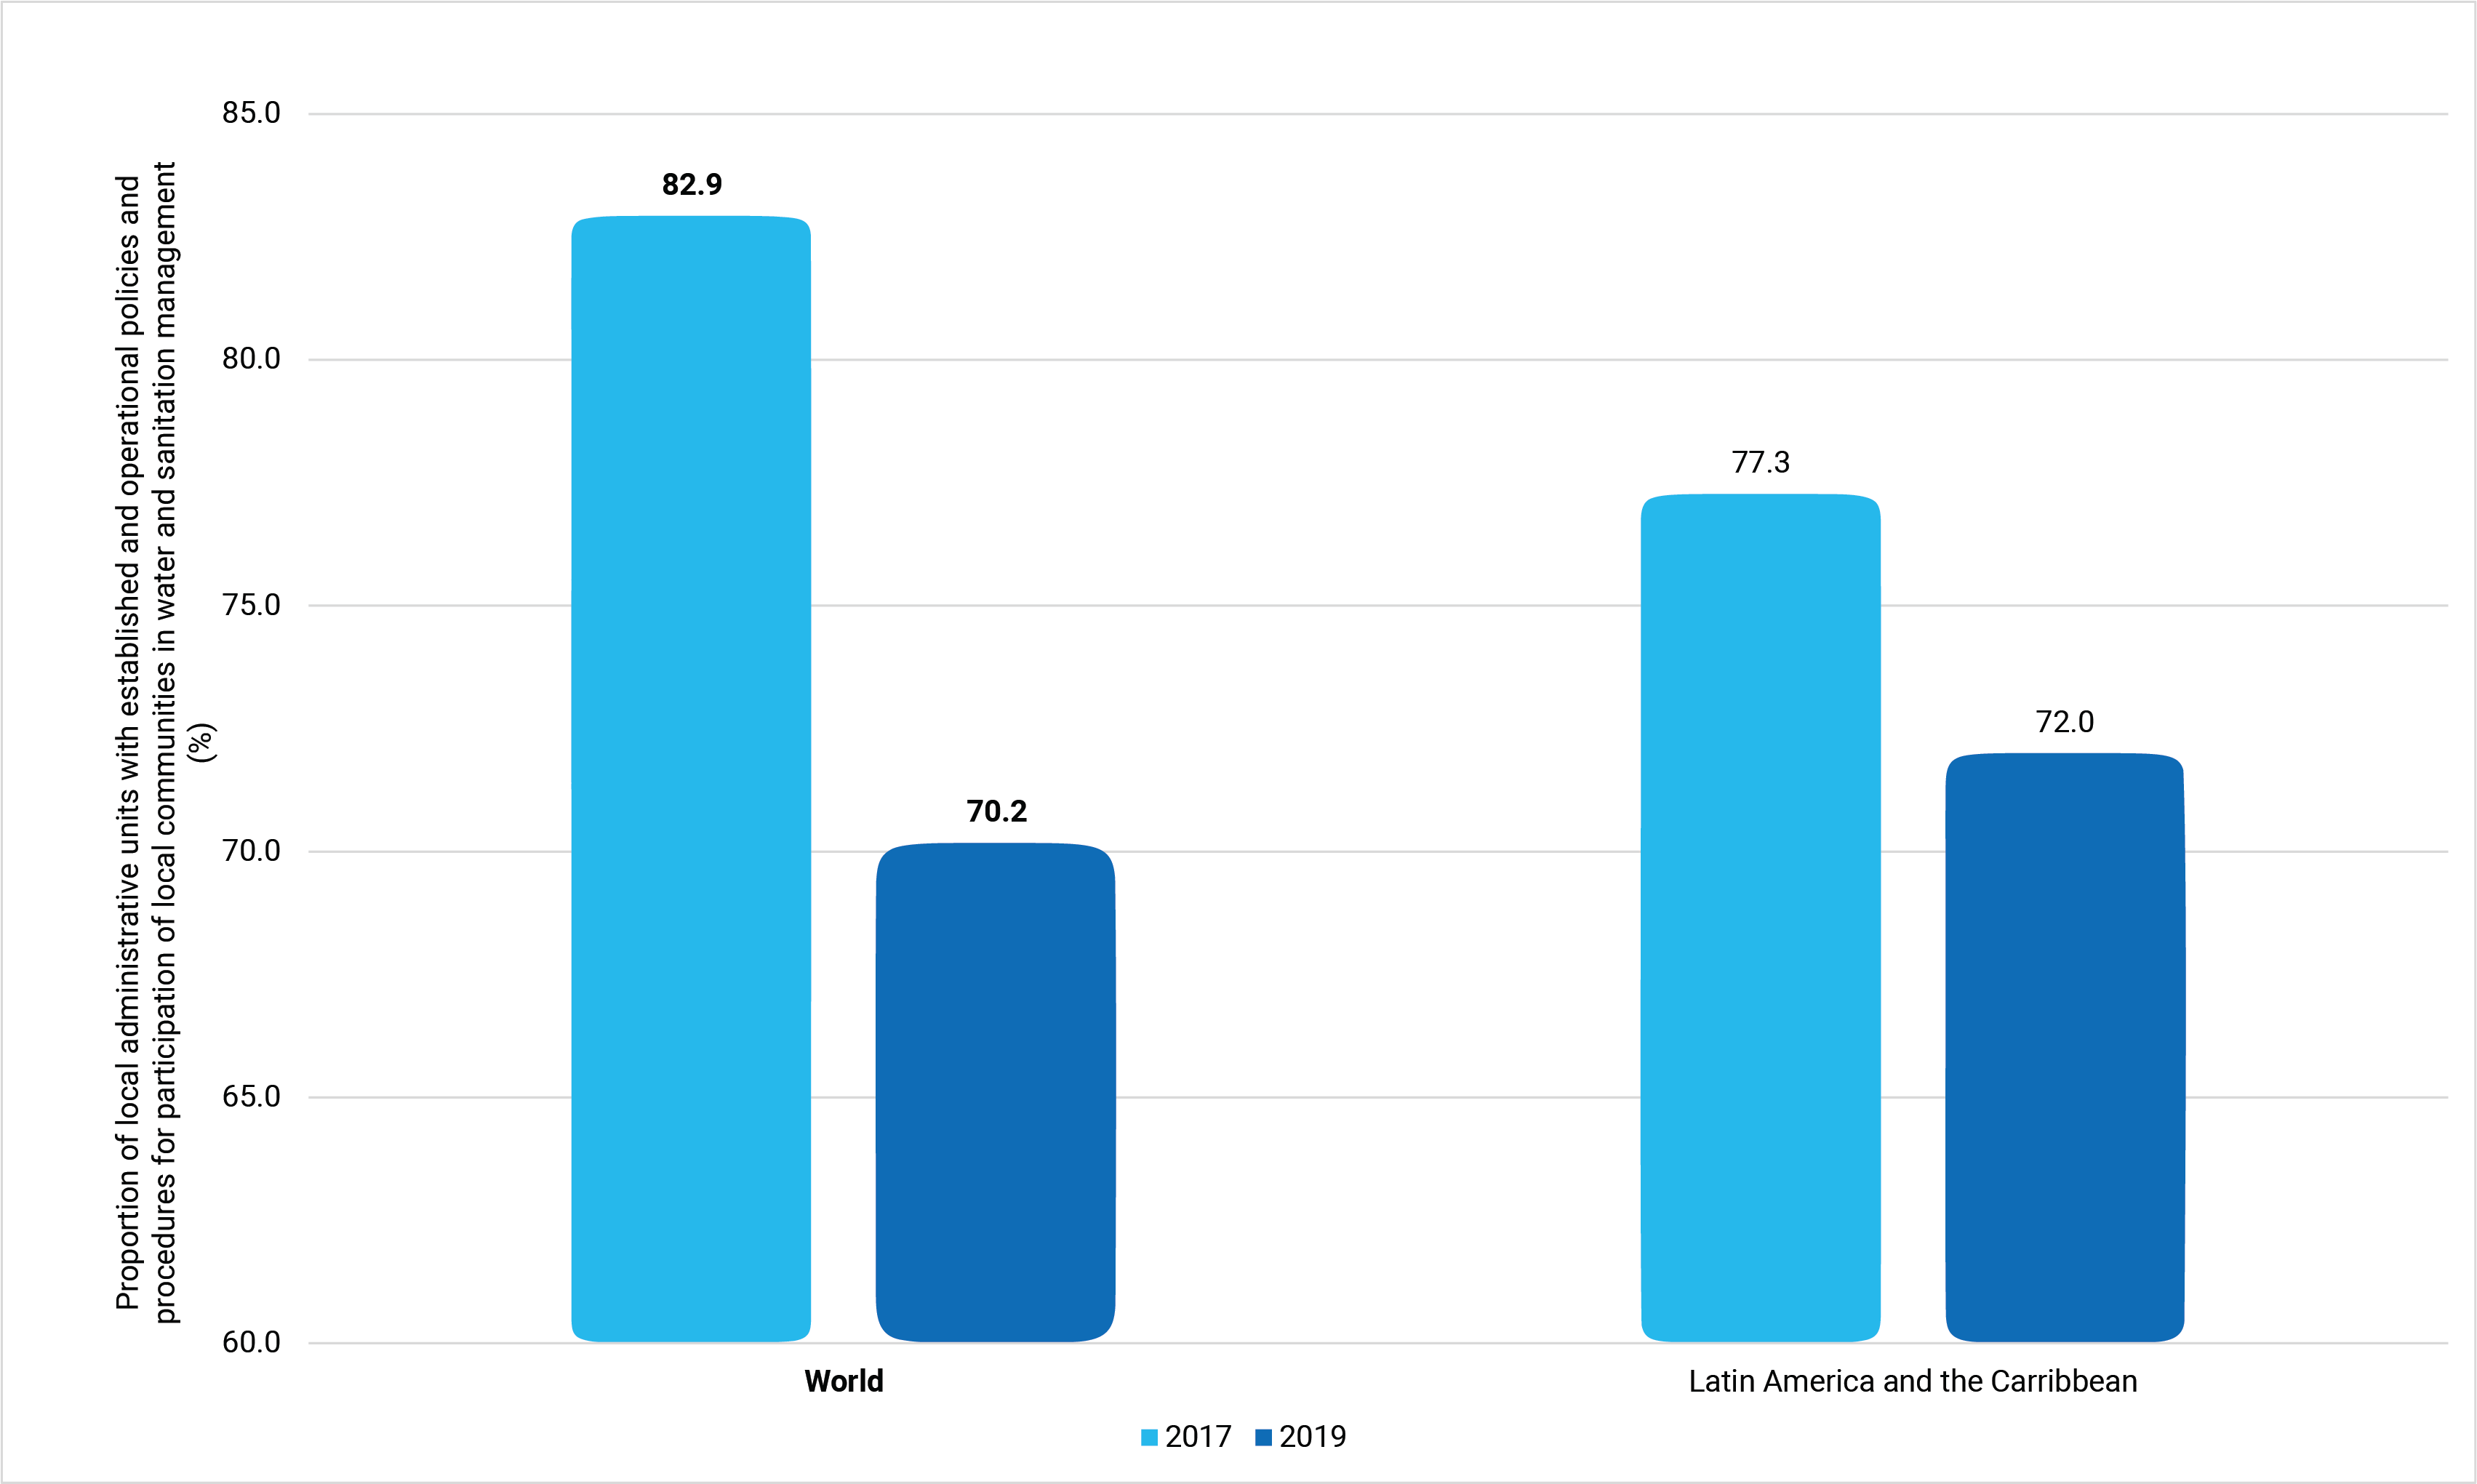
Indicator 6.b.1 is under SDG 6: “Ensure availability and sustainable management of water and sanitation for all”, Target 6.b: “Target 6.b: Support and strengthen the participation of local communities in improving water and sanitation management”.
Data for this indicator are scarce. They are not available for most countries, and consequently for most regions. However, global aggregations for 2017 and 2019 are available. The proportion of local administrative units with established and operational policies and procedures for participation of local communities in water and sanitation management decreased from 83 per cent in 2017 to 70 per cent in 2019.
Participation by stakeholders and local communities in decision-making on water and sanitation issues is vital to ensure that communities’ needs are met and to provide appropriate solutions from residents. A participatory approach encourages local communities to create effective management strategies for access to improved water sources, better quality, permanent supply, and adequate infrastructure. It aims to define and explain the priorities at stake while creating a well-informed, long-lasting water management plan to respond to a complex socioeconomic, environmental and political problem (Morrison 2003; Bisung and Dickin 2019; Hove et al. 2021).
See detailed information▼ or Search the most up to date data
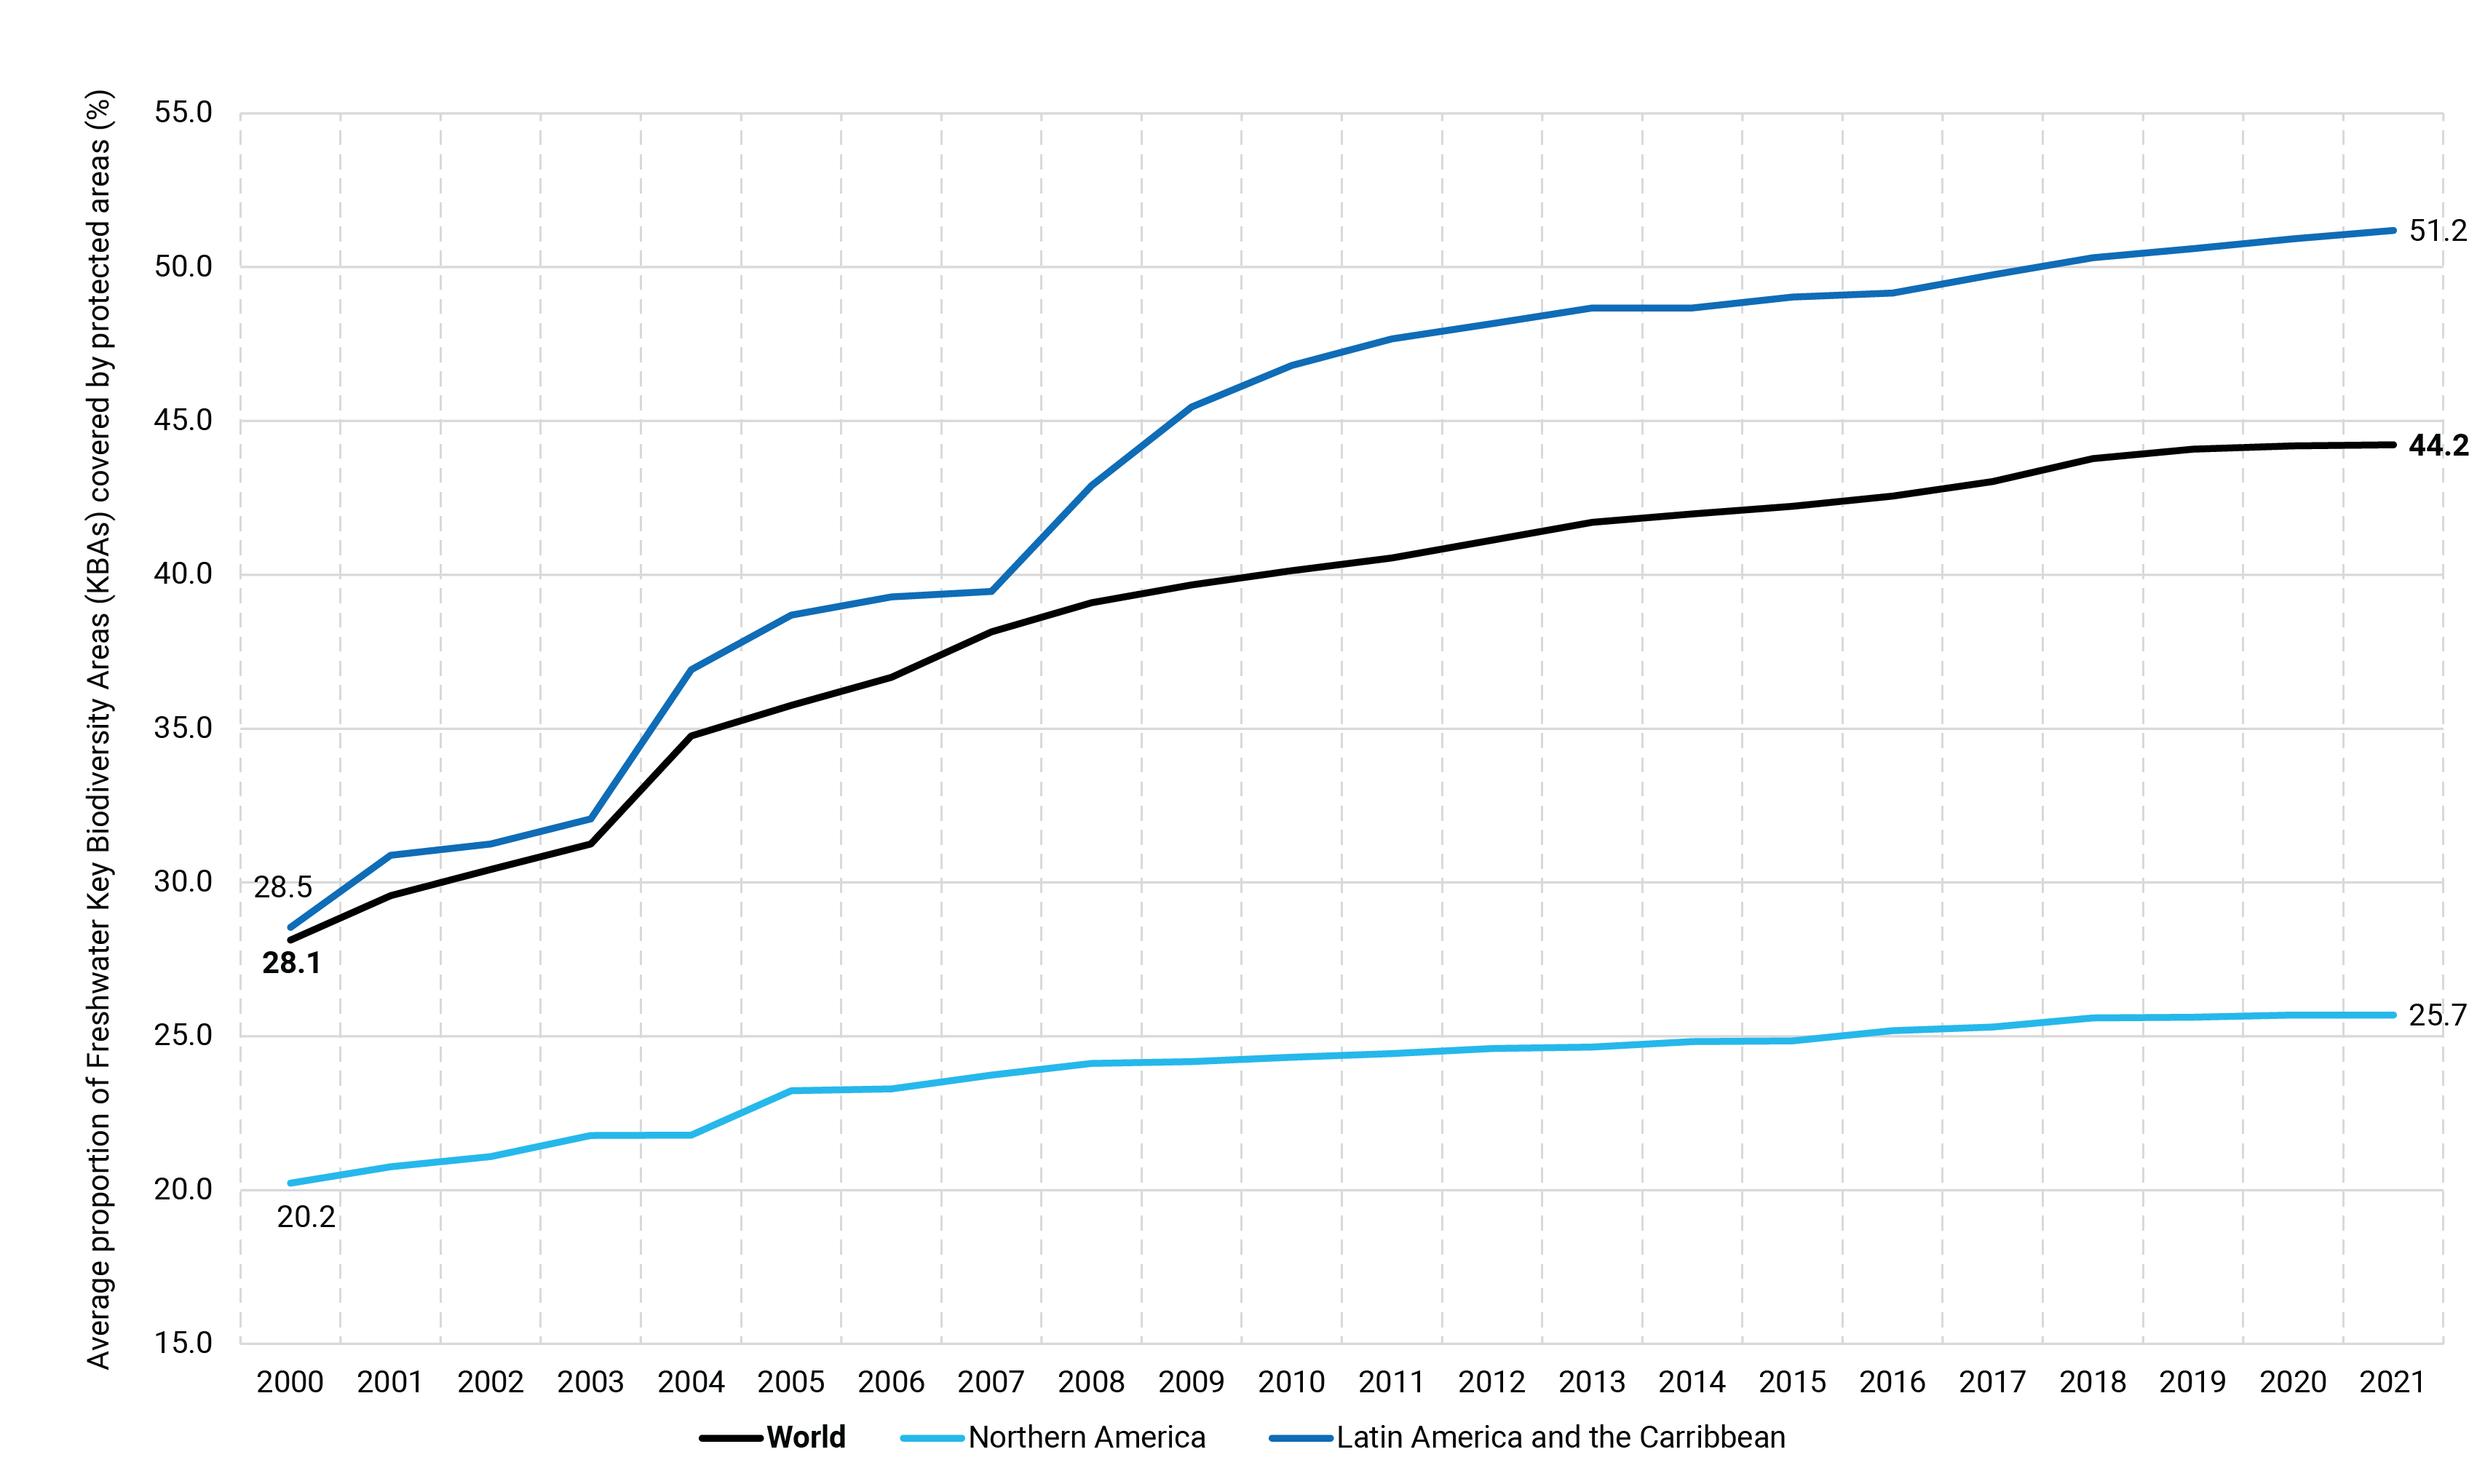
Indicator 15.1.2 is under SDG 15: Protect, restore and promote sustainable use of terrestrial ecosystems, sustainably manage forests, combat desertification, and halt and reverse land degradation and halt biodiversity loss”, Target 15.1: “By 2020, ensure the conservation, restoration and sustainable use of terrestrial and inland freshwater ecosystems and their services, in particular forests, wetlands, mountains and drylands, in line with obligations under international agreements”.
The proportion of important sites for freshwater biodiversity increased significantly during the last two decades, although progress has slowed in recent years. In 2021 this proportion was 44.2 per cent, compared with 28.1 per cent in 2000. Similar trends can be observed in Latin America and the Caribbean, where more than 50 per cent of Key Biodiversity Areas (KBAs) are protected. These percentages indicate the importance of global efforts to safeguard vital aquatic ecosystems. In North America only 25 per cent of KBAs were covered as protected areas. Data for Africa, Asia and the Pacific, Europe and West Asia were not available for a time series analysis.
Safeguarding important sites for freshwater biodiversity is essential to ensure long-term, sustainable use of freshwater natural resources. This indicator shows temporal trends in the mean percentage of protected area for each important site. The establishment of such protected areas is an important mechanism to ease pressures of vulnerable freshwater ecosystems and their inherent biodiversity (Finlayson, Arthington and Pittock 2018). Despite the increasing rates of freshwater conservation status and effective management systems for aquatic ecosystems, global freshwater biodiversity continues to decline at an alarming rate (Hermoso et al. 2016; Secretariat of the Convention on Biological Diversity 2020; World Wildlife Fund 2021). Designating freshwater bodies as protected areas will help to alleviate human induced pressures such as pollution from further harming these vulnerable ecosystems (Acreman et al. 2020).
Important sites for freshwater biodiversity are defined by the International Union for Conservation of Nature (IUCN) as those which contribute significantly to the global persistence of biodiversity (identification of Important Bird and Biodiversity Areas, and identification of Alliance for Zero Extinction sites, i.e. those sites holding effectively the entire population of at least one species assessed as Critically Endangered or Endangered on the IUCN Red List of Threatened Species) (IUCN 2016, 2022). Protected areas, as defined by the IUCN, are clearly defined geographical spaces that are recognized, dedicated and managed, through legal or other effective means, in order to achieve the long-term conservation of nature with associated ecosystem services and cultural values (United Nations Statistics Division 2022).
DPSIR Indicator Framework: Marine and Coastal Pollution
See the data below
See detailed information▼ or Search the most up to date data
Indicator 6.3.1 is under SDG Goal 6: “Ensure availability and sustainable management of water and sanitation for all”, Target 6.3: “By 2030, improve water quality by reducing pollution, eliminating dumping and minimizing release of hazardous chemicals and materials, halving the proportion of untreated wastewater and substantially increasing recycling and safe reuse globally”.
A trend analysis for this indicator could not be carried out owing to lack of regional and global data.
Wastewater discharges can adversely affect not only freshwater ecosystems (see the section on freshwater pollution in Part 2), but also marine and coastal ones. Inadequate wastewater treatment increases the risk of human exposure to infectious disease. It can also result in releases of pollutants that degrade the environment, with adverse effects on marine life and the aquatic food chain (Bonin-Font et al. 2018).
The rapidly increasing volumes of plastic waste in the environment have raised concerns about potential harm to aquatic ecosystems. Entry routes are mainly land-based, including discharges from coastal landfills and wastewater treatment plants (WWTPs), which are considered an important microplastics pathway into the environment (Talvitie et al. 2015; Talvitie et al. 2017; Kazour et al. 2019; Sun et al. 2019). Technologies for treating wastewater polluted with “emerging pollutants” or “emerging contaminants”, including pharmaceuticals and personal care products (PPCPs), exist and are being developed (Oluwole, Omotola and Olatunji 2020; Frascaroli et al. 2021; Angeles et al. 2022; Frontiers in Environmental Chemistry 2022; Nataraj 2022).
PPCPs contain substances that have been widely detected in both freshwater and marine ecosystems (Arpin-Pont et al. 2016; UNEP 2017a; OECD 2019a). These substances are released to the environment by marine outfalls, river and stream run-off, aquaculture, agriculture, and recreational activities (e.g. sunscreen use: Morro Bay 2019; Environmental Working Group 2022). They are found in treated and untreated wastewater. Land application of biosolids and reclamation of treated wastewater can transfer these substances to terrestrial and aquatic environments, giving rise to potential accumulation in plants (Al-Farsi et al. 2017; Fu et al. 2019). Biologically active and persistent contaminants such as those found in PPCPs can have negative impacts on all living organisms (Montesdeoca-Esponda et al. 2018).
See detailed information▼ or Search the most up to date data
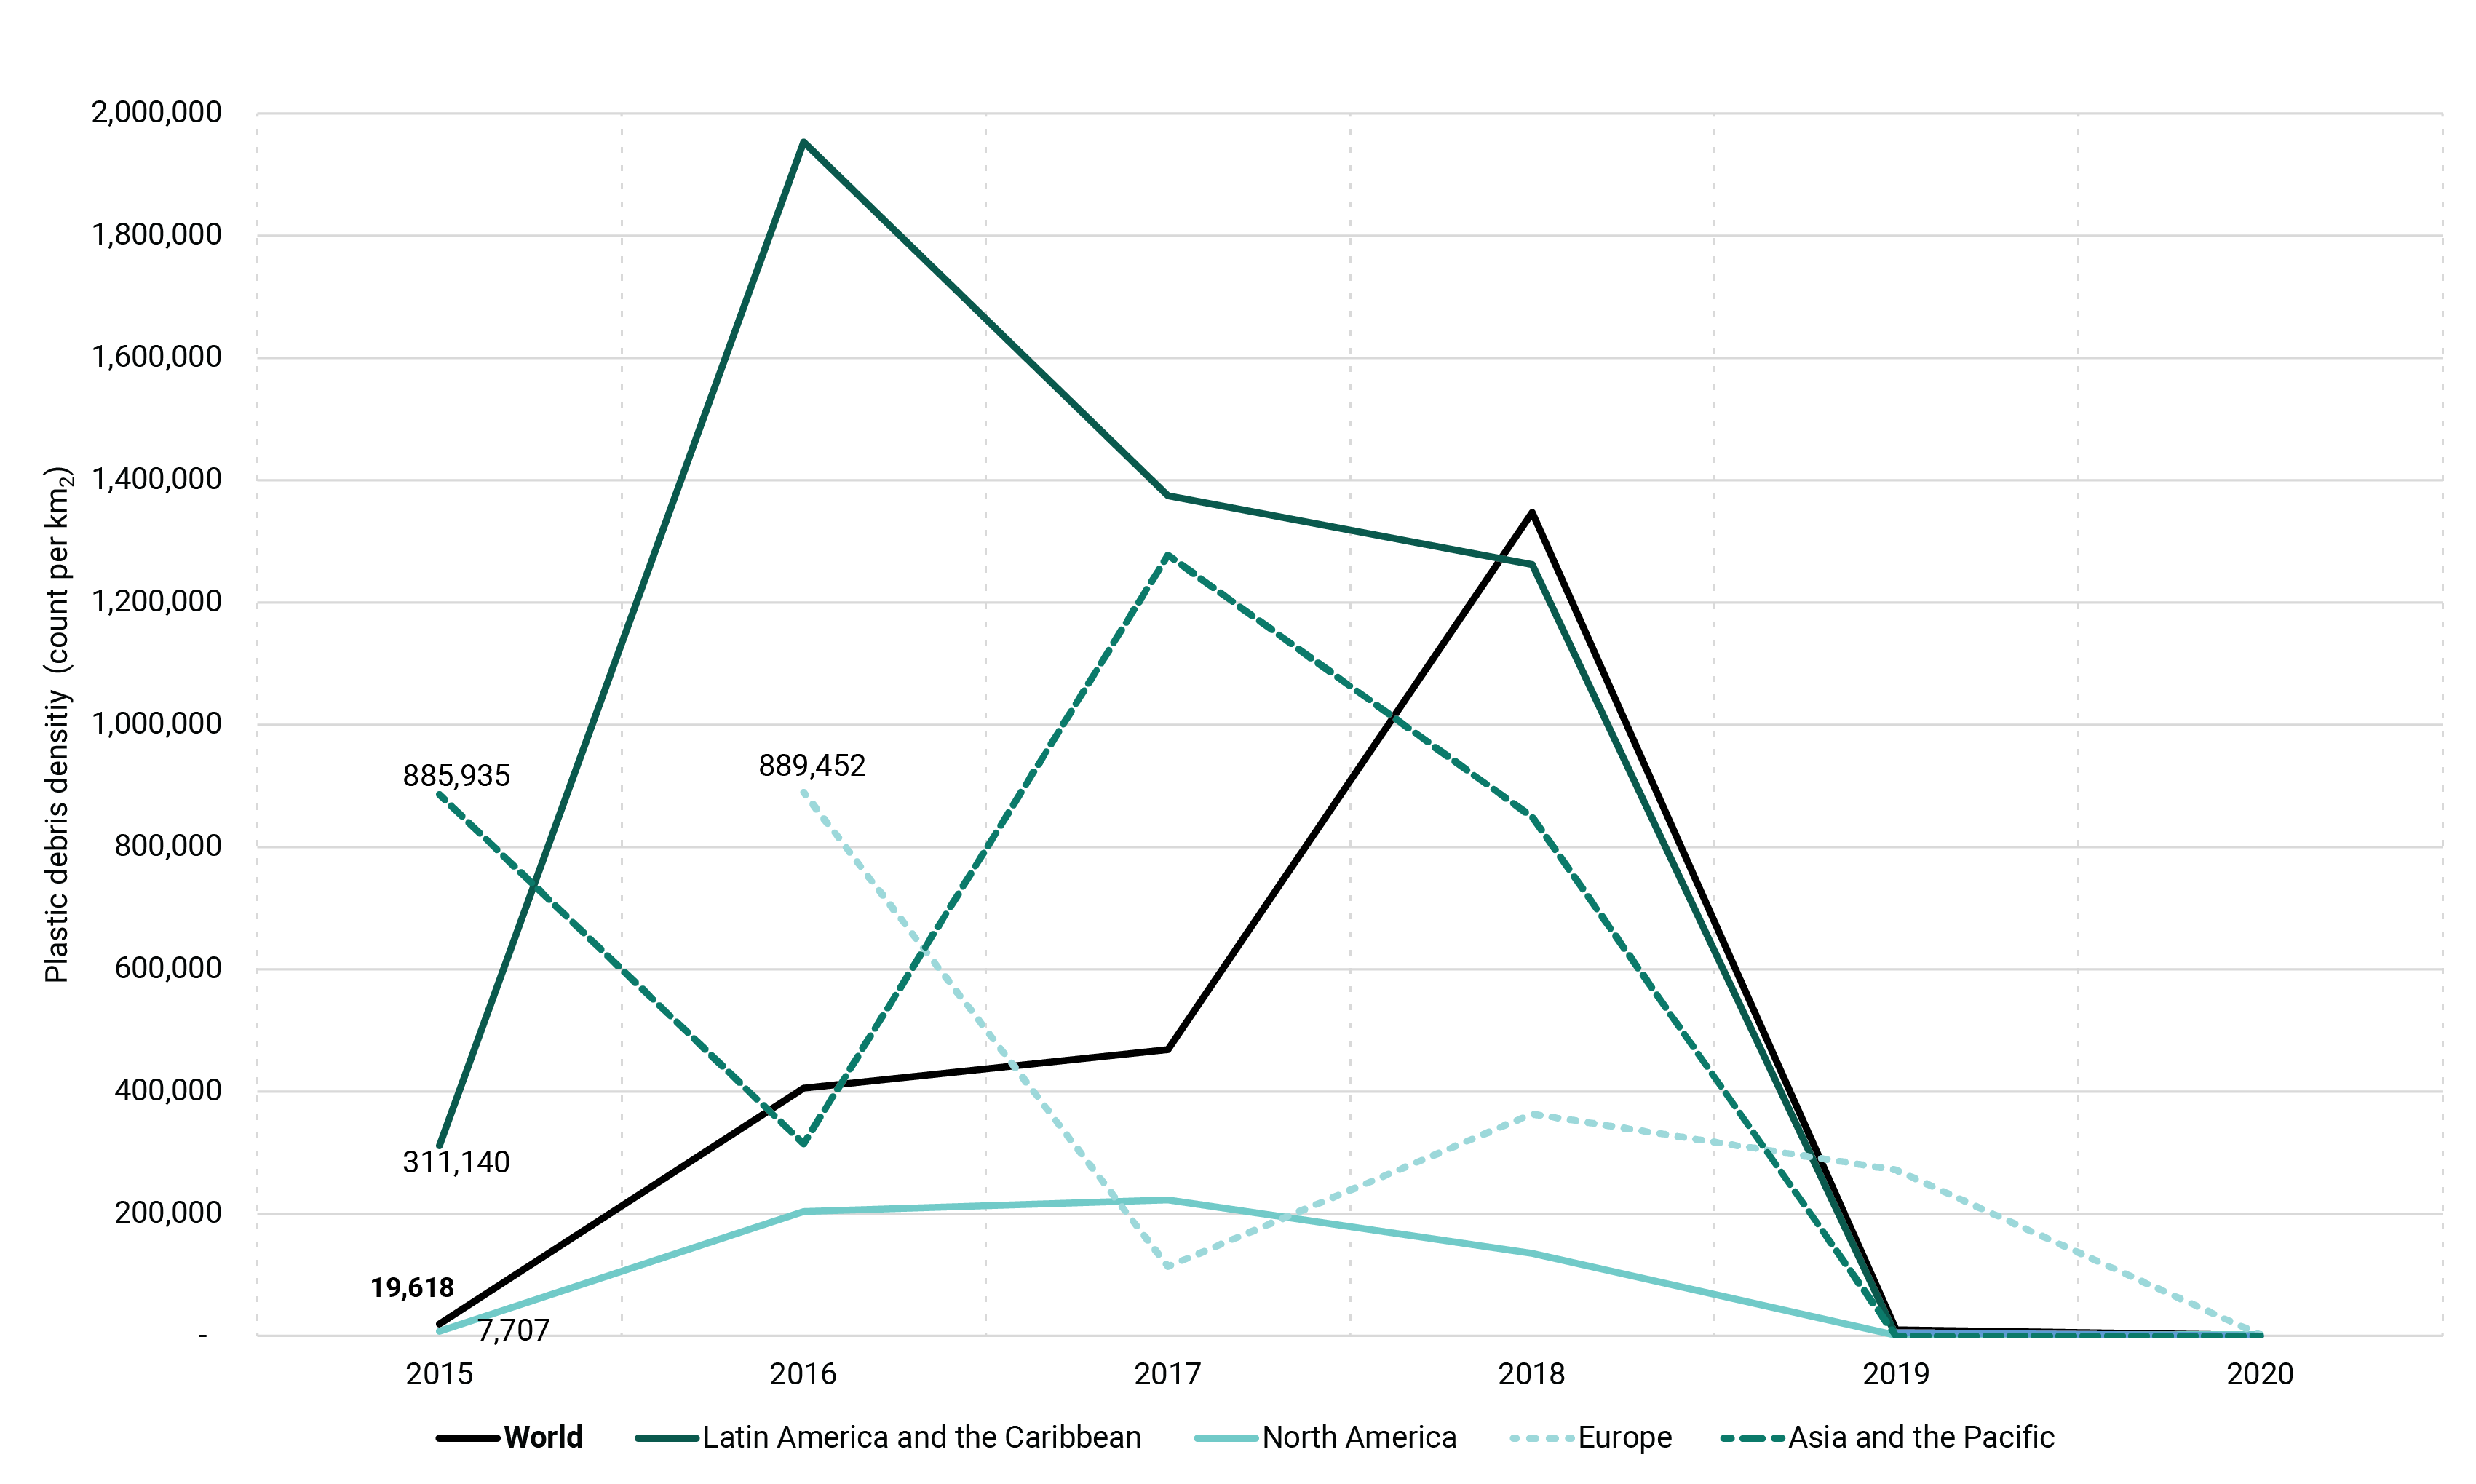
Indicator 14.1.1(b) is under SDG Goal 14: “Conserve and sustainably use the oceans, seas and marine resources for sustainable development”, Target 14.1: “By 2025, prevent and significantly reduce marine pollution of all kinds, particularly from land-based activities, including marine debris and nutrient pollution.”
Heavy consumption and rapid disposal of plastic items are leading to a visible accumulation of plastic debris, which is reaching the most remote areas of the planet (Caruso et al. 2022). This SDG indicator measures plastic debris density on beaches or shorelines (beach litter); floating on water or in the water column; deposited on the seafloor/seabed; and ingested by biota (e.g. seabirds). Available data indicate a sharp rise in plastic debris density between 2015 and 2018, followed by a steep decline to 2020. A similar trend is seen in all regions, with plastic debris density having been reduced in some regions more quickly than in others.
Marine litter has adverse impacts on marine organisms, ecosystems and habitats, causing physical harm to marine life through incidental or deliberate ingestion, entanglement and ghost fishing. Plastics account for around 85 per cent of total marine litter (UNEP 2021a). They can act as carriers of pathogens and viruses, invasive alien species (García-Gómez Garrigós and Garrigós 2021) and chemicals sorbed to them from the surrounding water, which may include persistent bioaccumulative and toxic substances (PBTs) (UNEP 2021a).
While specific effects of marine debris on migratory as opposed to resident species were once poorly understood, new findings are becoming available (e.g. Secretariat of the Pacific Regional Environment Programme 2017; Battsti et al. 2019; Horton and Blissett 2021). Migratory wildlife species are likely the most vulnerable to plastic pollution; although not all species have been found to interact with plastics, in some cases lack of evidence is likely due to insufficient research and available information (Horton and Blissett 2021).
Insufficient global/regional data for analysis.
See detailed information▼ or See the fisheries and aquaculture data from FAO
Billions of people rely on fish and other types of seafood as their main source of protein, while for millions of them fishing is their principal livelihood. However, excessive fishing or overfishing adversely affects the functioning of ecosystems and reduces biodiversity through adverse impacts on critical habitats, enables the introduction of invasive species, and reduces the oceans’ ability to mitigate climate change (Link et al. 2020; World Wildlife Fund [WWF] 2023). Overfishing can impact entire ecosystems by altering the size of fish remaining, how they reproduce and the speed at which they mature (WWF 2023).
Fisheries and aquaculture are significant sources of marine pollution. At least 10 per cent of marine litter is estimated to be made up of fishing waste, which means that between 500,000 and 1 million MT of fishing gear enters the ocean per year (up to 10 per cent of all marine litter) (WWF 2020; Richardson et al. 2021). An estimated 5.7 per cent of fishing nets, 8.6 per cent of traps and pots, and 29 per cent of fishing lines used globally are lost every year (WWF 2020).
Destructive fishing techniques include the use of dynamite and cyanide (creating a highly toxic substance, sodium cyanide), which damages coral reefs and threatens biodiversity (Hampton-Smith, Bower and Mika 2021). Seabed trawling (Hiddink et al. 2017; Bradshaw et al. 2021) and dredging (Chopra 2021) can trigger the re-release of pollutants. Approximately 1.5 billion MT of aqueous carbon dioxide per year might be released as a result of bottom trawling, equal to the amount released on land through agriculture (Averett 2021).
Aquaculture activities can lead to the release of pollutants including nutrients, pharmaceuticals, other inputs and organic waste. The nutrients supplied to the farmed animals are not fully consumed, with only 30 per cent reportedly utilized by fish, molluscs or crustaceans and the rest settling and accumulating as a particulate fraction (commonly referred to as sediment or sludge) made of mainly of organic matter, nitrogen and phosphorus (Chiquito-Contreras et al. 2022). Depending on the quantity of pollutants released to the marine environment, they can lead to disruption of the biological growth, migration and spawning patterns of fish as well as other environmental impacts (Bergland et al. 2020).
Both capture and aquaculture production have been increasing globally to accommodate the reliance of growing numbers of people on fish and other types of seafood. There has been a more significant increase in aquaculture production than in capture production. At the same time, the share of non-food uses of fish and seafood products in total consumption has decreased in the past 20-30 years, indicating that as production increases more fish and other types of seafood are available for human consumption.
See detailed information▼ or Search the most up to date data
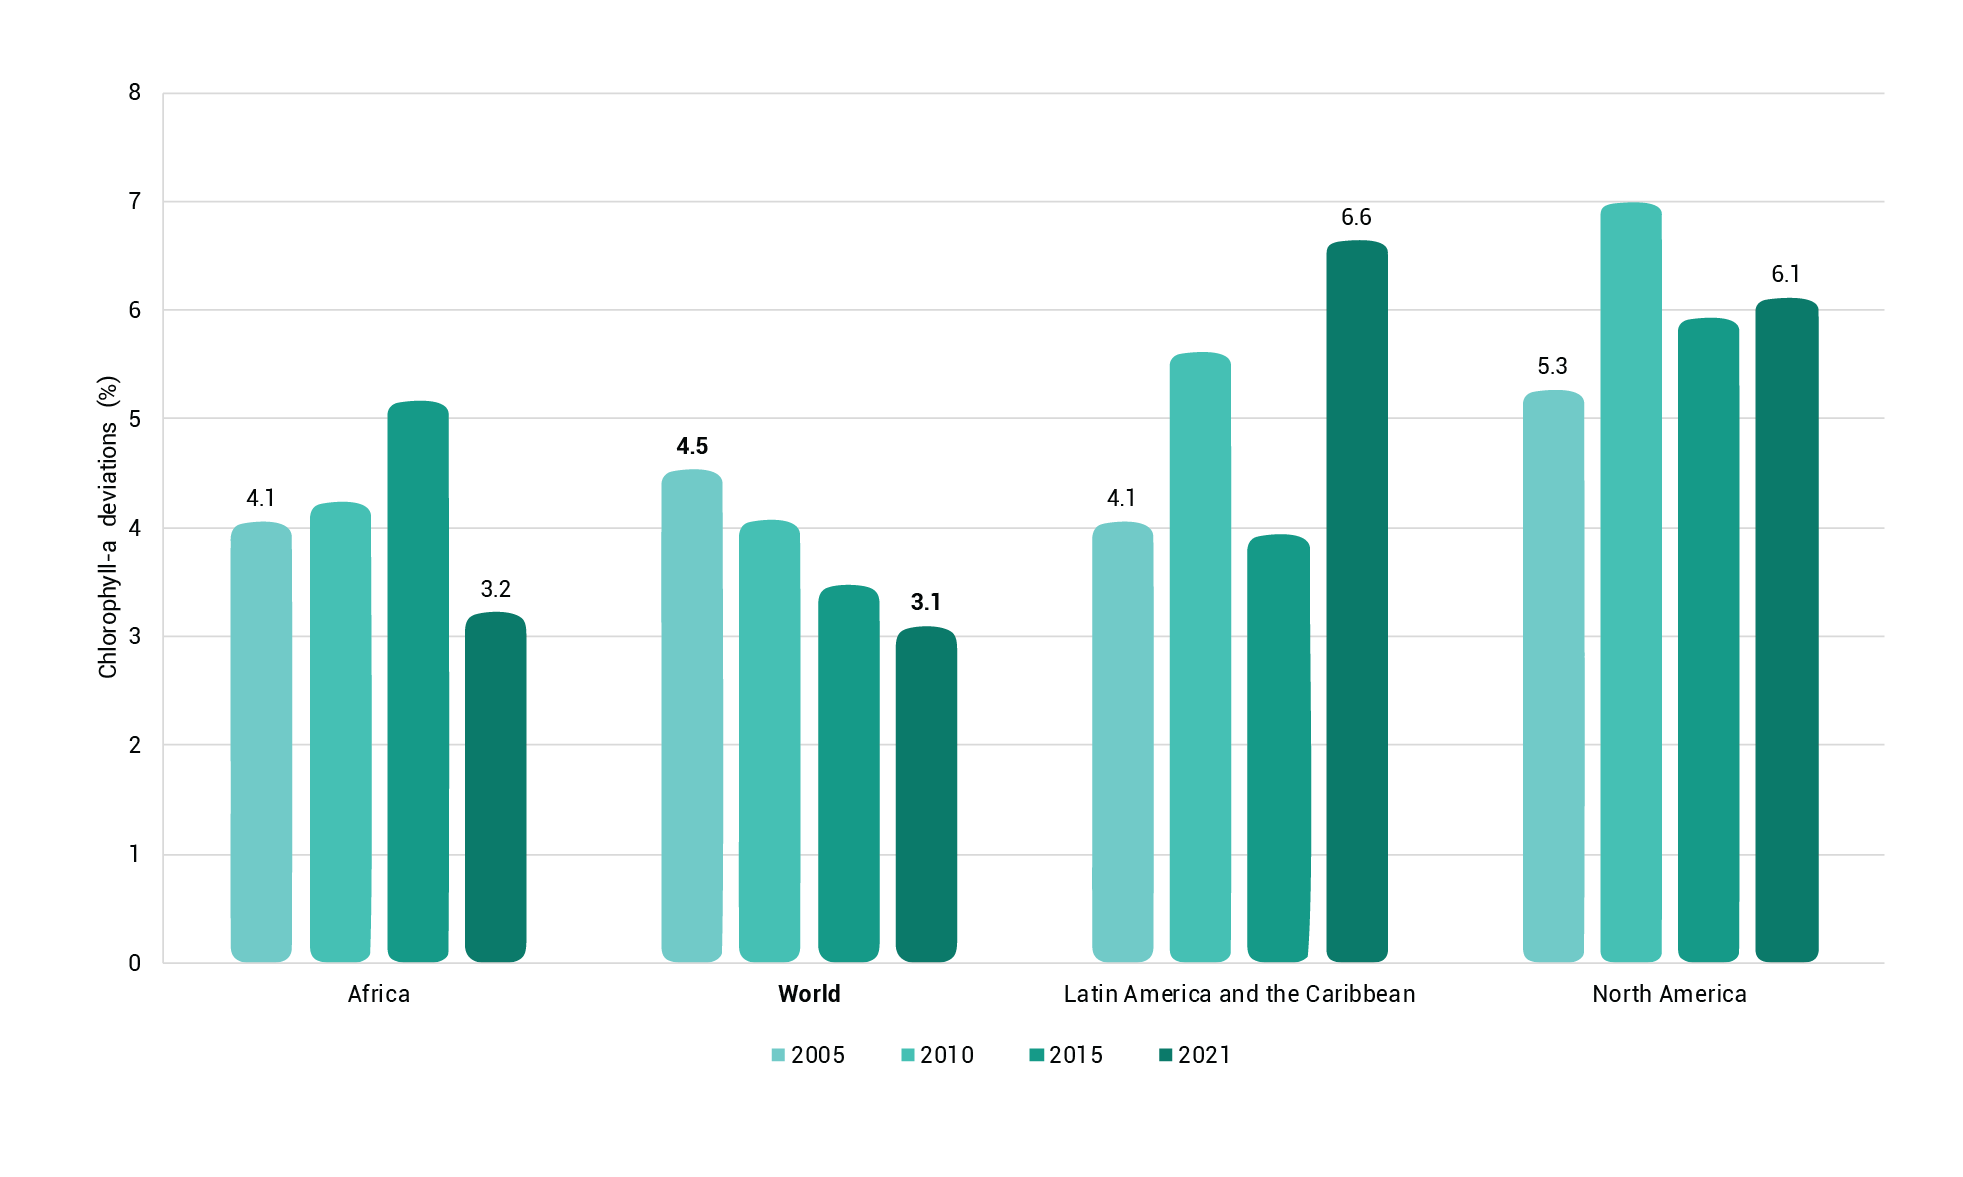
Indicator 14.1.1(a) is under SDG Goal 14: “Conserve and sustainably use the oceans, seas and marine resources for sustainable development”, Target 14.1: “By 2025, prevent and significantly reduce marine pollution of all kinds, particularly from land-based activities, including marine debris and nutrient pollution.”
Chlorophyll-a deviations are one of the monitoring parameters for eutrophication used to track progress against indicator 14.1.1a. They can be used as a proxy for phytoplankton biomass in coastal areas. Chlorophyll’s distinctive green colour is mainly found in algal species which, if they are abundant, indicate eutrophication of coastal waters. Chlorophyll-a deviations from the baseline (data from 2000 to 2004, calculated to one value) are shown in the figure, which reveals increasing percentages of chlorophyll-a deviations in Africa up to 2015, followed by a decrease in 2021, and increases in Latin America and the Caribbean and North America up to 2021. Globally, the percentage of chlorophyll-a deviations fell between 2005 and 2021 (from 4.5 per cent to 3.1 per cent), indicating that efforts by many countries to address eutrophication have positively impacted marine areas.
A large proportion of coastal pollution originates from land, including wastewater and nutrient run-off that leads to coastal eutrophication, degraded water quality, and impairment of marine ecosystems. Furthermore, nutrient loads in coastal areas exacerbate eutrophication and algal blooms that further deteriorate water quality and impair human health.
Levels of coastal eutrophication are measured in situ or using satellite remote sensing (Poddar, Chacko and Swain 2019; UNEP 2021a). Coastal eutrophication can lead to serious damage to marine ecosystems, which are vital habitats, causing algal blooms and degraded water quality. The abundance of algae can potentially indicate the degree of eutrophication in coastal areas (Zheng and DiGiacomo 2017). Stringent regulations on agricultural practices have a positive impact on nutrient loads, eventually decreasing run-off into freshwater and coastal ecosystems.
See detailed information▼ or Search the most up to date data
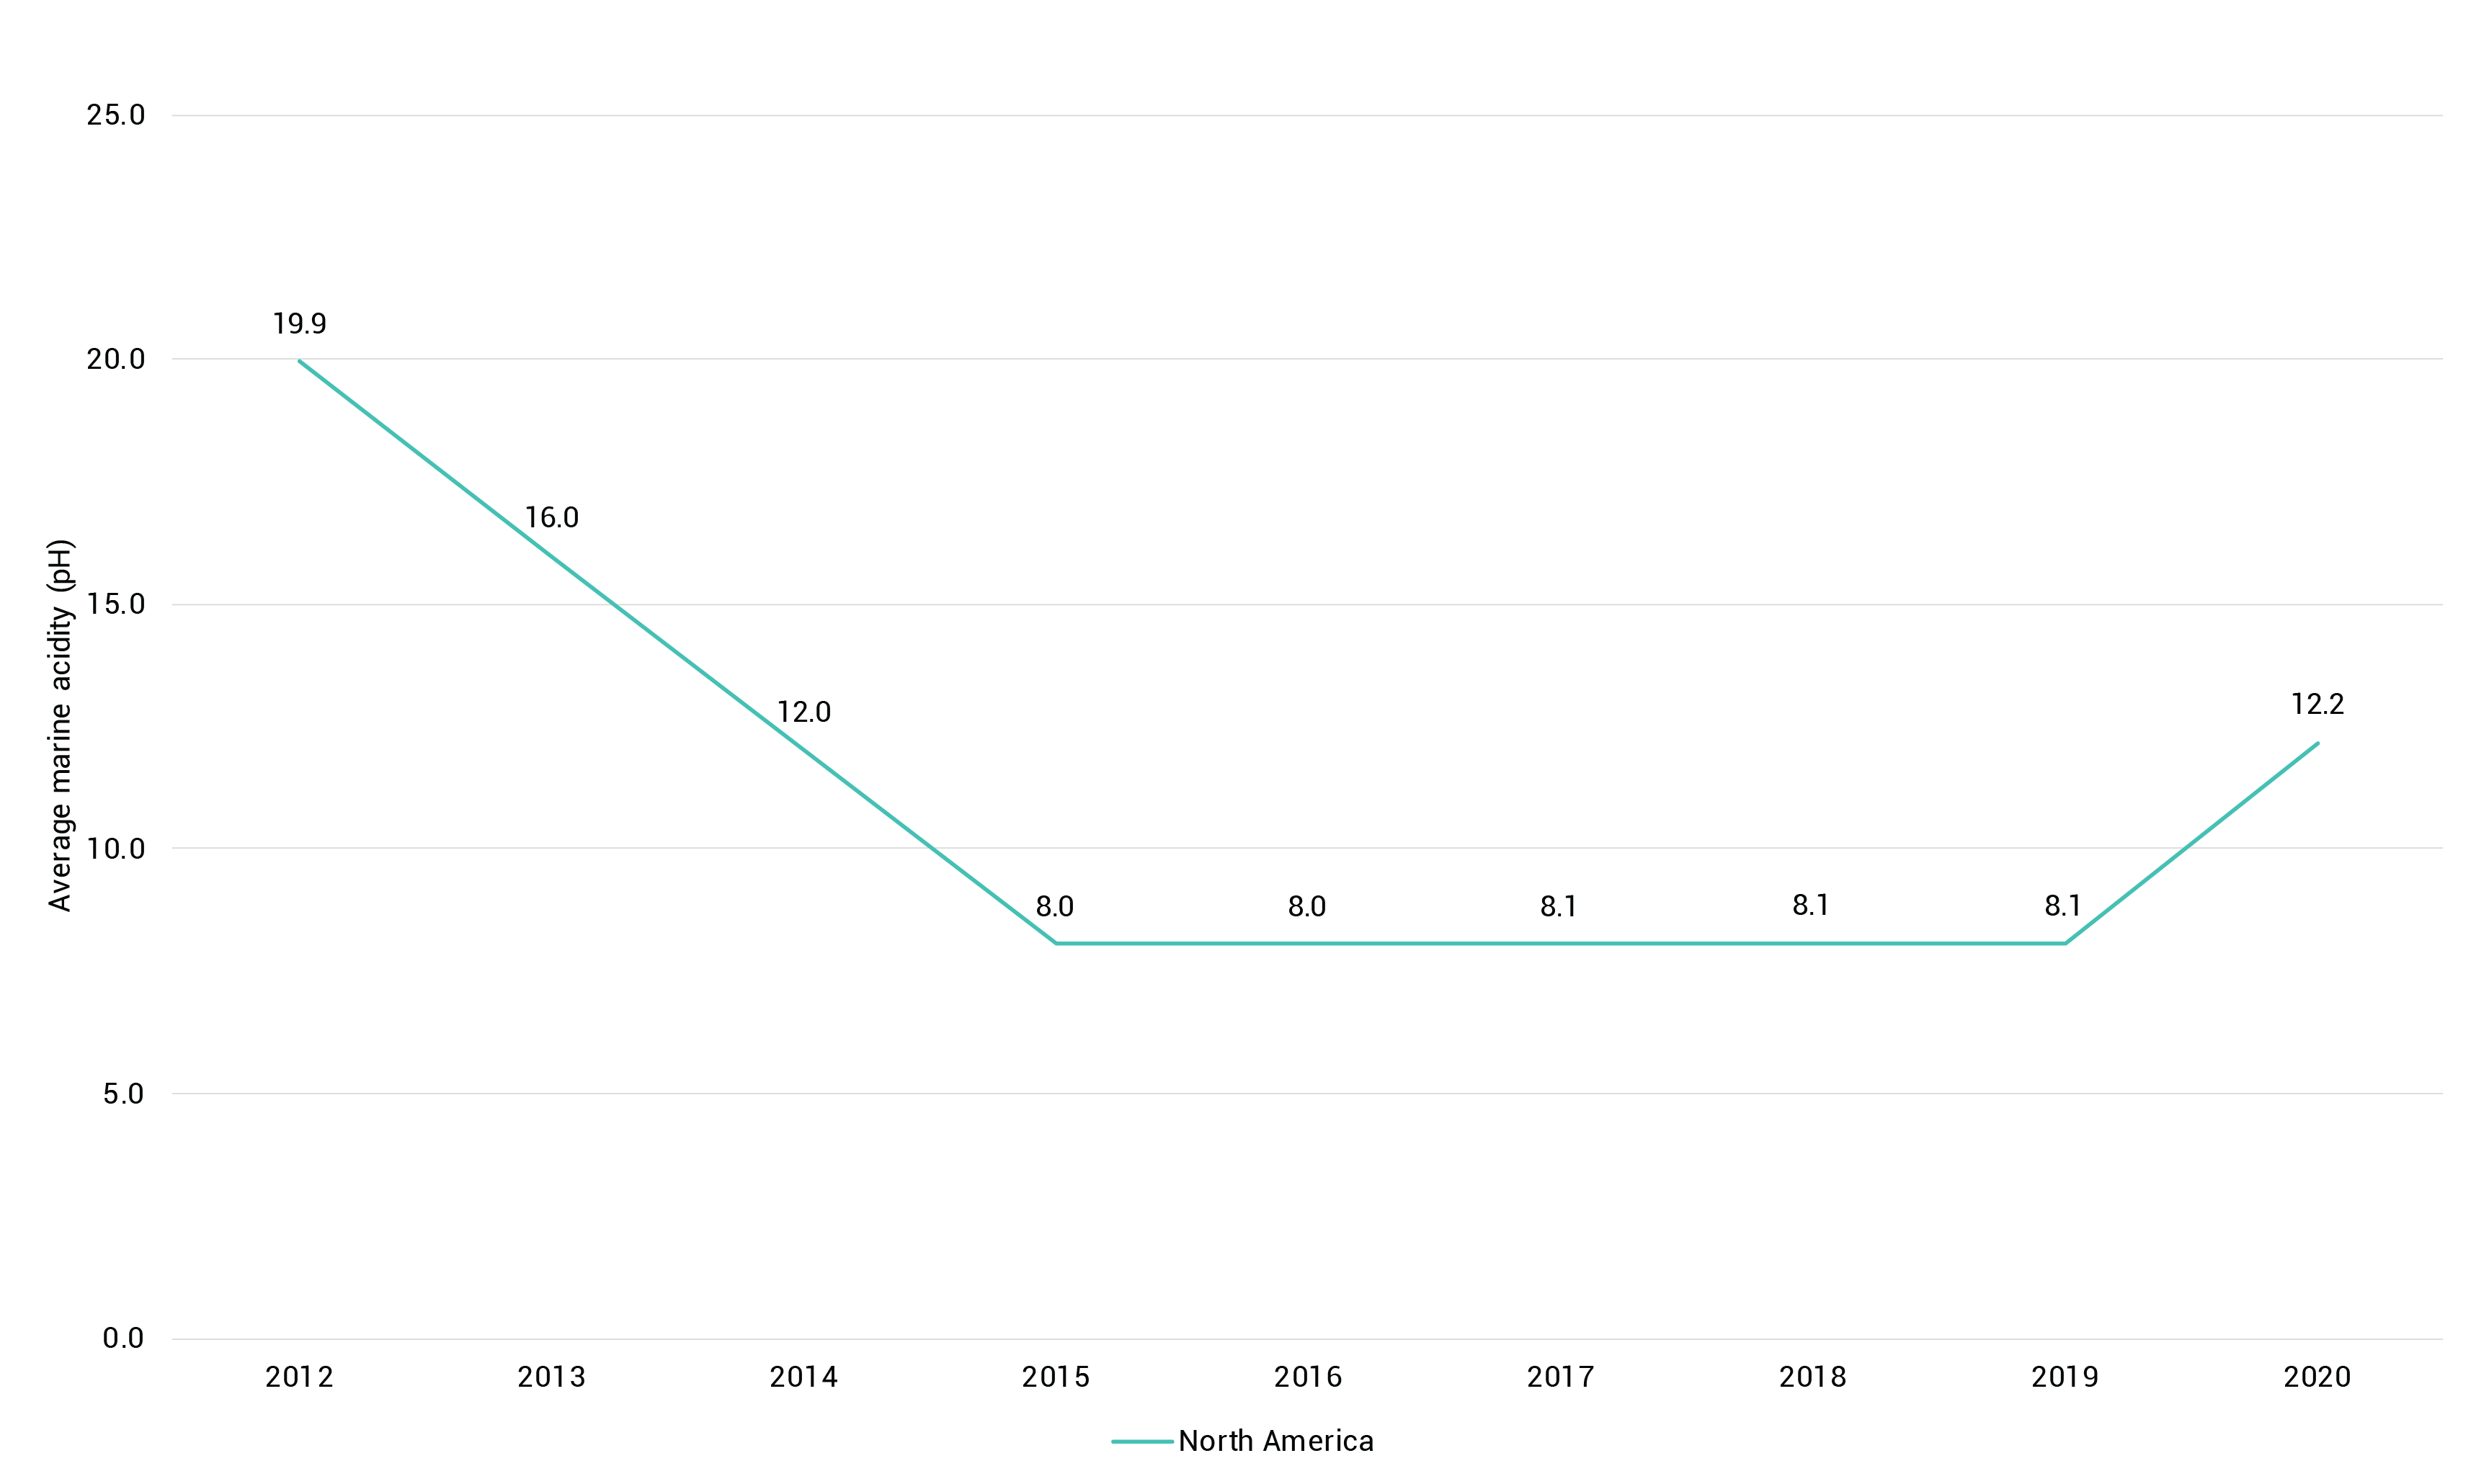
Indicator 14.3.1 is under SDG Goal 14: “Conserve and sustainably use the oceans, seas and marine resources for sustainable development”, Target 14.3: “Minimize and address the impacts of ocean acidification at all levels”.
Data for indicator 14.3.1 are scarce. Regional aggregations are unavailable except in the case of North America. Based on reporting on this indicator by representative sampling stations, global pH levels decreased and levelled off between 2012 and 2019 before increasing again from 2019 to 2020.
The oceans are the world’s largest carbon sink. They absorb around 30 per cent of the CO2 emitted to the atmosphere (NOAA 2020). Increasing uptake of dissolved CO2 emissions causes seawater to become more acidic by lowering pH levels (Gao et al. 2019). The impacts of ocean acidification are severe. They are widely seen in marine species, especially those with calcareous skeletons such as corals and plankton (Hill and Hoogenboom 2022).
Acidification threatens both organisms and ecosystem services, endangering fisheries and aquaculture and adversely affecting coastal protection by weakening coral reefs. Increases in acidification are expected to accelerate during the coming decades; as acidification worsens, the oceans’ capacity to absorb CO2 from the atmosphere will diminish, limiting its role in moderating climate change (United Nations 2022a).
See detailed information▼ or Search the most up to date data
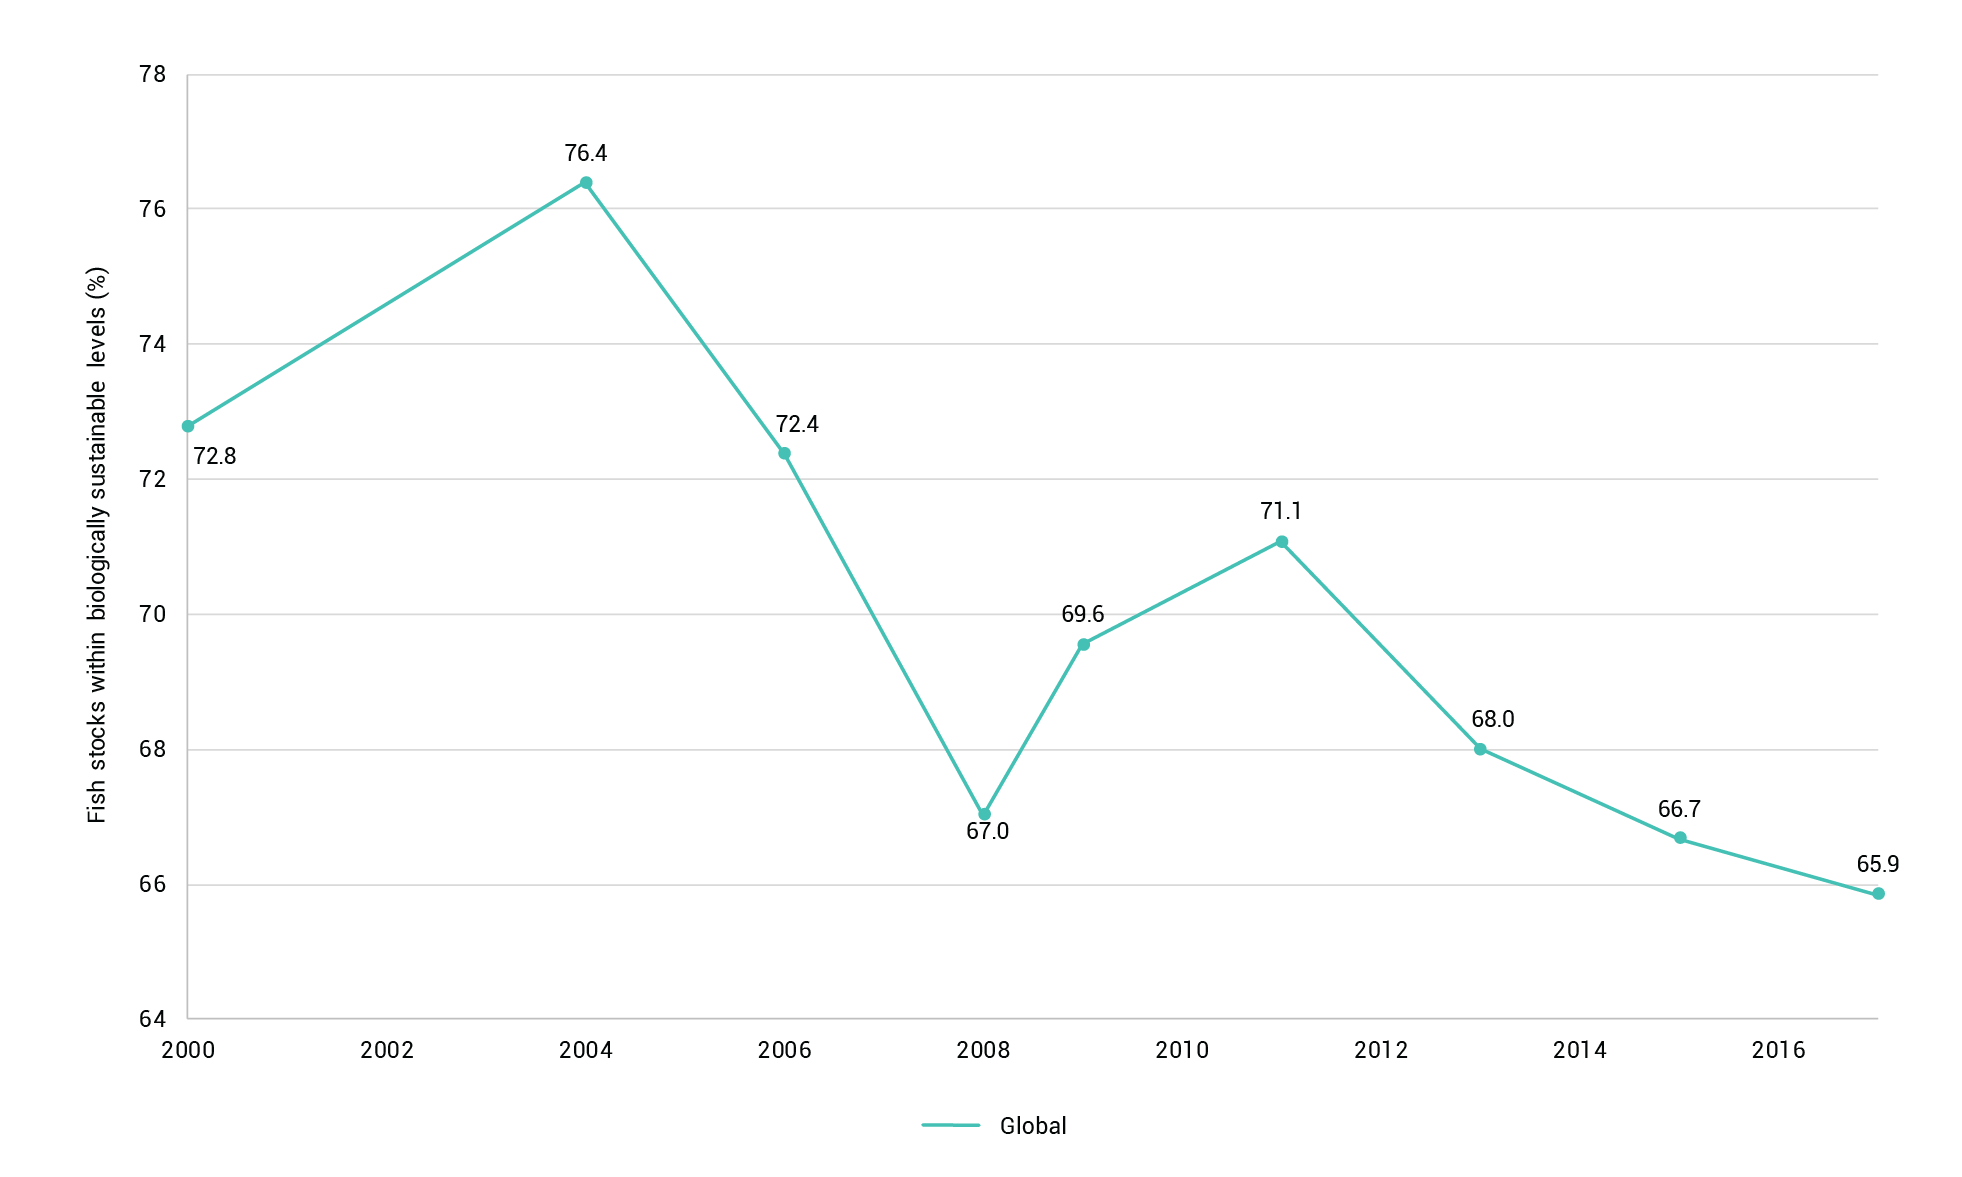
Indicator 14.4.1 is under SDG Goal 14: “Conserve and sustainably use the oceans, seas and marine resources for sustainable development”, Target 14.4: “By 2020, effectively regulate harvesting, and end overfishing, illegal, unreported and unregulated (IUU) fishing and destructive fishing practices and implement science-based management plans, to restore fish stocks in the shortest time feasible at least to levels that can produce maximum sustainable yield as determined by their biological characteristics”.
This indicator measures the sustainability of fish resources based on yield and reproduction. When fishing of a stock is biologically sustainable, a good yield is produced without the reproductivity of that stock being impaired ad with a good balance being reached between human use and ecological conservation. The proportion is calculated based on stock numbers, without weighting either by its production volume or stock abundance (i.e. every fish stock is considered of the same importance). This is the reason why there is no data at country level.
The proportion of the world´s fish stocks within biologically sustainable levels declined rapidly during the past three decades. In 1990, 82 per cent of global fish stocks were considered biologically sustainable. This proportion fell by more than 16 per cent to 66 per cent in 2017. More than one-third of all fish stocks are considered to be at unsustainable levels or overfished.
Deriving data for indicator 14.4.1 is technically demanding, as stock assessment is required. Regionally disaggregated data and national data are not available for this indicator.
Fisheries and aquaculture are among the world´s largest protein sources and are crucial for food security and nutrition safety (FAO 2022). Natural changes have always occurred in the oceans; however, anthropogenic removal of resources (including fish and other marine resources) is the most extensive and widespread change in their state. The negative impact of fish species reduction is discussed in regard to the fisheries and aquaculture production indicator, above under the Driver
pressure indicators. To protect the survival and sustainability of fisheries, fish populations must be preserved at a biologically viable level. Proper fisheries management and aquaculture practices ensure sustainable use of aquatic resources and preserve marine biodiversity and ecosystems (FAO 2022).
Insufficient global/regional data for analysis.
See detailed information▼ or Search the most up to date data
See detailed information▼ or Search the most up to date data
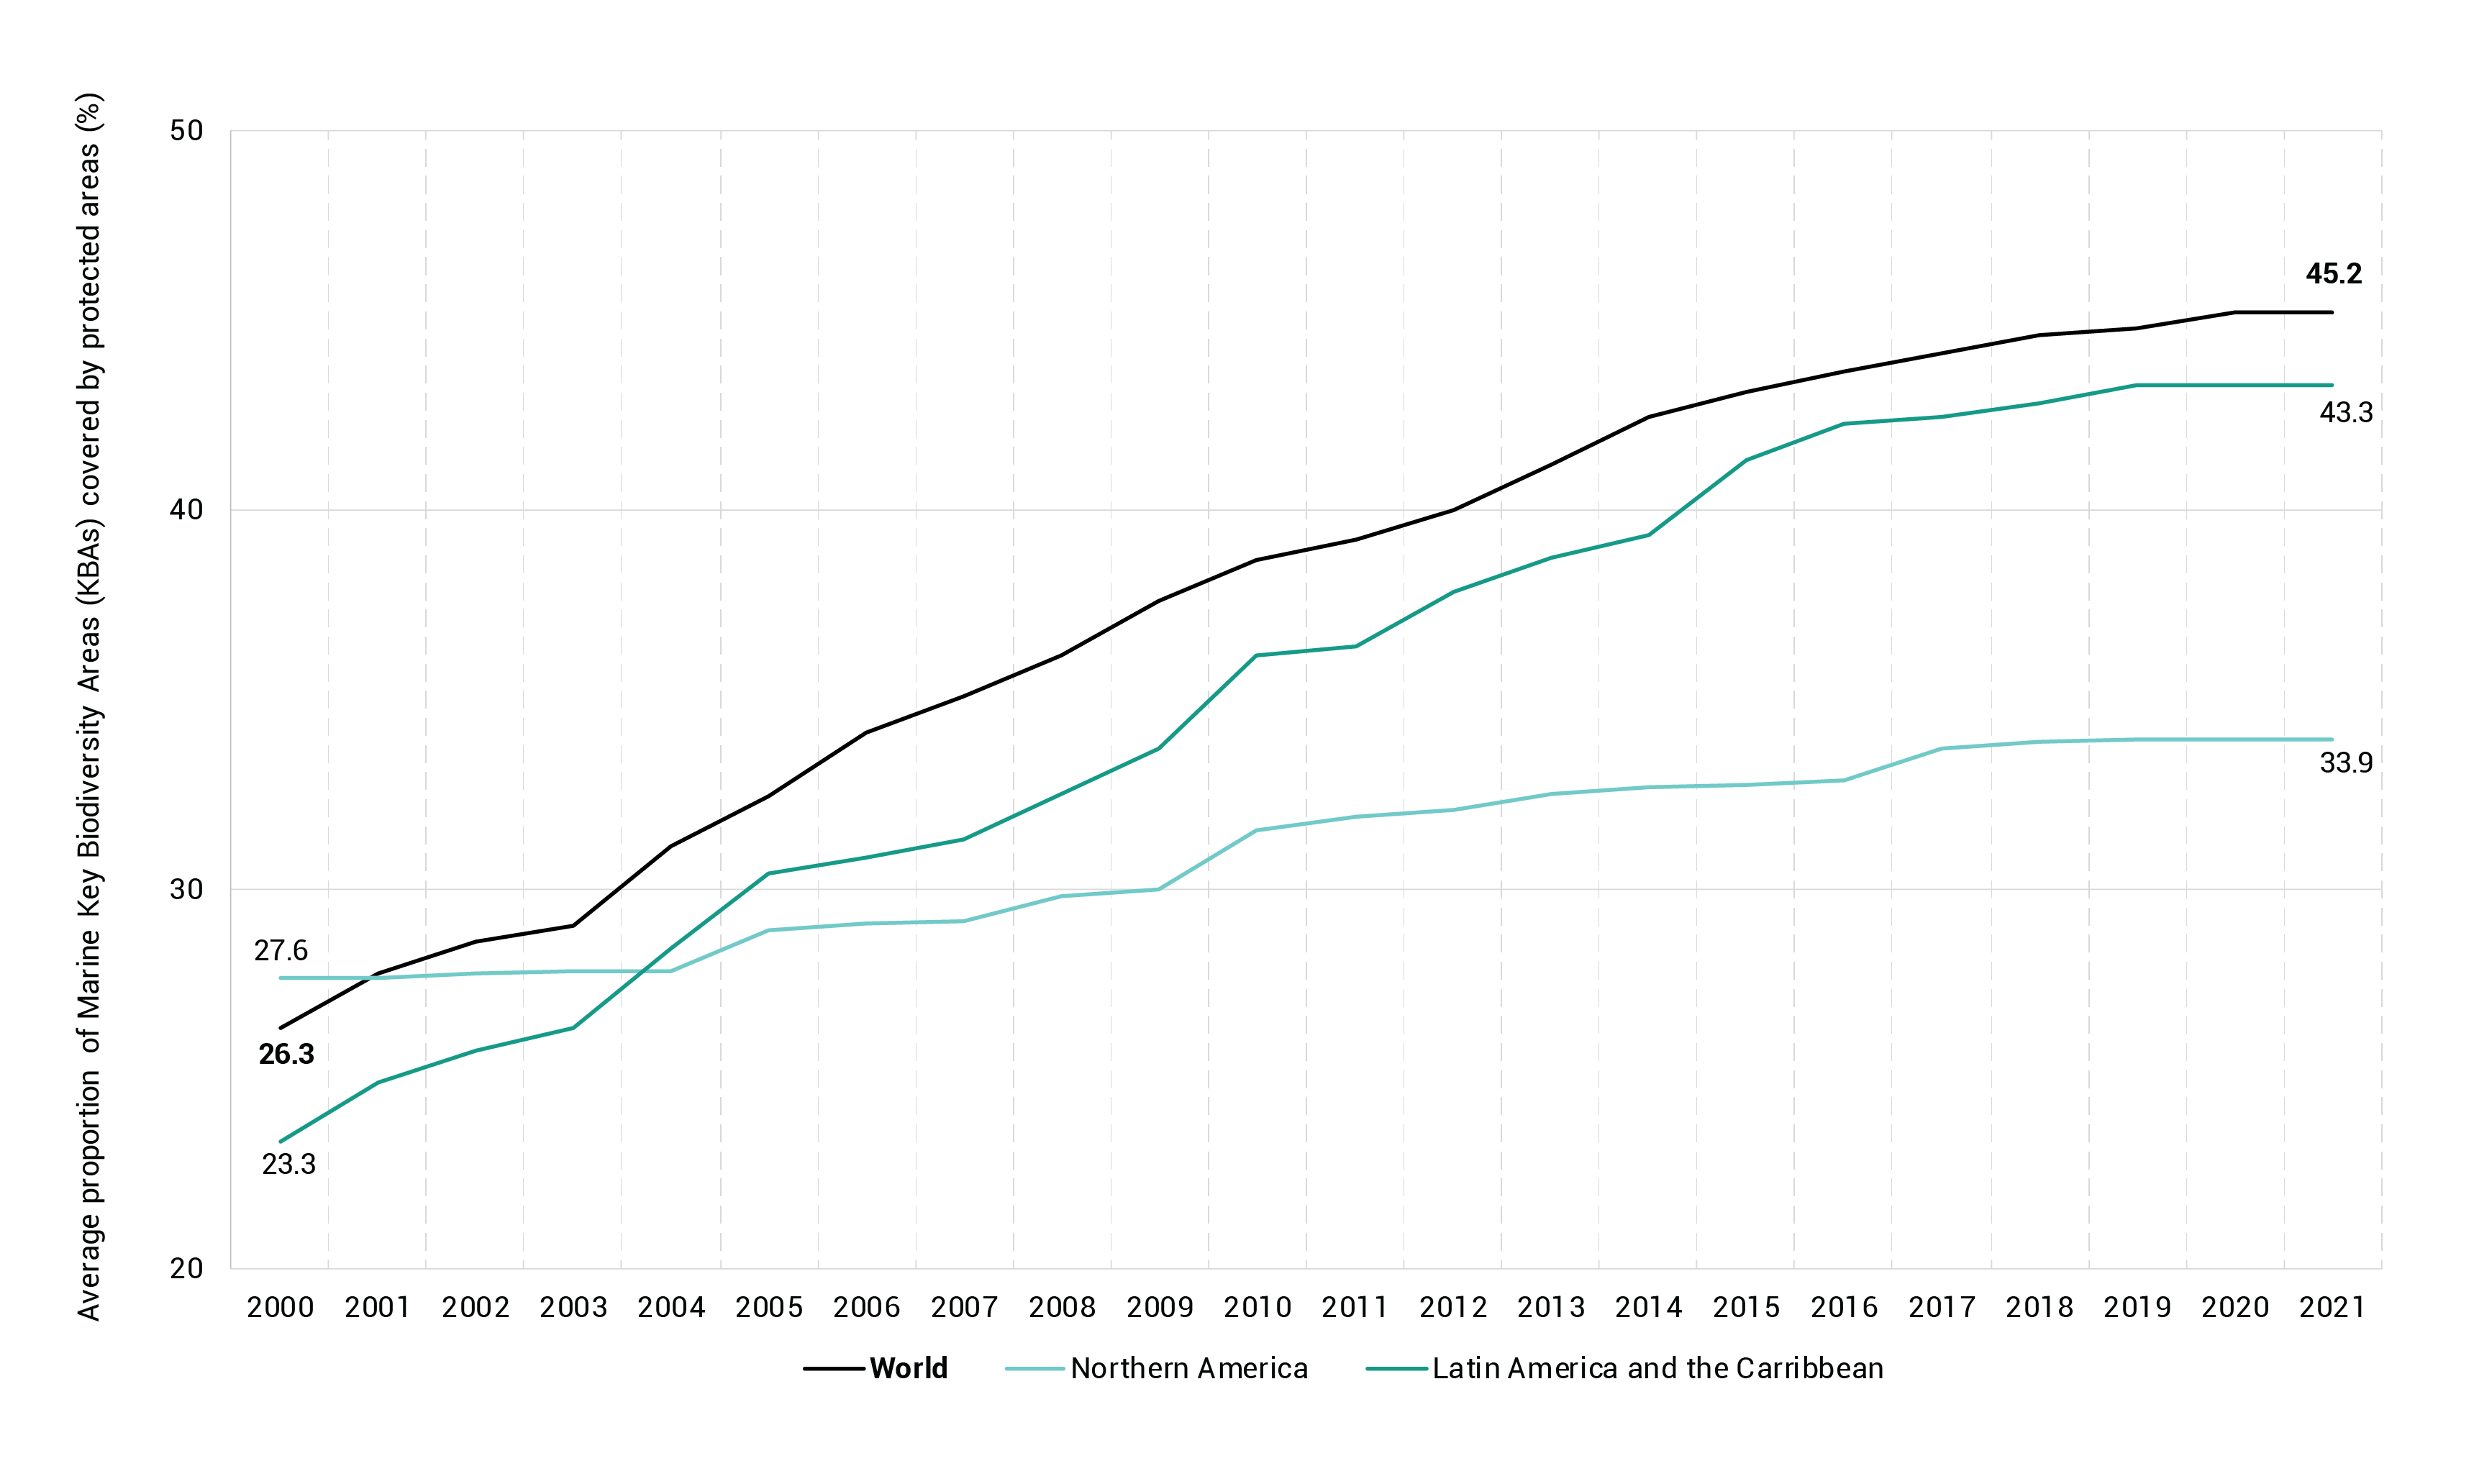
Indicator 14.5.1 is under SDG Goal 14: “Conserve and sustainably use the oceans, seas and marine resources for sustainable development”, Target 14.5: “By 2020, conserve at least 10 per cent of coastal and marine areas, consistent with national and international law and based on best available scientific information.” This indicator measures the average proportion of each marine Key Biodiversity Area (KBA) that has been designated a protected area. KBAs are sites that contribute significantly to the global persistence of biodiversity. They are identified using globally standard criteria for the identification of KBAs (IUCN 2016) applied at national levels.
The figure shows the mean percentage of marine Key Biodiversity Areas (KBAs) covered by protected areas between 2000 and 2021. Globally, 45 per cent of KBAs were covered by protected areas in 2021, an increase of almost 20 per cent compared to 2000 levels. The proportion of KBAs covered by protected areas in Latin America and the Caribbean increased by more than 20 per cent during the same period. In North America in 2021, 34 per cent of marine KBAs were covered compared to 28 per cent in 2000. Overall, available data indicated steady and significant growth rates, meaning there is greater protection of marine and coastal biodiversity from pollution.
As of February 2023, the World Database on Protected Areas showed that about 8.16 per cent of the total global marine area is covered by protected areas (UNEP and IUCN 2023).
Safeguarding protected marine areas is vital in order to reduce declining biodiversity rates and help ensure sustainable use of marine resources. Depending on the level of protection of Marine Protected Areas (MPAs), they can act as a policy instrument and a conservation tool to achieve ecological benefits and protect marine environments from anthropogenic stressors such as pollution, overexploitation and degradation (Abessa et al. 2018). A minimal level of protection ensures reduction of some types of activities, which in turn impacts the capacity of the protected area to degrade pollutants and conserve biological diversity (Kelleher 1999).
See detailed information▼ or Search the most up to date data
Globally, only 14 countries have confirmed mechanisms in place to report data for SDG indicator 14.a.1. The available data are insufficient for regional or global aggregations and analysis.
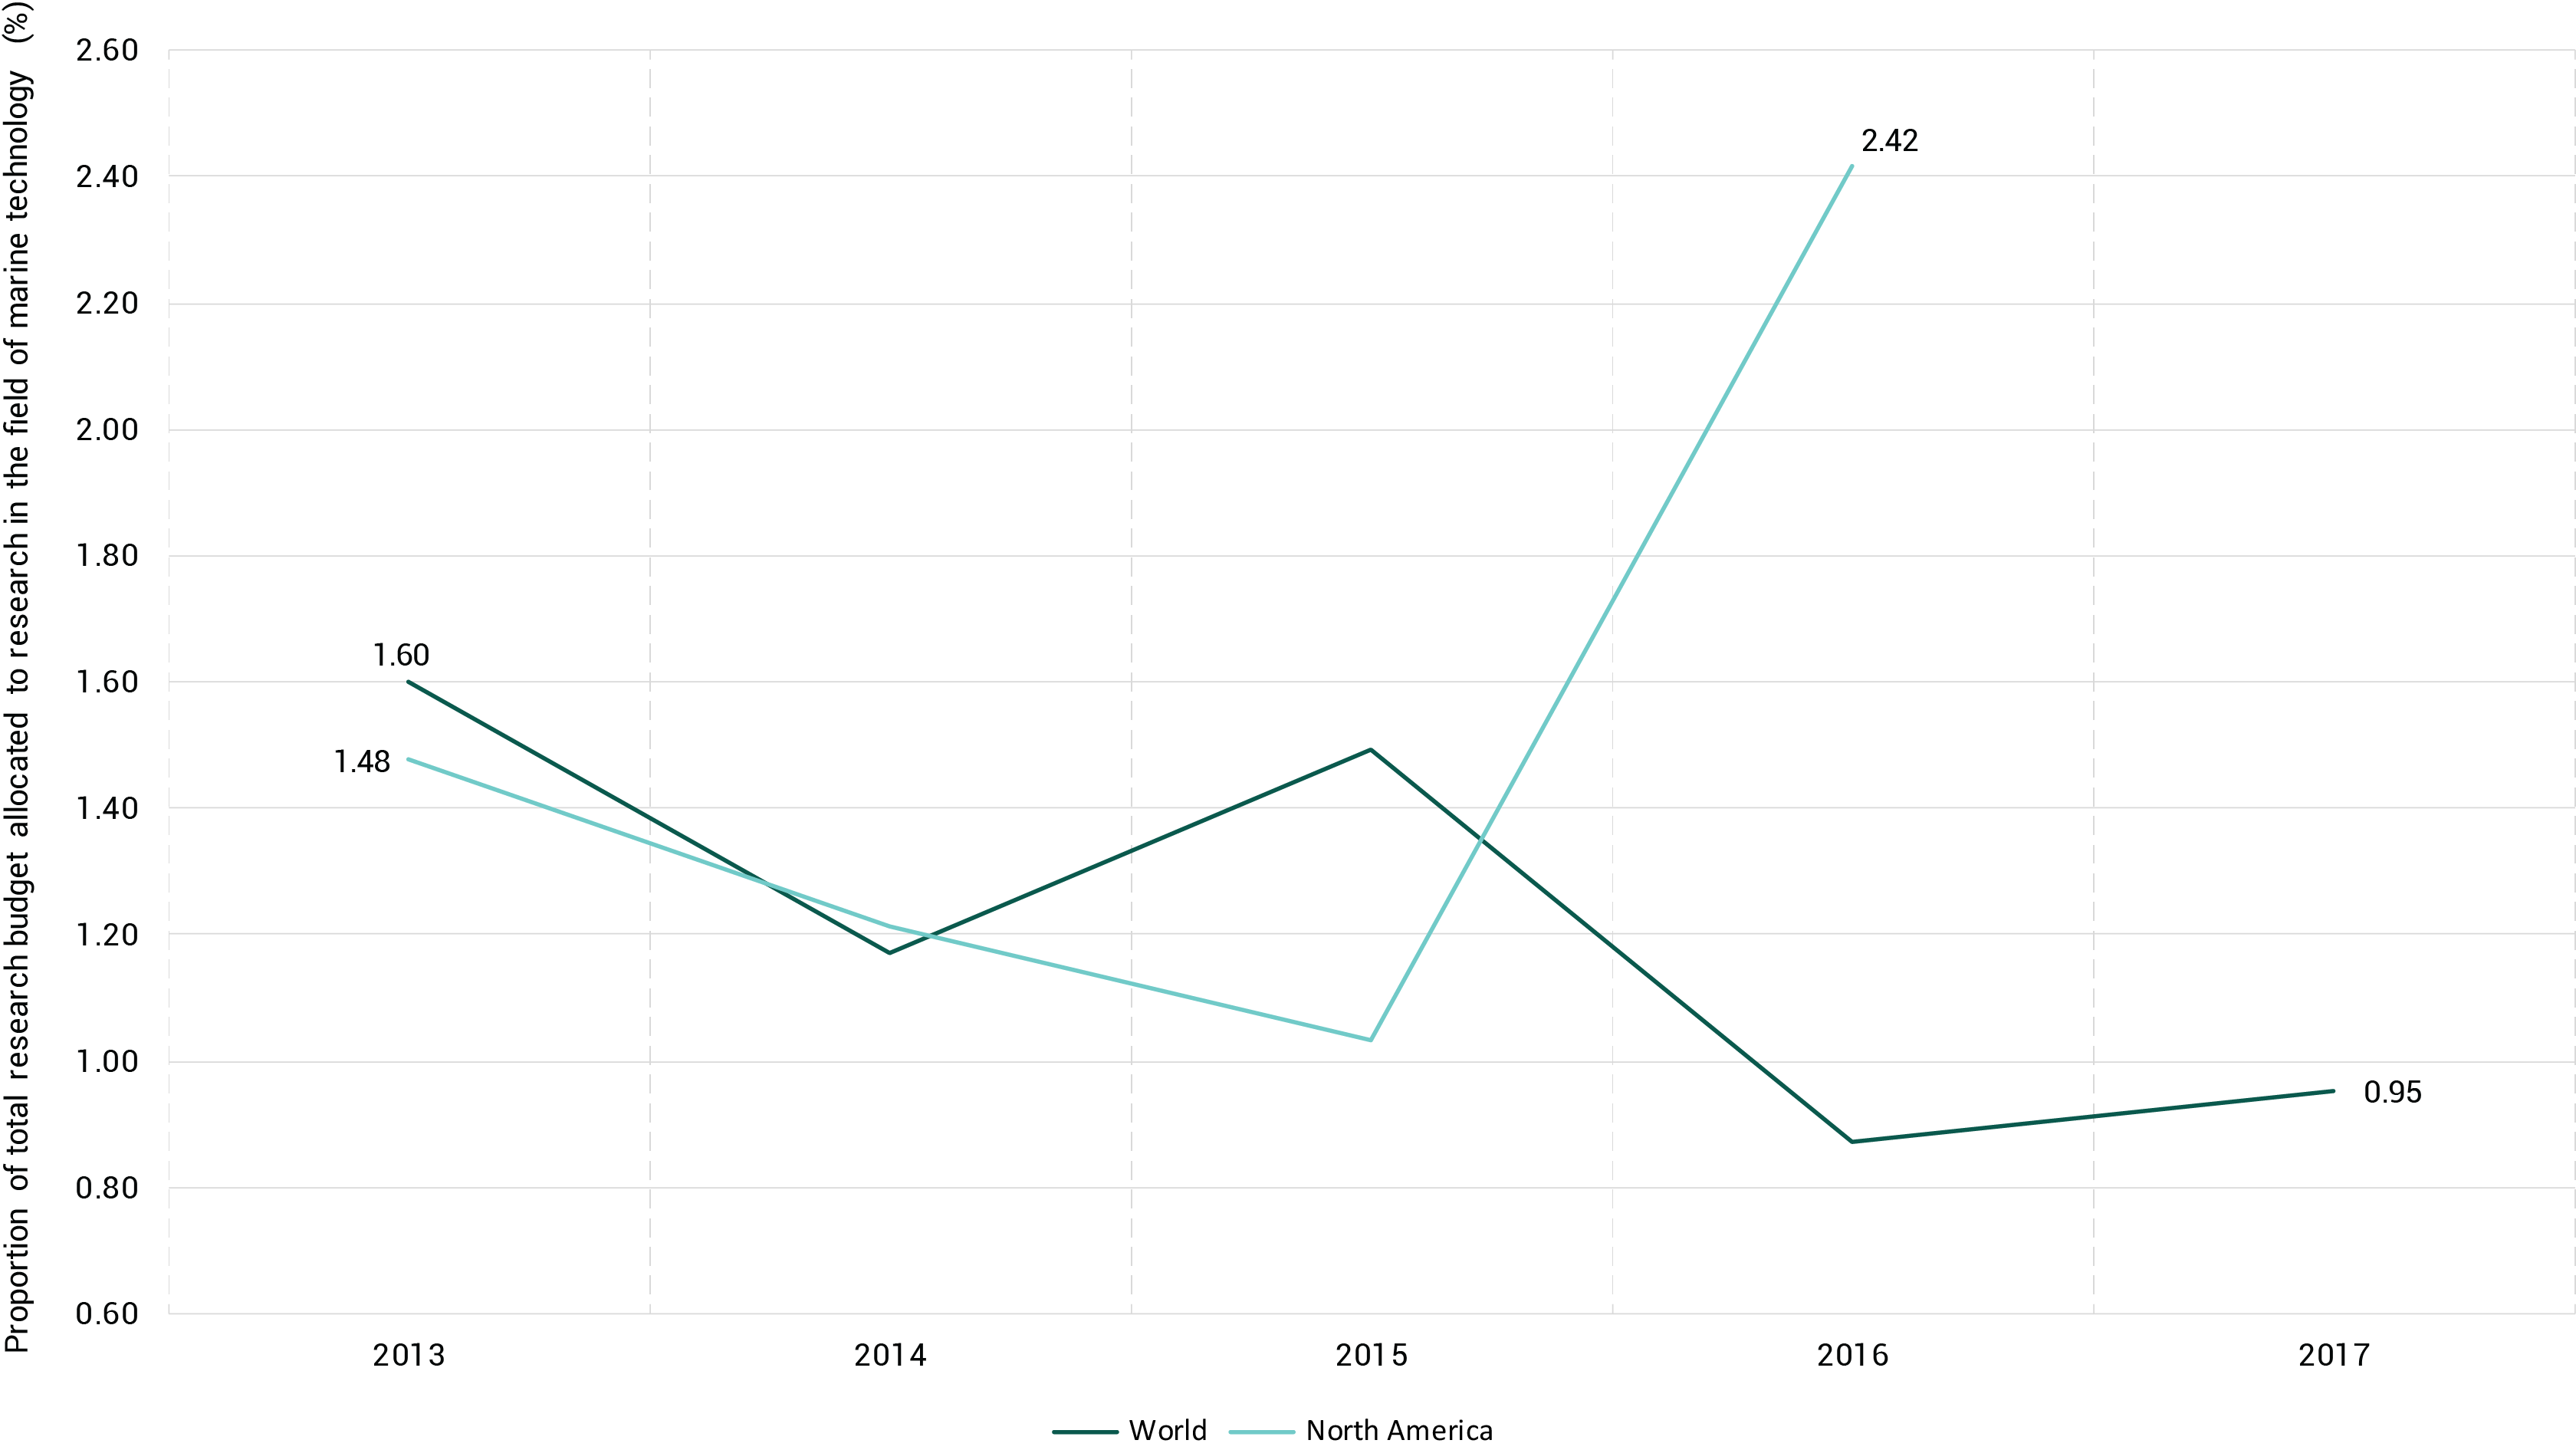
New technologies have the potential to minimize food loss and waste and incentivize more efficient resource use, leading to less resource extraction, less pollution and less degradation (FAO 2022; FAO, International Fund for Agricultural Development [IFAD], United Nations Children’s Fund [UNICEF], World Food Programme [WFP] and WHO 2022). For example, around up to 35 per cent of the world’s annual fish harvest is being lost along the supply chain (World Economic Forum 2022).
Sustained and cost-effective investments in marine technologies are imperative to obtain and understand knowledge that supports a healthy, productive and resilient ocean threatened by accelerating climate change, pollution and resource extraction (International Oceanographic Commission – United Nations Educational, Scientific and Cultural Organization [IOC-UNESCO] 2020).
Knowledge about the marine environment, climate and coastal processes provides a basis for sustainable management of the oceans. Closing knowledge gaps will require ocean science to remain at the forefront of the global agenda (OECD 2019b; Pendleton, Evans and Visbeck 2020). Significant progress is taking place, for example, with respect to use of remote sensing and drones in monitoring (Viatte et al. 2020; UNEP 2021a; Institute of Industrial Science, The University of Tokyo 2022; Yang et al. 2022). However, there are still limitations related to, among other factors, instrumentation (Nair, Muthukumaravel and Sudhakar 2022), costs, policies, and pressure from the industries concerned (Christie et al. 2017).
The United Nations has proclaimed a Decade of Ocean Science for Sustainable Development (2021-2030) to support efforts to reverse the cycle of decline in ocean health and gather ocean stakeholders worldwide behind a common framework which will ensure ocean science that can fully support countries in creating improved conditions for sustainable development of the oceans. As mandated by the UN General Assembly, the Intergovernmental Oceanographic Commission (IOC) of UNESCO will coordinate the Decade’s preparatory process, inviting the global ocean community to plan for these ten years in ocean science and technology (United Nations n.d.b).
Insufficient global/regional data for analysis.
See detailed information▼ or Search the most up to date data
See detailed information▼ or see the data source
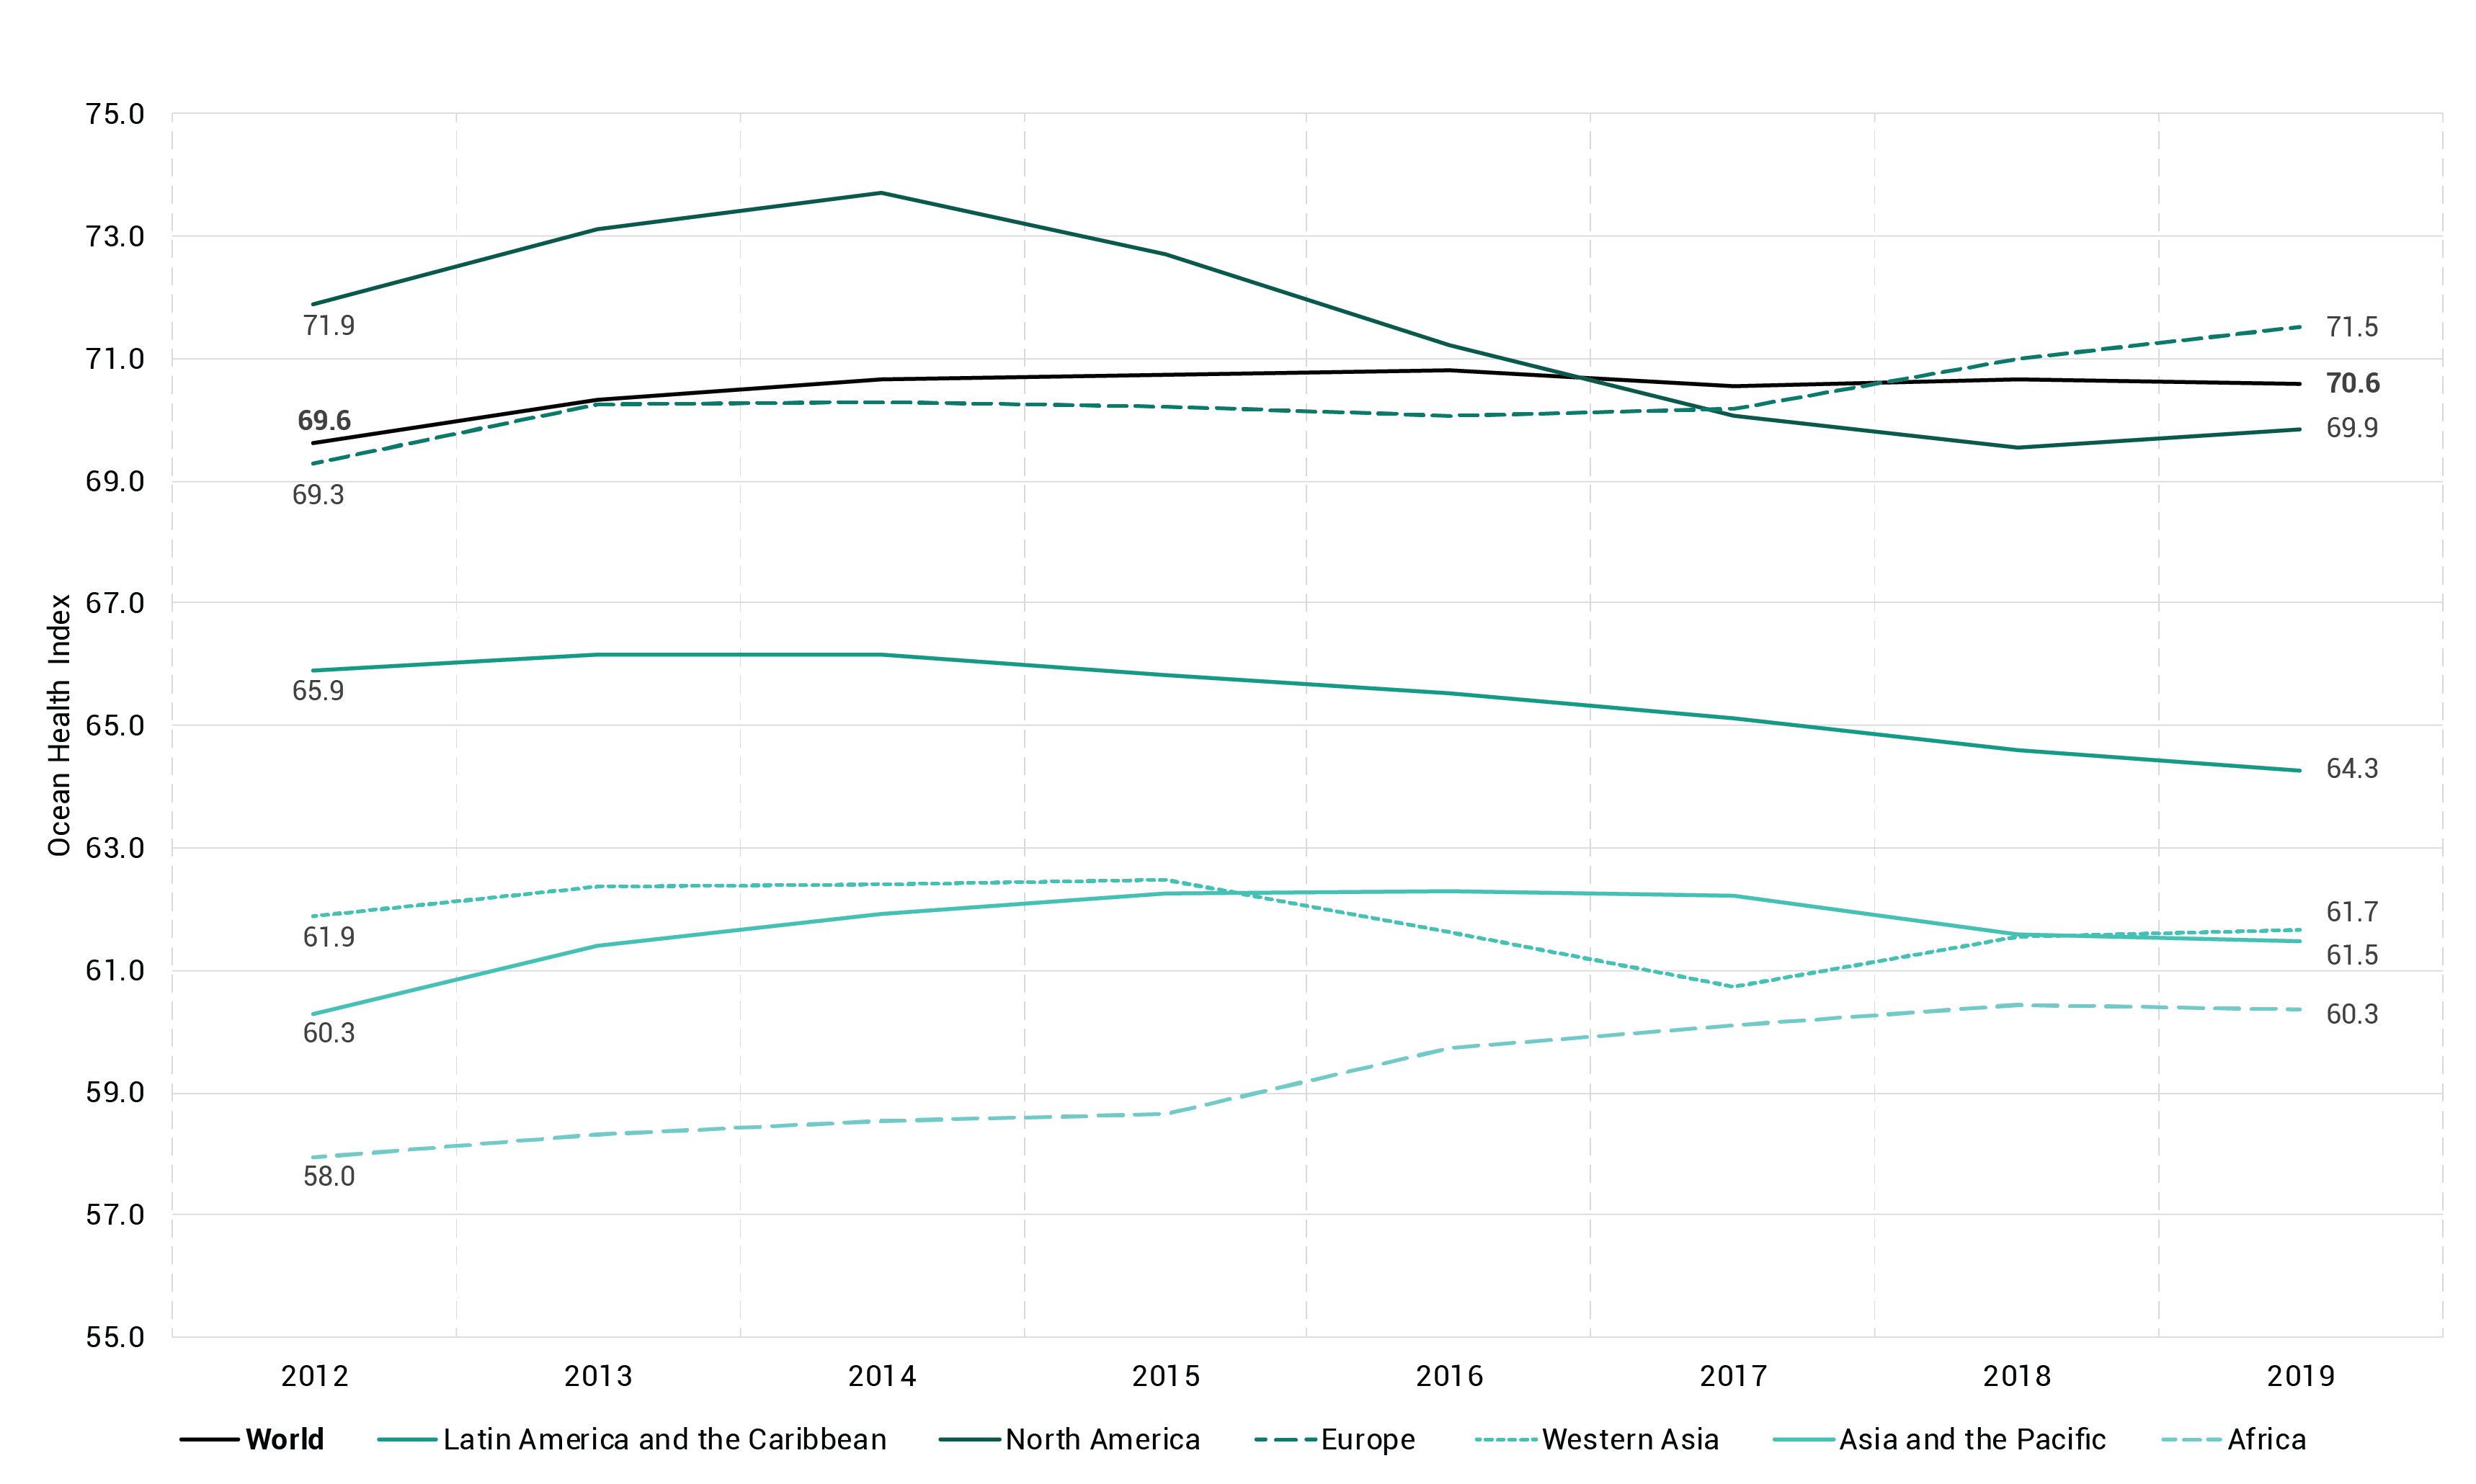
The Ocean Health Index (OHI) is a comprehensive framework for measuring the health of the oceans from a global to a local perspective. It comprises several goals covering the status, trends and resilience of the world´s oceans and recognizes the range of benefits to humans that healthy oceans can provide sustainably. The OHI measures progress on food provision, artisanal fishing opportunities, natural products, carbon storage, coastal protection, livelihoods and economies, tourism and recreation, sense of place, clean waters and biodiversity. Thus it is incrementally linked to the biological, physical, economic and social dimensions of sustainable development.
The Clean Waters goal captures the degree to which local waters are unpolluted by human-made causes. It uses many components related to the status, pressures and resilience of oceans to measure contamination by chemicals, excessive nutrients, human pathogens and trash (Ocean Health Index 2022). For this goal there was a global score of 70 out of 100 from 2015 to 2019, while the overall OHI indicates a global score of 69 out of 100 in 2022 (Ocean Health Index 2022, n.d.).
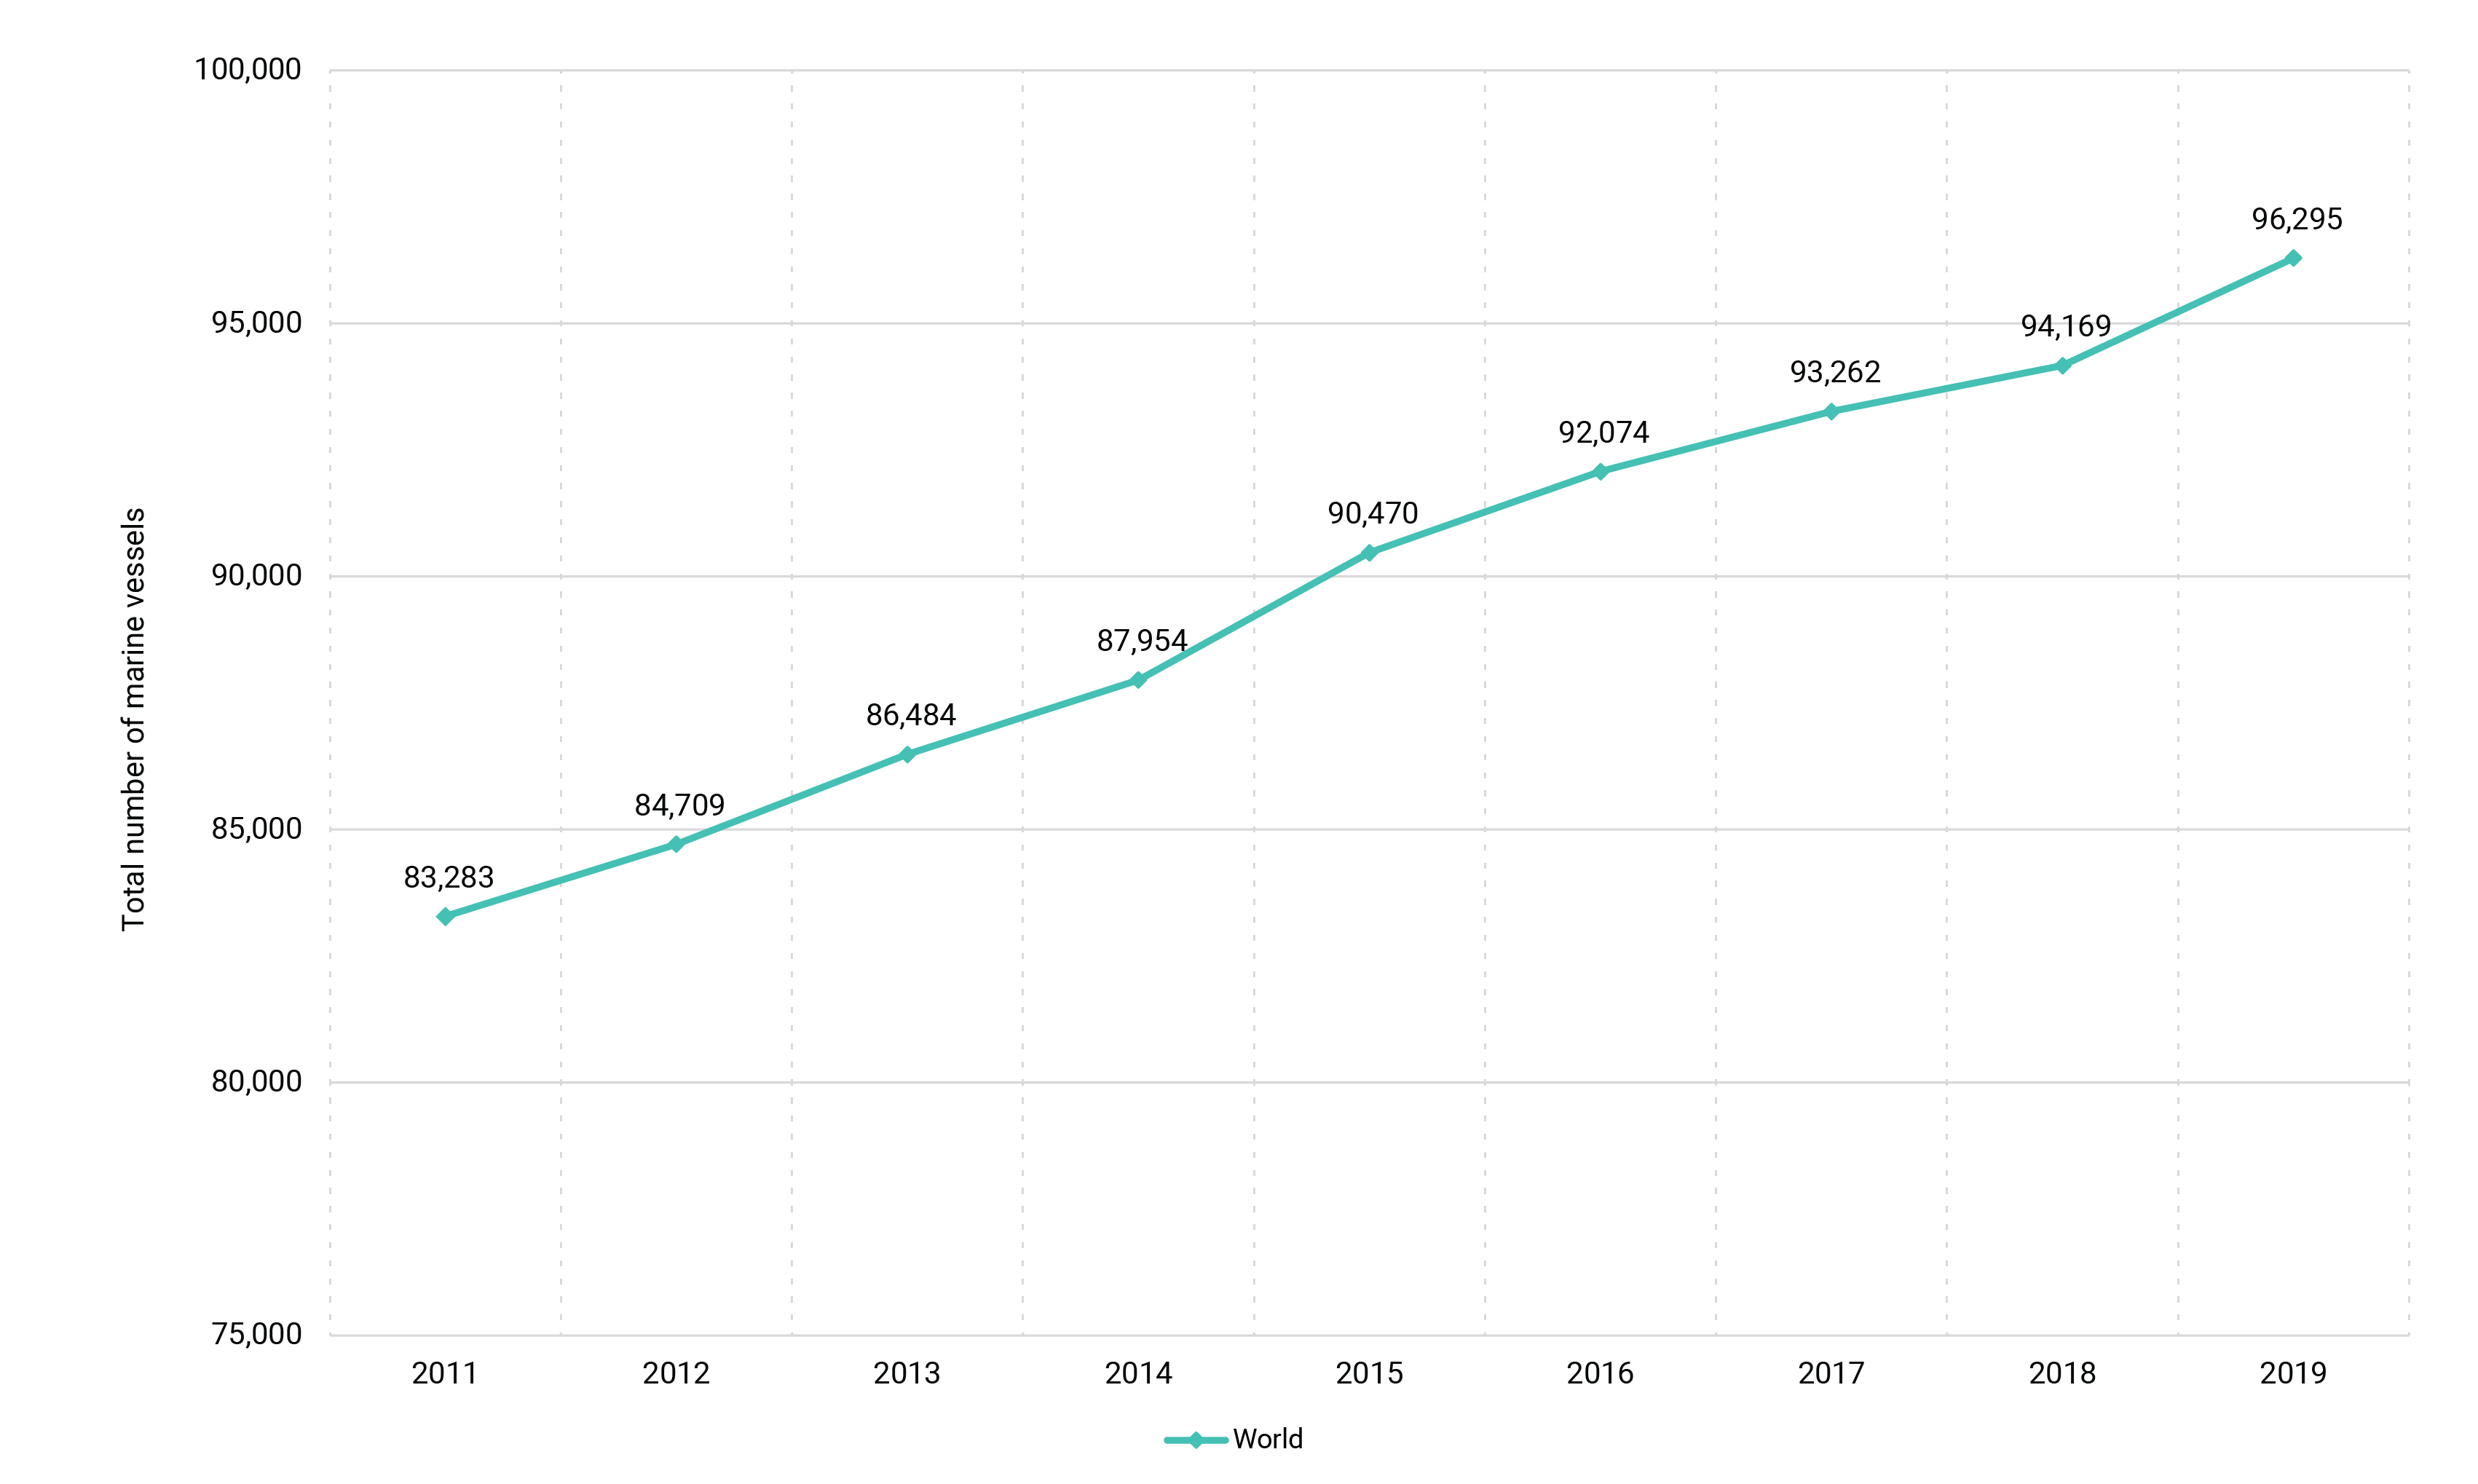
The steadily increasing number of marine vessels presents challenges related to pollution, biodiversity loss, and threats to human and ecosystem health. These vessels generate large pollutant emissions at sea, as well as during loading and unloading, including NOX, N2O, SOX, CO2, black carbon and particulate matter (Lee, Kwon and Ruan 2019; Jonson et al. 2020; Oceana Europe n.d.).
Overall, the Clean Waters goal has increased modestly since 2012. The global score has, on average, increased by one-fifth of a point every year since 2012. This increase is likely due to a decrease in human derived pathogens in waterways (more people have access to improved sanitation facilities), and a decrease in land-based nitrogen input associated with manure and fertilizer application. Although significant change cannot be expected on a yearly basis, stagnation during a five-year period indicates that further action is needed.
Comprehensive assessment of ocean health is critical to assess progress towards meeting conservation objectives while maintaining sustainable use. Meeting these objectives is likely to become more challenging in view of greater climate change impacts, greater pollution loads from economic activities, overharvesting, and increasing conflicts among users. At the same time, ocean health is key to meeting the Sustainable Development Goals (United Nations 2022).
DPSIR Indicator Framework: Land and Soil Pollution
See the data below
Insufficient global/regional data for analysis.
See detailed information▼ or Search the most up to date data
Indicator 11.3.1 is under Goal 11: “Make cities and human settlements inclusive, safe, resilient and sustainable,” Target 11.3: “By 2030, enhance inclusive and sustainable urbanization and capacity for participatory, integrated and sustainable human settlement planning and management in all countries.” Although the methodology for calculating this indicator exists, sufficient data are not yet available. Therefore, an analysis of current trends is not possible.
The ratio of the land consumption rate to the population growth rate measures land use efficiency. It is intended to answer the question whether remaining undeveloped urban land is being developed at a rate that is less than, or greater than, the prevailing rate of population growth. Globally, land cover is altered by direct human use and habitat loss, often linked to land clearance for food production, which is the major driver of biodiversity loss (Benton et al. 2021).
Wastewater discharges can adversely affect not only freshwater ecosystems (see the section on freshwater pollution in Part 2), but also marine and coastal ones. Inadequate wastewater treatment increases the risk of human exposure to infectious disease. It can also result in releases of pollutants that degrade the environment, with adverse effects on marine life and the aquatic food chain (Bonin-Font et al. 2018).
Suburban expansion, which increases the extent of urban land cover, tends to occur significantly more rapidly than urban expansion (UNSD 2021) and is accompanied by adverse impacts on adjacent soil ecosystems. Agricultural activities including crop and livestock farming, forest harvesting, and urban and suburban construction all intensify soil pollution loads (Benton et al. 2021). Point-source pollution (primarily from urban sewage sludge and wastewater) loaded with heavy metals is the predominant limiting factor for the development of biogeocenosis in soil ecosystems (Dregulo and Bobylev 2021). Increased urban land consumption is inevitably accompanied by infrastructure development with concerning accumulations of heavy metals, polycyclic aromatic hydrocarbons (PAHs) and other pollutants in the soil (Rodríguez-Eugenio, McLaughlin and Pennock 2018).
Insufficient global/regional data for analysis.
See detailed information▼ or Search the most up to date data
Indicator 12.4.2(b) is under SDG Goal 12: “Ensure sustainable consumption and production patterns”, Target 12.4: “By 2020, achieve the environmentally sound management of chemicals and all wastes throughout their life cycle, in accordance with agreed international frameworks, and significantly reduce their release to air, water and soil in order to minimize their adverse impacts on human health and the environment.”
Data for this indicator are reported by countries through the United Nations Statistics Division (UNSD)/UNEP Joint Questionnaire on Environment Statistics, waste section (UNSD 2023b). Data are available from 24 countries, which does not allow for regional or global aggregation. Existing data indicate an increase in the amount of hazardous waste going to landfill in 11 countries between 2015 and 2019, while six countries reported a decrease.
Waste generation has continued to increase in the past few decades, indicating a clear relationship between the volume of waste created per capita and income levels (World Bank 2023). Trends in hazardous waste generation show shifts from higher-income towards low- and middle-income countries where management of waste streams may be less efficient and less safe (Ferronato and Torretta 2019; Yadav and Vallero 2022). Leachate originating from hazardous waste landfills is toxic. It contains high concentrations of harmful pollutants such as refractory organics, ammoniacal nitrogen, heavy metals, inorganic salts and organochlorines (Gautam and Kumar 2021). Leachate adversely affects ecosystems such as groundwater and freshwater bodies, soil properties, and human health via exposure to extensive loads of harmful pollutants (Xu et al. 2018).
Waste reduction at source, as a result of policy prioritization, eases pressures created by landfilling of hazardous waste. It can serve as the foundation for prevention, reuse, recycling and recovery. Electronic waste (e-waste) is a growing source of pollution, the result of higher consumption rates for electrical and electronic equipment along with short life cycles and few repair options. In 2019 the world generated 53.6 megatons (MT) of e-waste, some 20 per cent more than in 2014 (Forti et al. 2020). E-waste contains toxic additives and other hazardous substances. Only about 17 per cent of this waste is known to be recycled, and growth in recycling is lagging behind increases in waste generation (Forti et al. 2020).
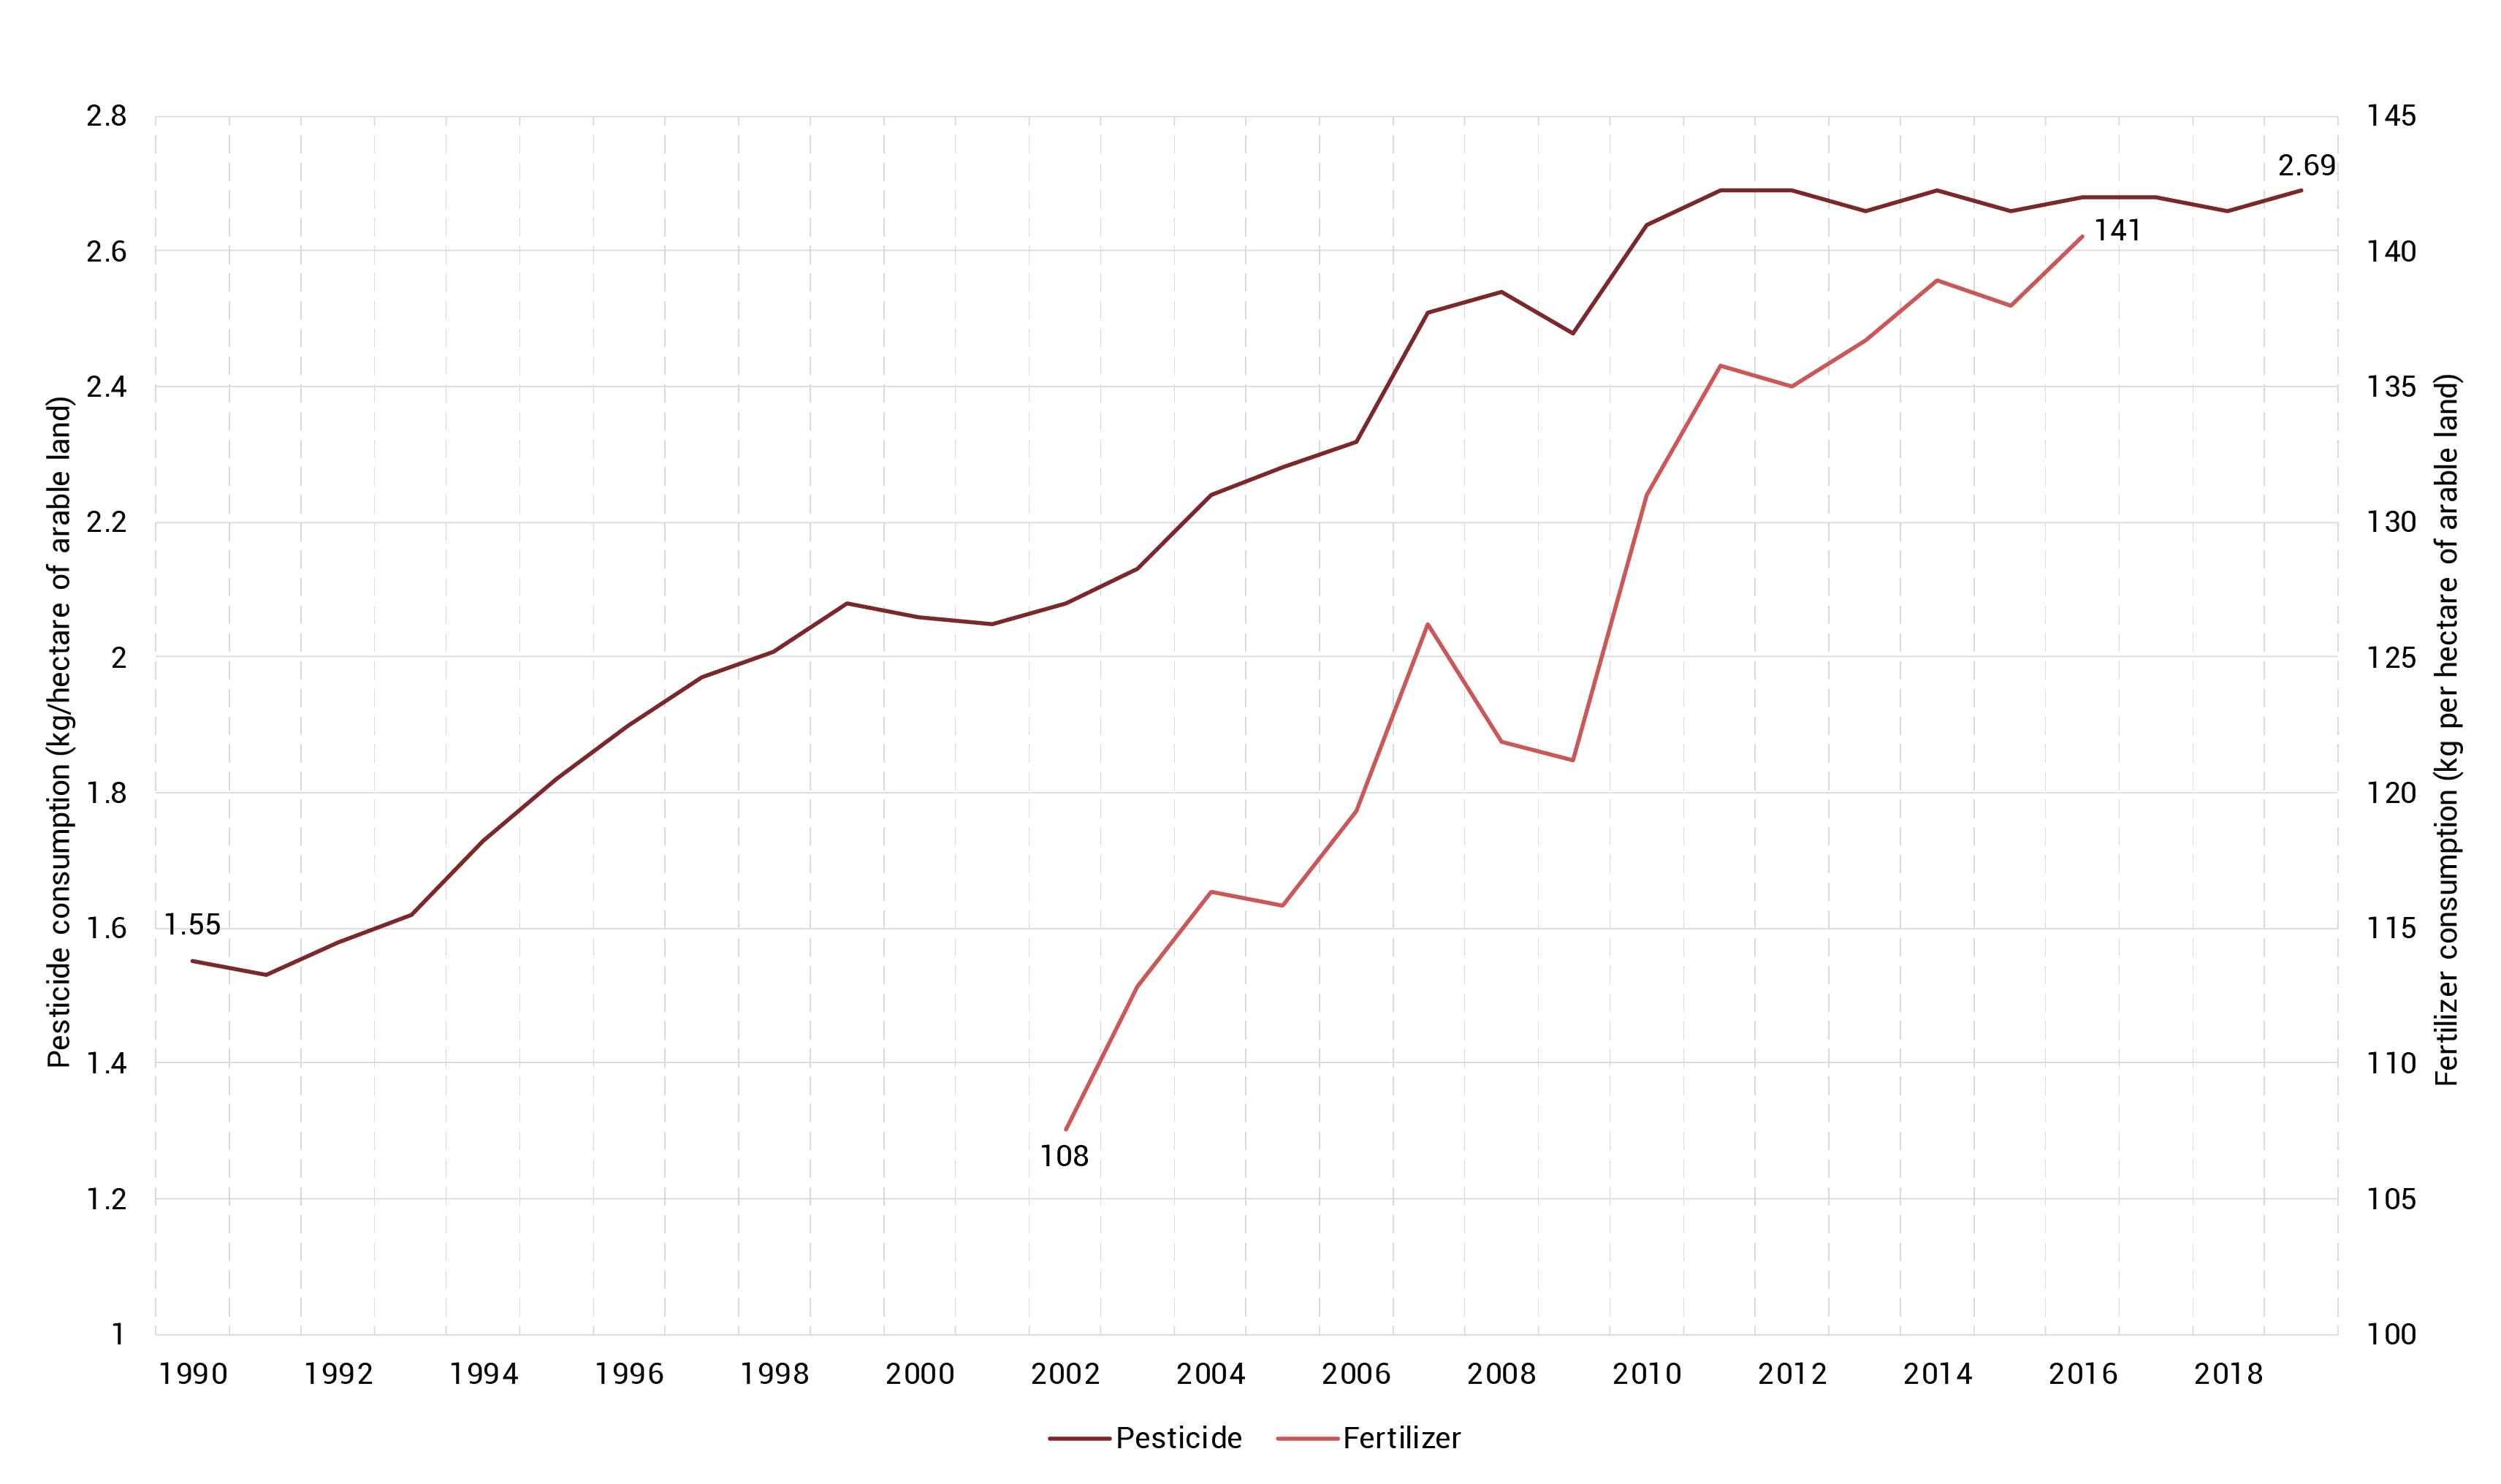
See detailed Information▼ or See the data source
Fertilizer consumption measures the number of plant nutrients used per unit of arable land. It includes nitrogenous (both synthetic and organic), phosphate and potash fertilizers. Inefficient and excess use of fertilizers has adverse impacts on soil ecosystems, particularly in the case of long-term applications, causing soil acidification, nutrient over-enrichment, increased availability of heavy metal ions and deterioration of the rhizosphere micro-ecological environment (Lin et al. 2019).
Global fertilizer consumption (kg per hectare of arable land) showed a steady upward trend from 108 kg in 2002 to 141 kg in 2018, a 30 per cent increase over 15 years. High rates of fertilizer consumption (and pesticide use) in crop and livestock production can be explained by a range of socioeconomic factors, such as the increasing global population and concurrent expanding consumption of plant and animal-based food products (Sagasta et al. 2017), as well as the existence of international programmes and other incentives to use these products.
High rates of consumption are also due to over-fertilization and disproportionate use of fertilizers in some world regions. Furthermore, livestock production is often geographically separated from crop production; this decoupling of the biogeochemical/biogeophysical cycling of carbon, water, nitrogen, phosphorus and sulphur can cause increased emissions of nitrous oxide (N2O) and ammonia (CH4), eutrophication and contamination of water resources, degradation of rangelands, and loss of biodiversity (Lal 2020).
Global pesticide usage increased steadily from 1990 to 2018. In 1990, 1.55 kg of pesticides per hectare of arable land were applied to soils. In 2018 this amount had increased by about 1 kg/ha, over 60 per cent. These trends result in greater diffusion of pollutants, with serious consequences for soil and freshwater ecosystems, human health and economies.
The average quantity of pesticides used per hectare remained stable between 2010 and 2018, having grown significantly during the two previous decades (Secretariat of the Convention on Biological Diversity 2020). Nevertheless, pollution due to the use of pesticides has remained at a level that has a detrimental impact on biodiversity. Pesticide usage varies widely across regions, with the quantity per hectare in Asia and the Americas exceeding that in Africa more than ten-fold (Secretariat of the Convention on Biological Diversity 2020).
Pesticides include fungicides, bactericides, herbicides, insecticides, rodenticides, plant growth regulators and several other products. Their purpose is to reduce the adverse impacts of pests such as insects, as well as those of diseases and weeds, to protect crop yields. Pesticides do not just kill pests, however. They also kill non-target organisms (Zaller and Brühl 2019; Ali et al. 2021; UNEP 2022b). Even when these products are not lethal, they may still cause reduced movement, increase vulnerability to predation and/or affect orientation, for example during bird migration (Convention on Migratory Species 2014a, b; Eng et al. 2017; Pennisi 2019).
Pesticides have acute and long-term impacts on human health; it is estimated that 385 million cases of non-fatal unintentional pesticide poisoning occur every year, with approximately 11,000 deaths (UNEP 2022b). Stinging eyes, rashes, blisters, skin irritation, blindness, nausea, dizziness, diarrhoea and sometimes death are among the acute adverse effects of pesticide exposure (Shah 2020).
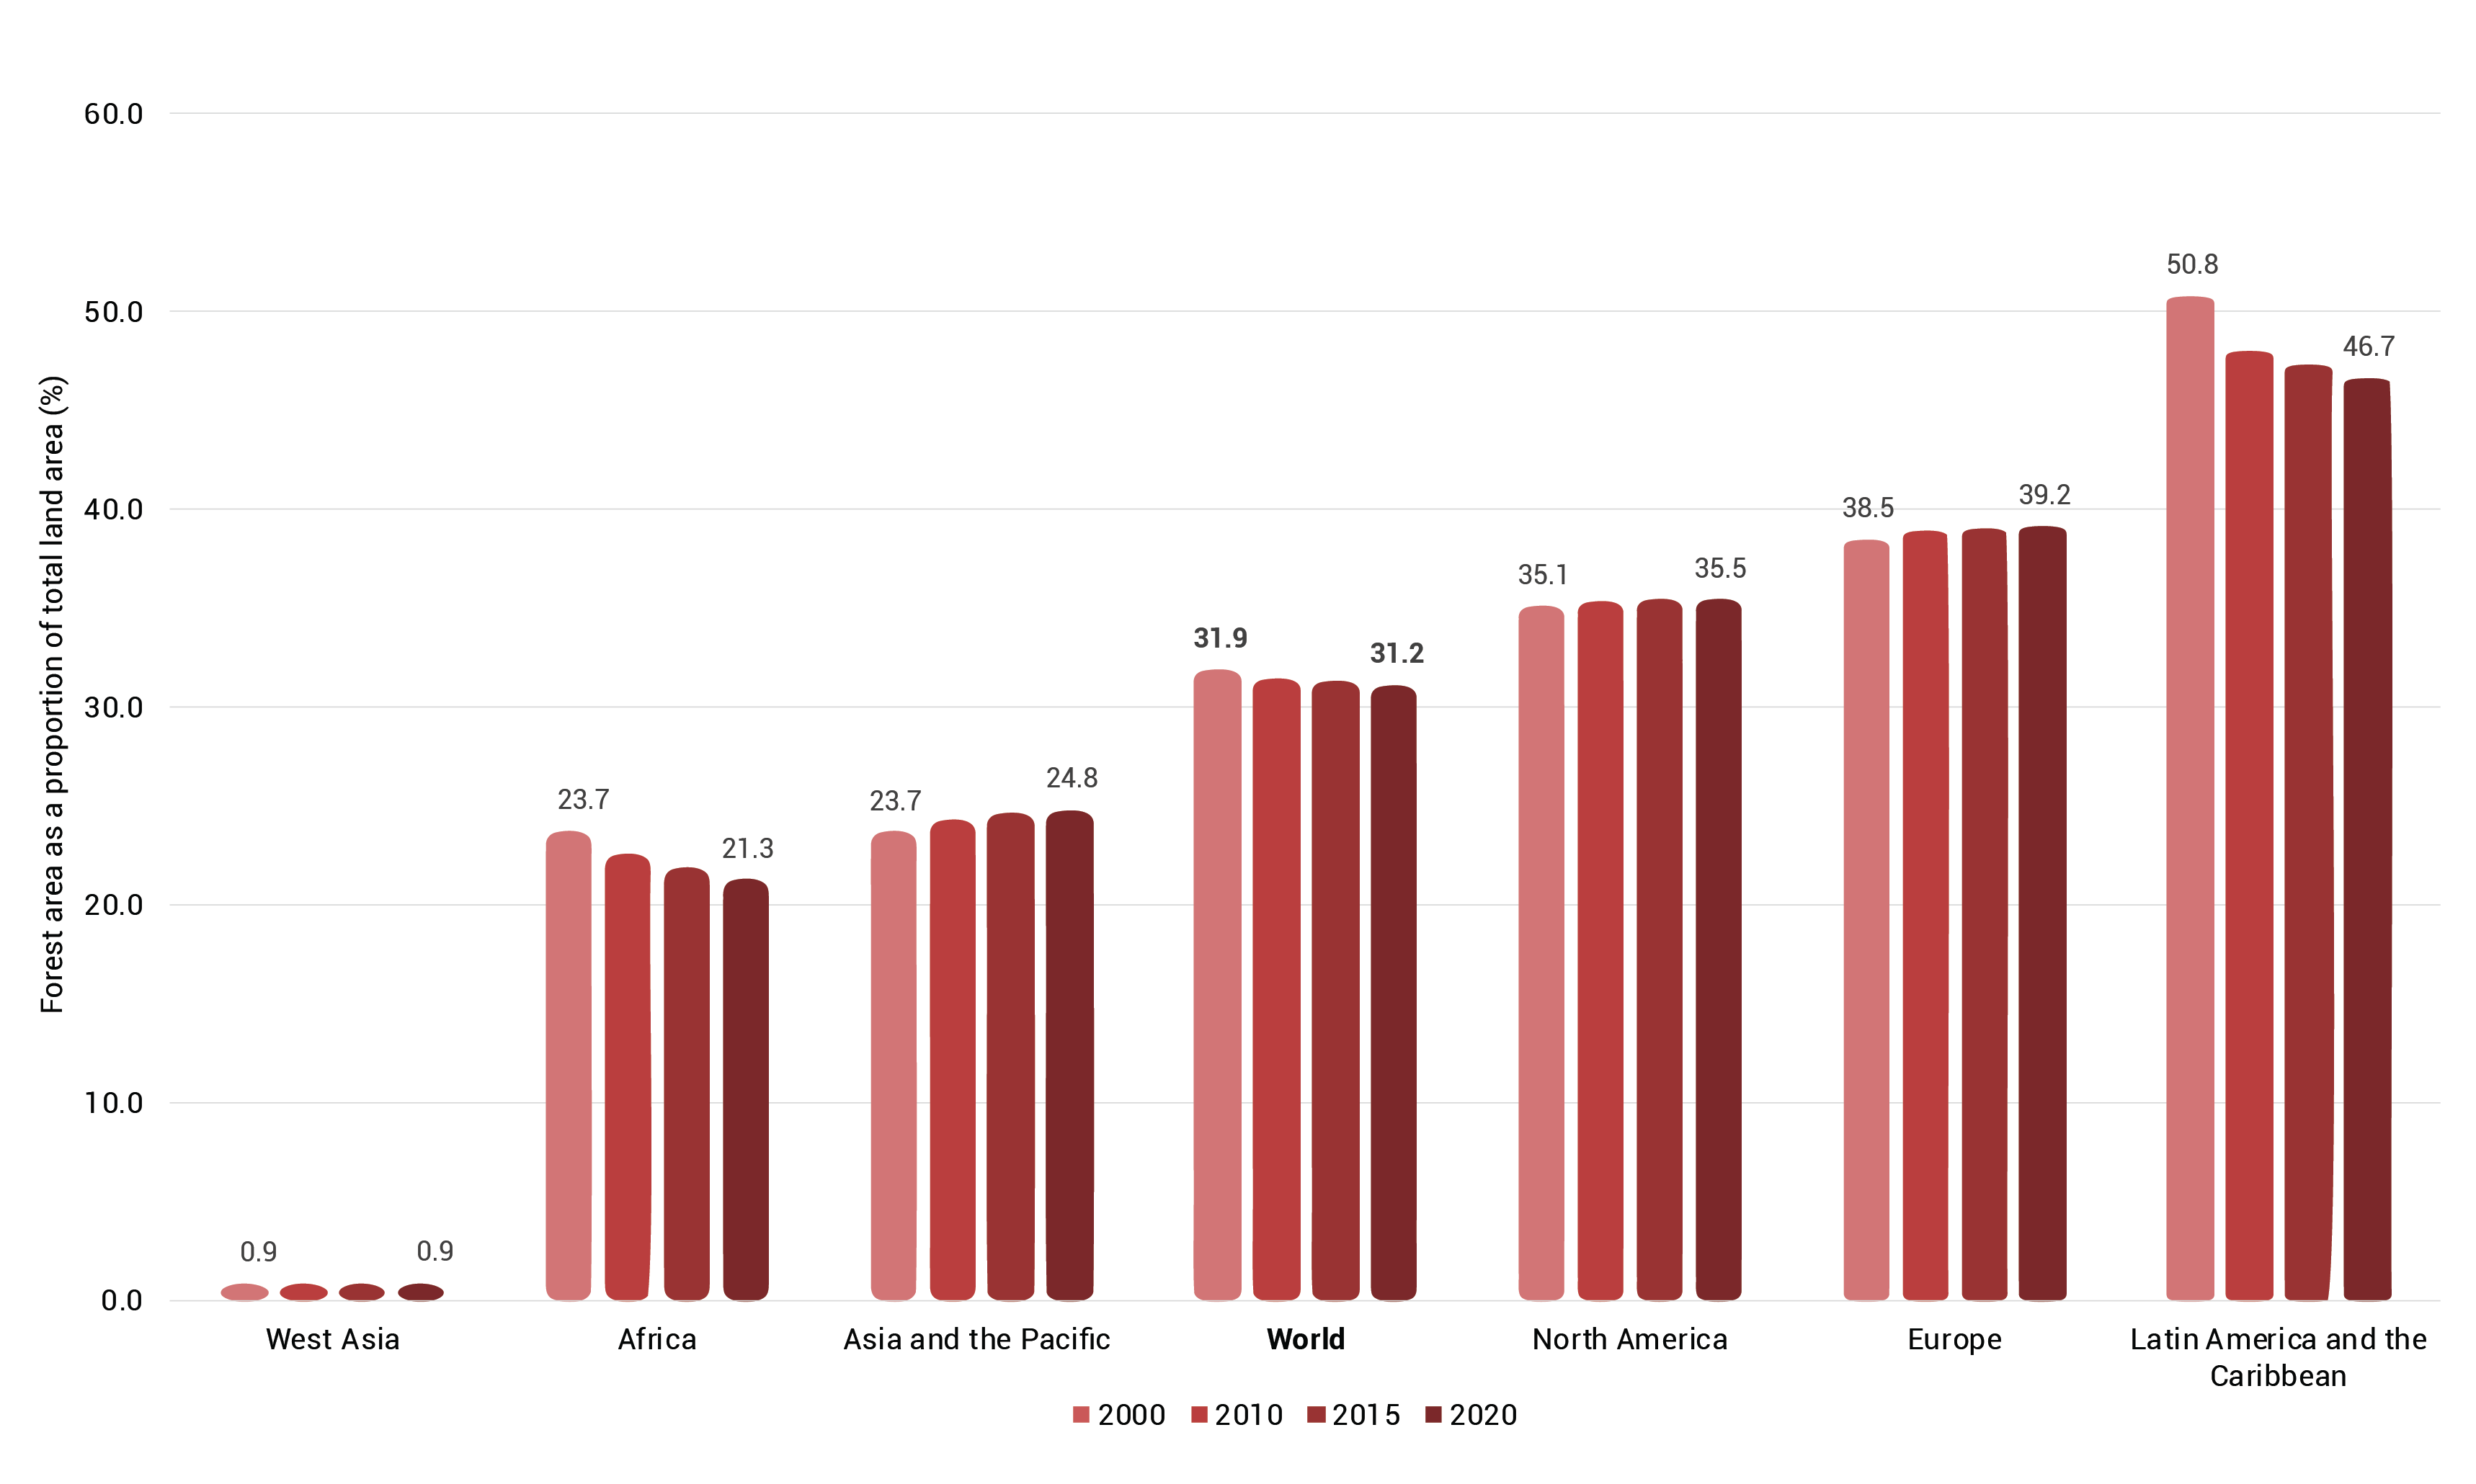
See detailed information▼ or Search the most up to date data
Indicator 15.1.1 is under SDG Goal 15: “Protect, restore and promote sustainable use of terrestrial ecosystems, sustainably manage forests, combat desertification, and halt and reverse land degradation and halt biodiversity loss”, Target 15.1: “By 2020, ensure the conservation, restoration and sustainable use of terrestrial and inland freshwater ecosystems and their services, in particular forests, wetlands, mountains and drylands, in line with obligations under international agreements”.
Data on forest area as a proportion of total land area indicate that between 2000 and 2020 there was a decreasing trend in Africa, in Latin America and the Caribbean, and globally; there was an increasing trend in Asia and the Pacific, but little change in West Asia, North America and Europe. Globally, forest area decreased from 31.9 per cent to 31.2 per cent, a net loss of almost 100 million hectares (United Nations 2022). In Latin America and the Caribbean forest area as a proportion of total land area decreased by almost 5 per cent, with tremendous impacts on inherent biodiversity, ecosystems and human health (FAO and UNEP 2020, 2022).
According to the Global Forest Resources Assessment (FAO 2020a), the rate of global deforestation was about 15 million hectares per year in the decade following 2000, 12 million hectares per year between 2010 and 2015, and around 10 million hectares per year between 2015 and 2020. The deforestation rate fell by 20 per cent in the five years following the establishment of the Aichi Biodiversity Targets in 2010, with an additional but smaller reduction (17 per cent) in the second half of the decade.
While deforestation continues to decline, the rate of decline is slowing. There have also been signs of a reversal in some regions, such as the Brazilian Amazon (Secretariat of the Convention on Biological Diversity 2020). Between 2013 and 2019 it has been estimated that at least 69 per cent of tropical forest clearance for agriculture was carried out in violation of national laws or regulations (Dummett et al. 2021).
In the past decade Africa has replaced South America as the continent with the highest rate of net forest loss. This rate has increased in Africa during each decade since 1990, while since 2010 the rate in South America has roughly halved compared with 2000-2010 (FAO 2020a).
Forest protection continues to entail complex challenges as a result of both overexploitation and agricultural expansion, which act as the main drivers of deforestation, forest fragmentation and associated biodiversity losses (FAO 2020a). Replacing forests with agricultural land impacts soil ecosystems. Agriculture is usually intensive and accompanied by fertilizer and pesticide fertilizer use. Deforestation negatively impacts soil properties through soil acidification and reduced soil organic carbon content, biological properties and biodiversity, increasing the soil’s vulnerability to pollutants (Nunes et al. 2020).
The resilience of soil ecosystems, and their capacity to adapt to future changes, depend on their biodiversity. Soil organisms provide a wide range of ecosystem services, including transforming organic and inorganic compounds to enhance nutrient availability, enhancing litter decomposition, modifying soil porosity, and transporting water and gas transport (FAO, ITPS, Global Soil Biodiversity Initiative, Convention on Biodiversity and European Commission 2020).
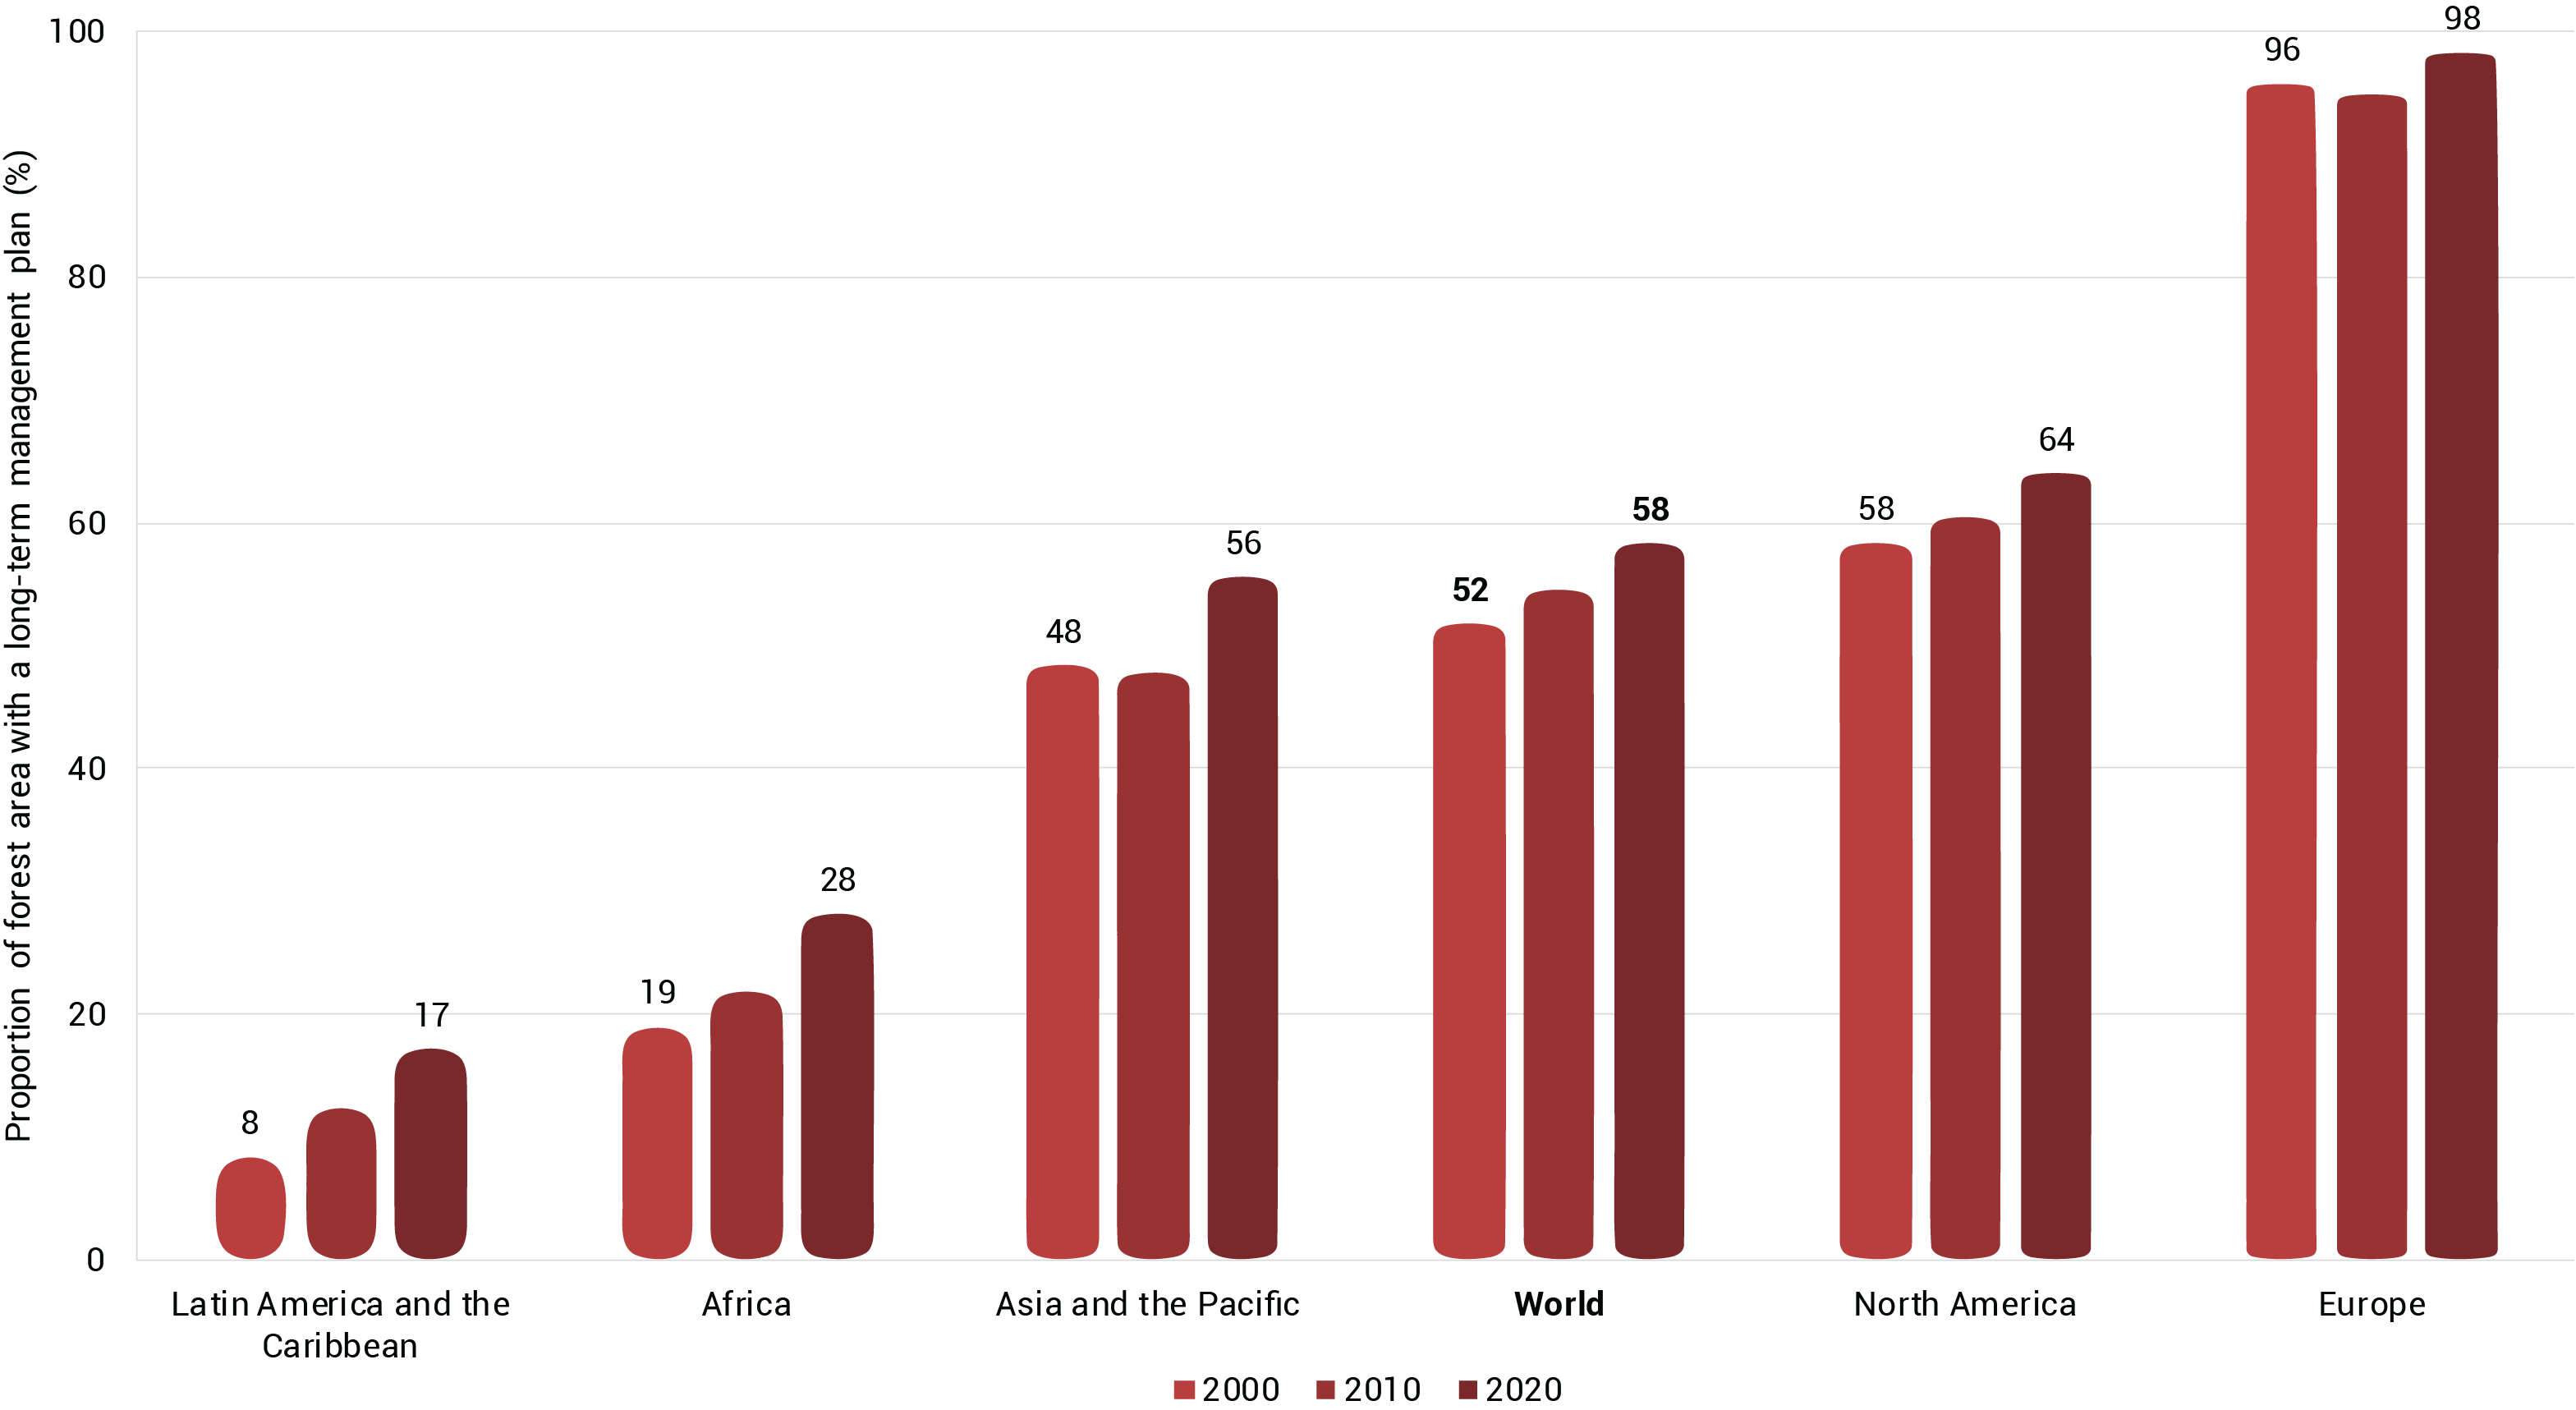
See detailed information▼ or Search the most up to date data
Indicator 15.2.1 is under Target 15.2: “By 2020, promote the implementation of sustainable management of all types of forests, halt deforestation, restore degraded forests and substantially increase afforestation and reforestation globally”, Goal 15: “Protect, restore and promote sustainable use of terrestrial ecosystems, sustainably manage forests, combat desertification, and halt and reverse land degradation and halt biodiversity loss.”
All regions are experiencing a steady increase in the proportion of forest area covered by long-term forest management plans. The highest proportion is in Europe (98 per cent in 2020). Globally almost 60 per cent of forests were covered by such a plan in 2020, an increase of almost 7 per cent since 2000. The lowest proportion is in Latin America and the Caribbean (17 per cent in 2020)
Sustainable forest management (SFM) is essential to maintain healthy soils. When successfully applied, it can ensure positive conservation and socioeconomic development outcomes (FAO and UNEP 2020). SFM is “the stewardship and use of forests and forest lands in a way, and at a rate, that maintains their biological diversity, productivity, regeneration capacity, vitality and their potential to fulfil, now and in the future, relevant ecological economic and social functions, at local, national and global levels, and that does not cause damage on other ecosystems” (FAO n.d.). Although pollution is not explicitly mentioned in this definition, the function that forests fulfil is defined as the set of processes resulting from interactions among biotic and abiotic components of the ecosystem. Four classes of processes are important: processes that affect the rate and total quantity of energy; processes that affect the rate and total quantity of nutrient cycling; processes that influence ecosystem services important to human beings; and processes that affect the life and diversity of living organisms over both short and long-time periods (FAO n.d.).
Actions to safeguard forests and combat deforestation are crucial if soil properties and ecosystem functioning are to be maintained. SFM assists community resilience against human-induced pressures and natural pressures by climate change and eases their impacts (Rodríguez-Eugenio, McLaughlin and Pennock 2018). For instance, placing a forest area under an independently verified forest management certification scheme, one of the sub-indicators of SDG 15.2.1 (UNSD 2022c), has influenced farmers in Viet Nam to use fertilizer and pesticides efficiently, which in turn leads to reduced soil pollution (Di Girolami 2019). SFM ensures important environmental services from forests, such as carbon sequestration and water, soil and biodiversity conservation. It also contributes to income and employment for a significant share of the global population (Riccioli et al. 2020). Moreover, SFM should define maximal amounts of biomass to be harvested to prevent excess nutrient removal and concurrent harm for forest soils (Sotirov et al. 2017).
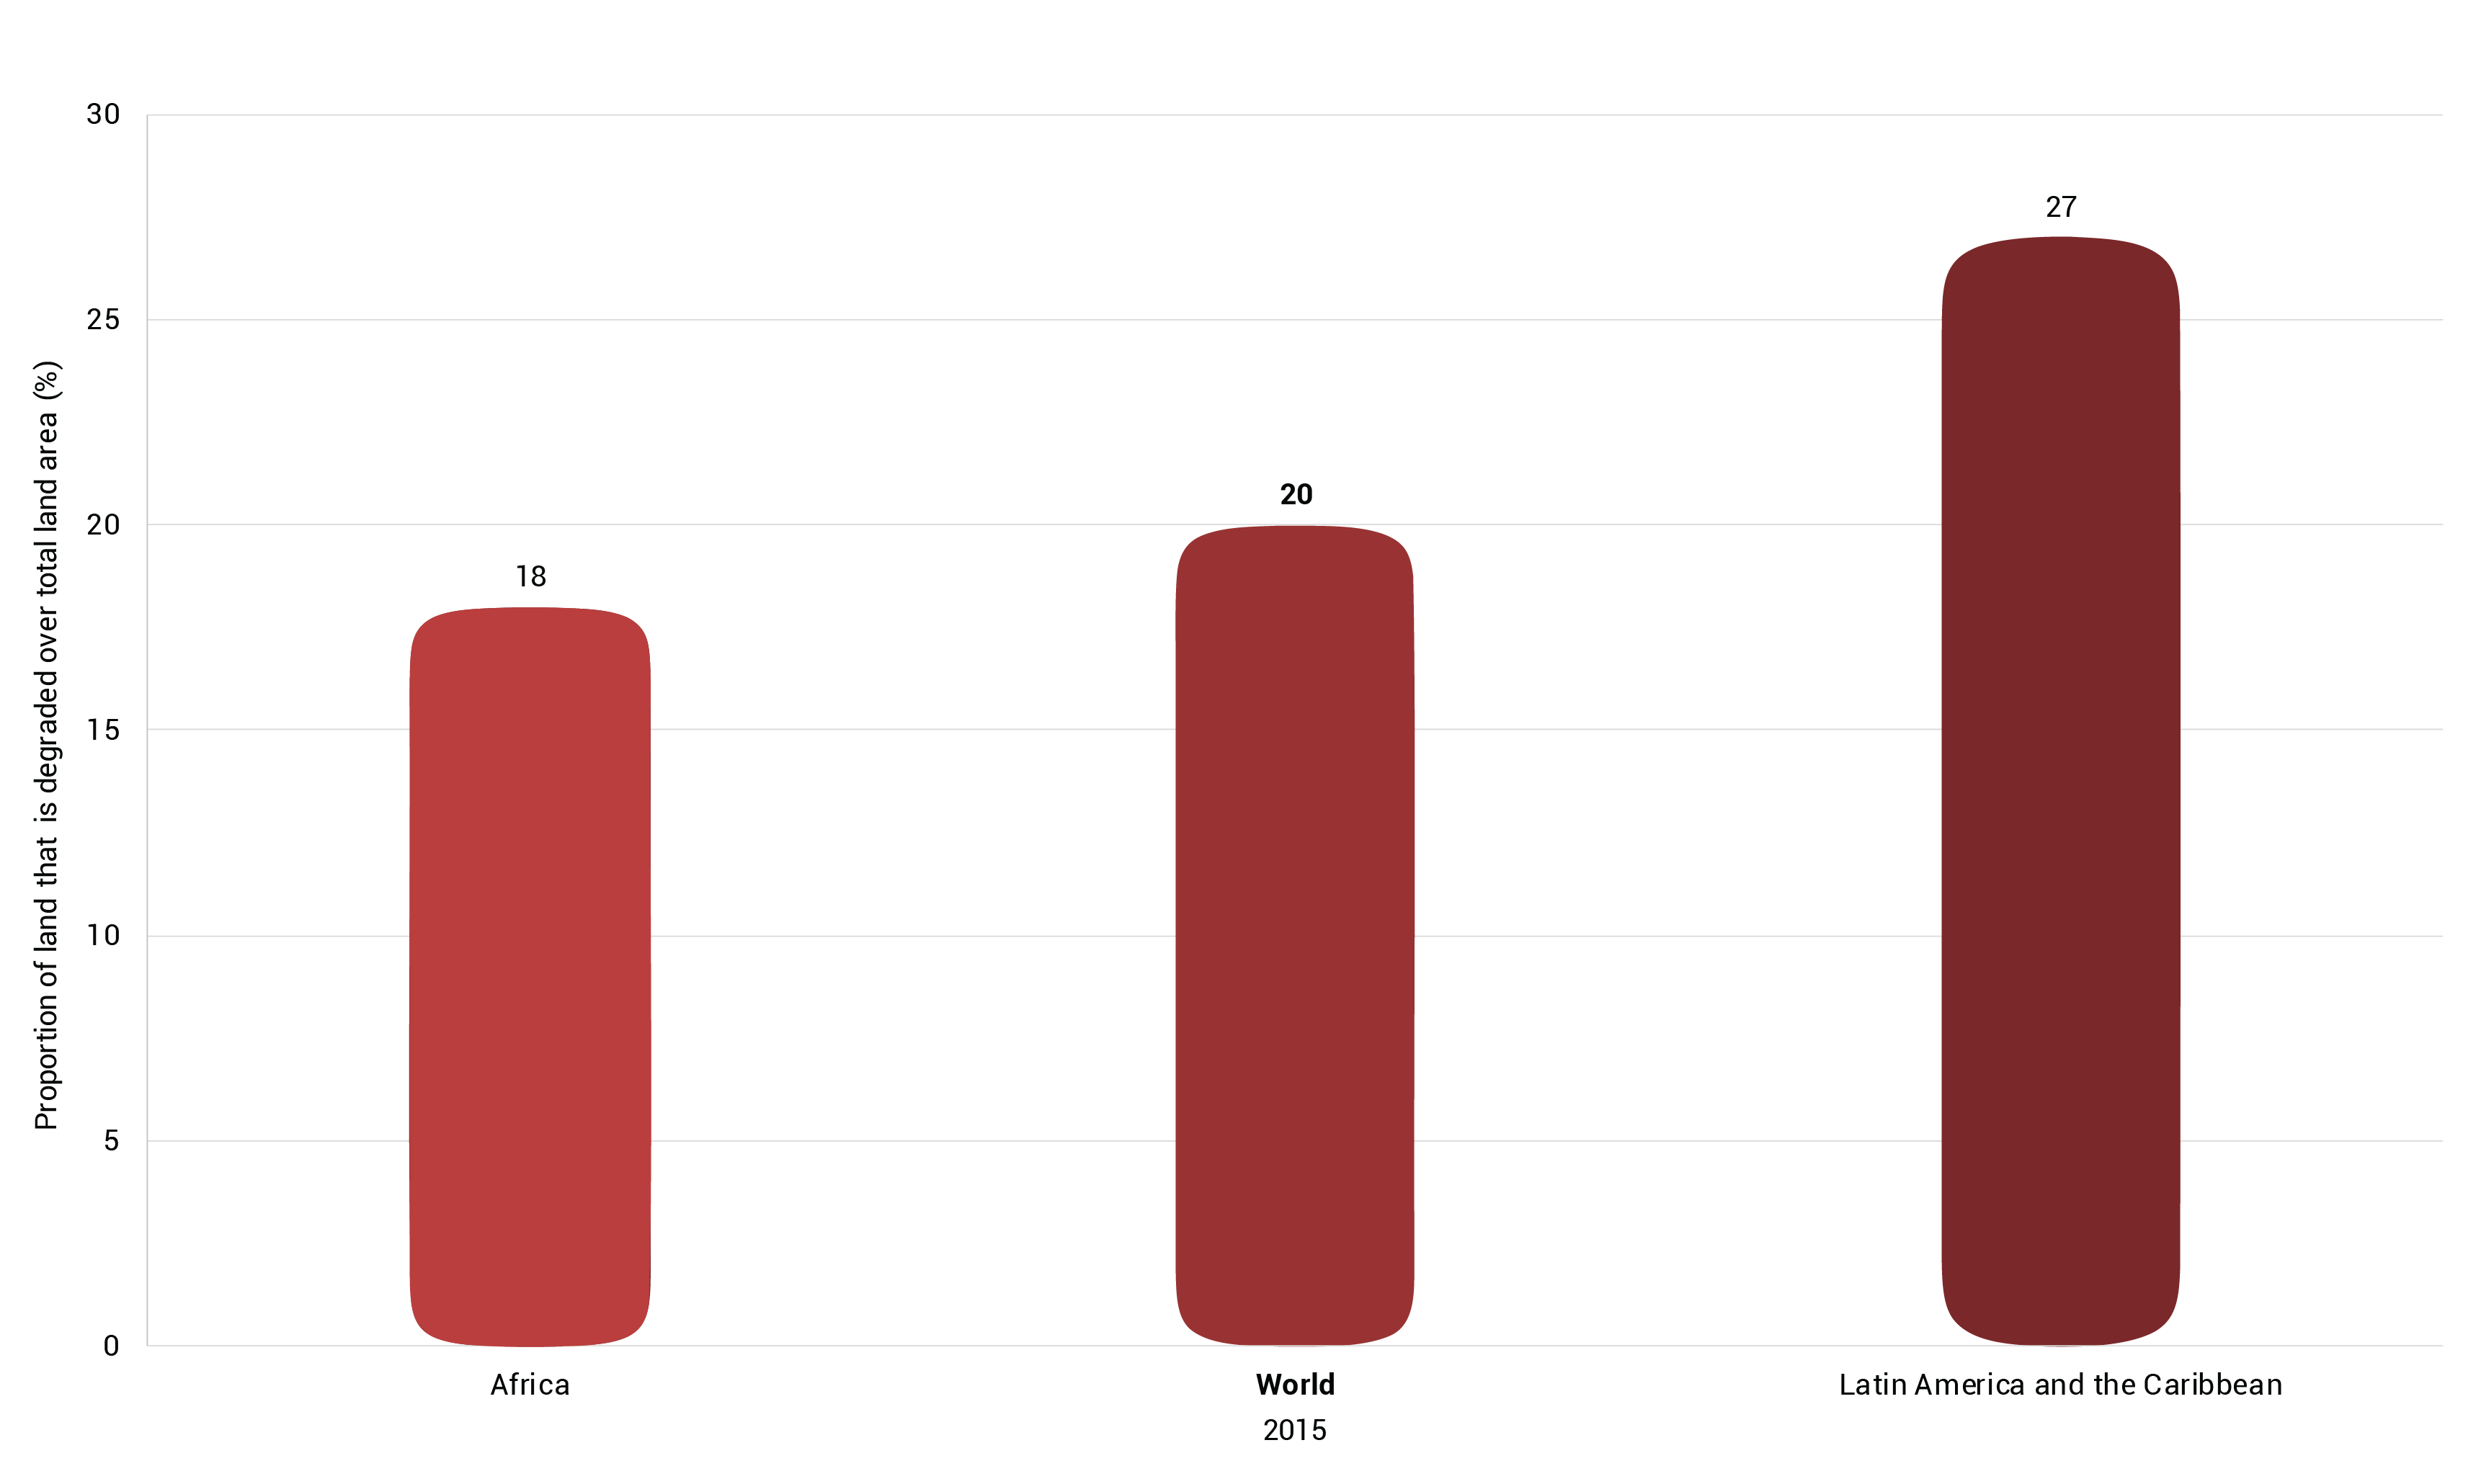
See detailed information▼ or Search the most up to date data
Indicator 15.3.1 is under SDG 15, “Protect, restore and promote sustainable use of terrestrial ecosystems, sustainably manage forests, combat desertification, and halt and reverse land degradation and halt biodiversity loss”, Target 3: “By 2030, combat desertification, restore degraded land and soil, including land affected by desertification, drought and floods, and strive to achieve a land degradation-neutral world.”
Data on forest area as a proportion of total land area indicate that between 2000 and 2020 there was a decreasing trend in Africa, in Latin America and the Caribbean, and globally; there was an increasing trend in Asia and the Pacific, but little change in West Asia, North America and Europe. Globally, forest area decreased from 31.9 per cent to 31.2 per cent, a net loss of almost 100 million hectares (United Nations 2022). In Latin America and the Caribbean forest area as a proportion of total land area decreased by almost 5 per cent, with tremendous impacts on inherent biodiversity, ecosystems and human health (FAO and UNEP 2020, 2022).
In 2015 land degraded globally was about 20 per cent of total land area. In Latin America and the Caribbean and Asia and the Pacific the percentage was higher than the world average at some 27 per cent. The smallest percentage of degraded land was in West Asia at around 18 per cent.
Population growth, economic expansion and increasing demand for raw materials have contributed to land degradation in the last few decades. Intensification of agricultural practices, mining and logging, and growth in the extent of urban and rural areas are drivers of land degradation. It is accompanied by unsustainable agricultural practices such as open grazing, inadequate soil conservation, and increasing use of pesticides and fertilizers that exhaust crucial soil nutrients and organic carbon content (Mirzabaev et al. 2016; UNCCD 2022a).
Forests and land degradation are closely related, as deforestation for mining and logging or for human settlements adversely affects inherent soil properties (FAO and UNEP 2020, 2022). Loss of vegetation cover can alter soil properties such as soil pH, temperature and soil organic carbon (SOC) content, which can affect contaminants’ fate in soil (Rodríguez-Eugenio, McLaughlin and Pennock 2018).
In 2015 the UN Convention to Combat Climate Change (UNCCD) invited country parties to “formulate voluntary targets to achieve Land Degradation Neutrality (LDN) in accordance with their specific national circumstances and development priorities”. The UNCCD reports that 129 countries have committed to set LDN targets; more than 100 countries have already set targets, and many have secured high-level government commitment to achieve LDN (UNCCD 2022b).
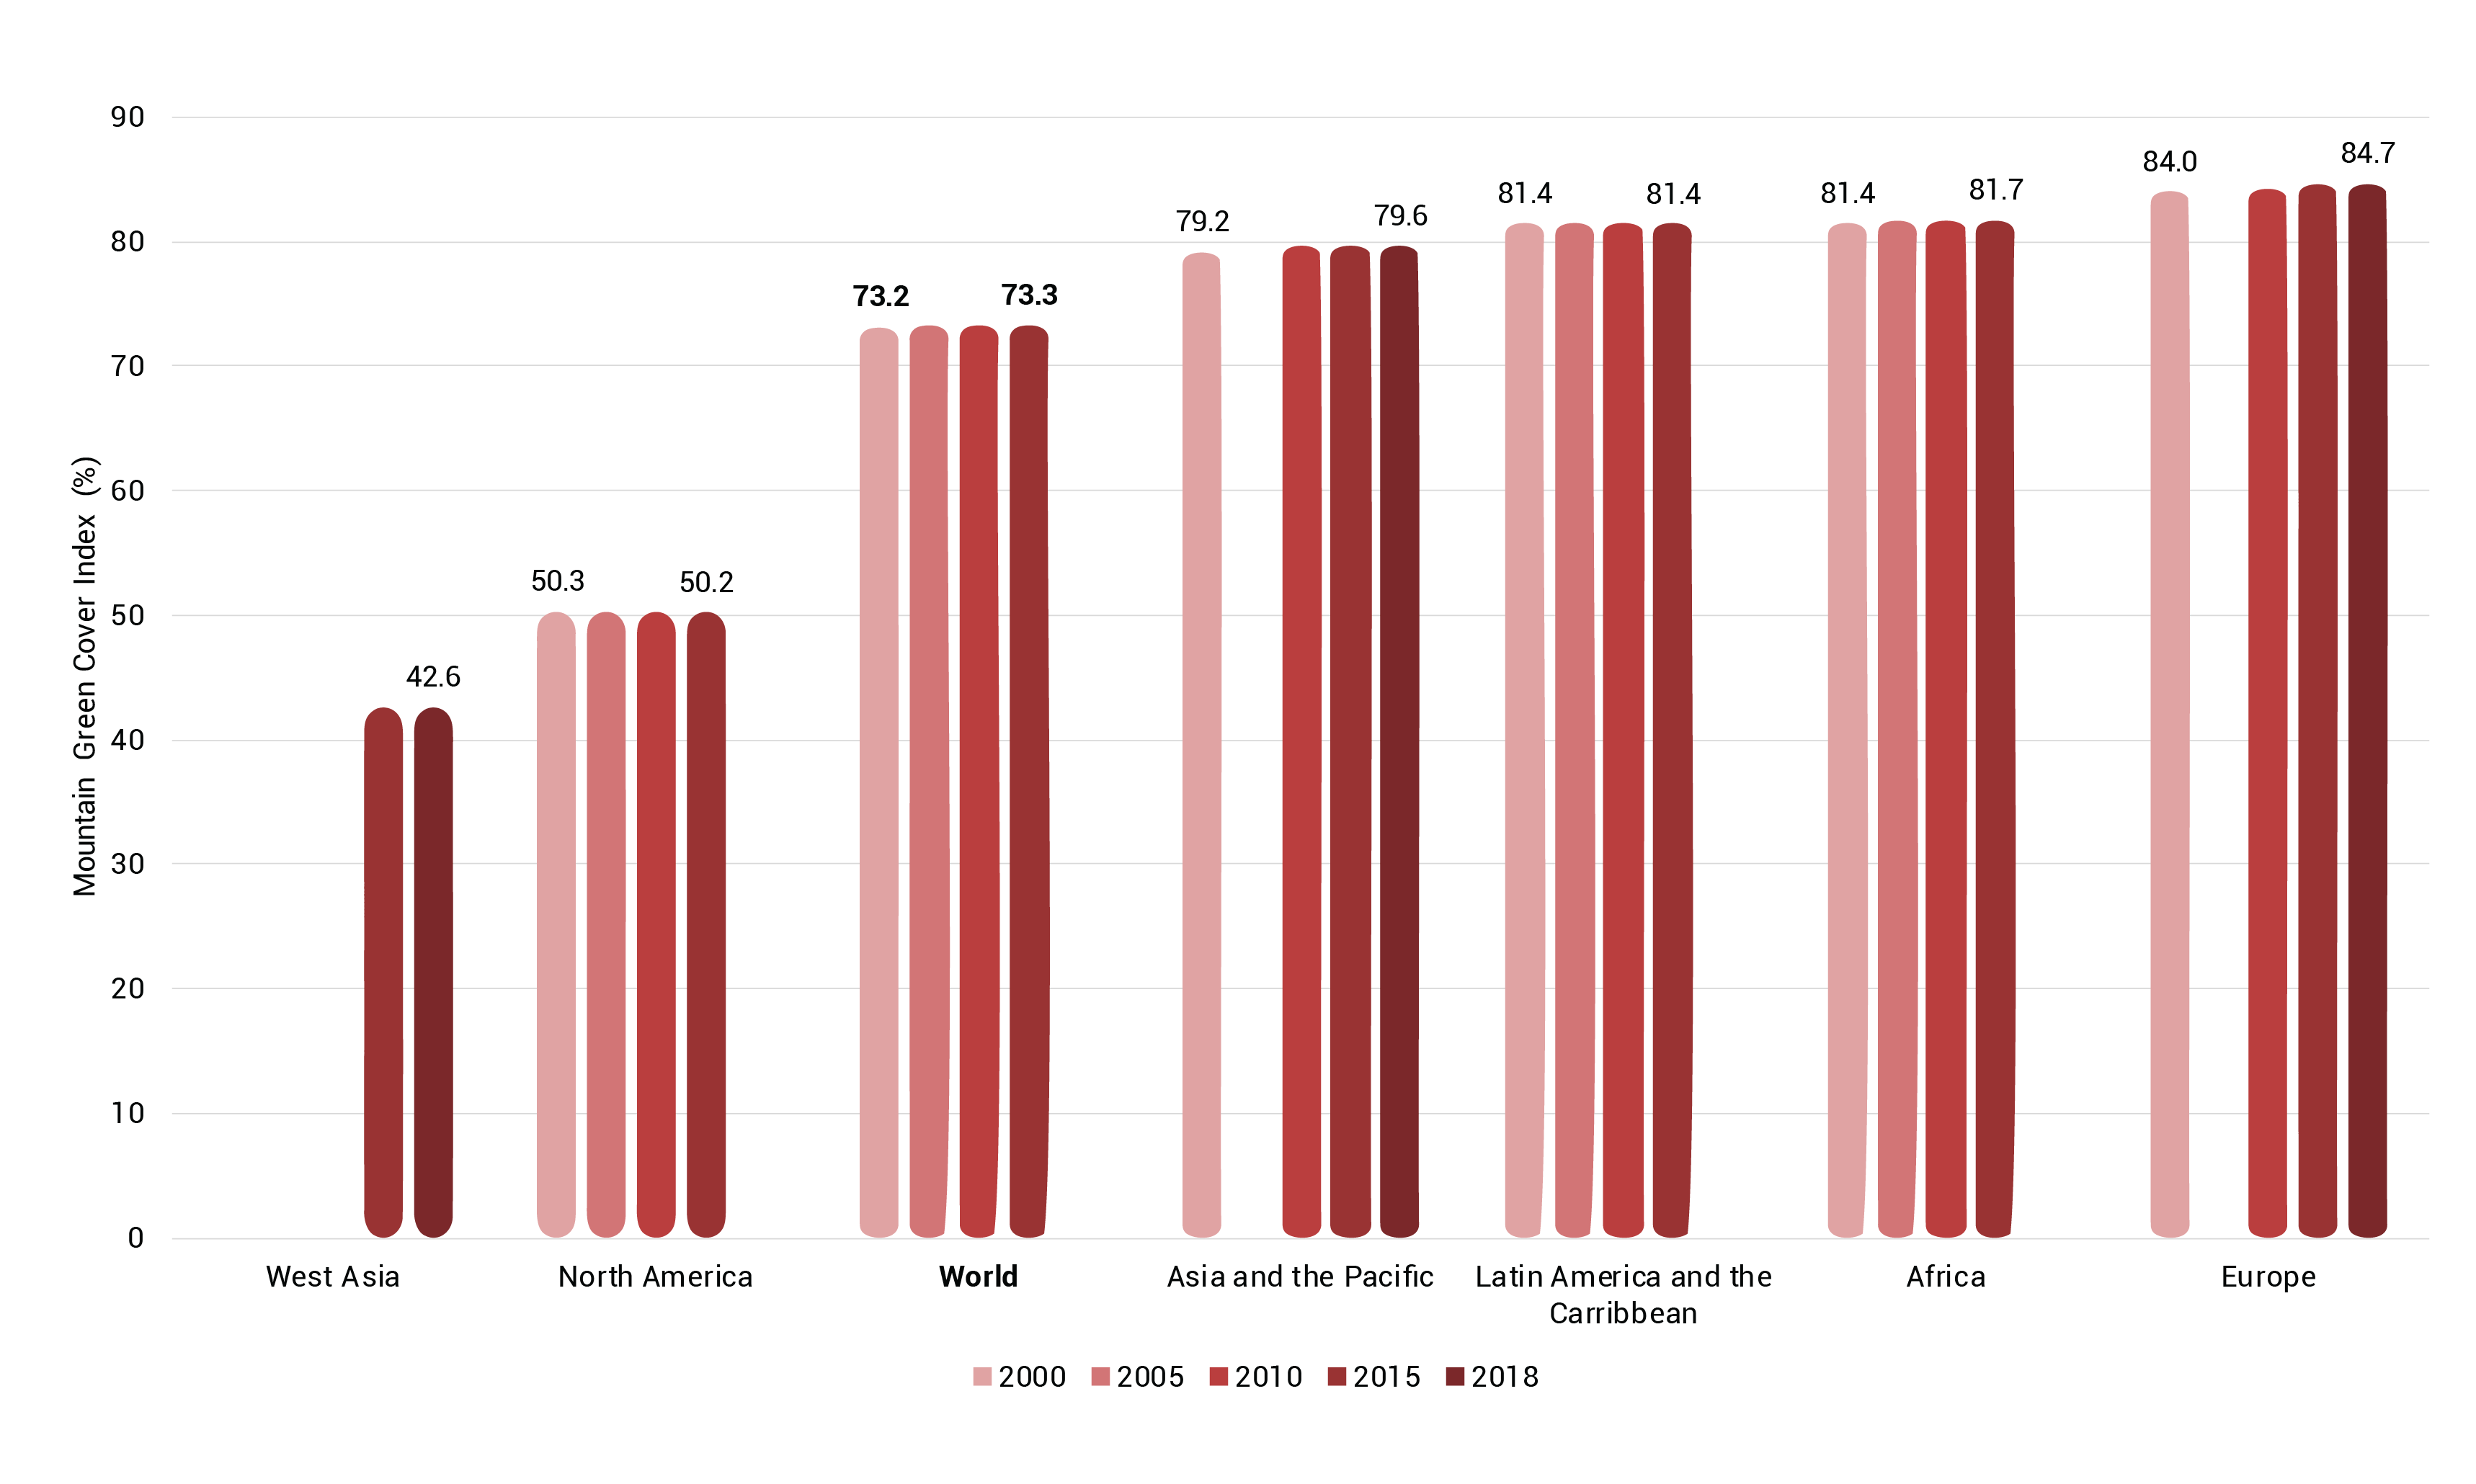
See detailed information▼ or Search the most up to date data
Indicator 15.4.2 is under SDG 15: “Protect, restore and promote sustainable use of terrestrial ecosystems, sustainably manage forests, combat desertification, and halt and reverse land degradation and halt biodiversity loss”, Target 15.4: “By 2030, ensure the conservation of mountain ecosystems, including their biodiversity, in order to enhance their capacity to provide benefits that are essential for sustainable development.”
The Mountain Green Cover Index (MGCI) measures the extent of and changes in green cover in mountain areas such as forests, shrubs, trees, pastureland and cropland in order to monitor the progress and assesses the status of conservation of mountain ecosystems.
In 2018 all regions except West Asia showed Mountain Green Cover Indices above 50 per cent. The world average stood at 73.3 per cent. Europe had the highest percentage (84.7 per cent), followed by Africa and Latin America and the Caribbean (81.7 and 81.4 per cent, respectively).
Mountain ecosystems, which play an intricate role in mountain biodiversity, and in the protection of soil from erosion and other ecosystem services, are vulnerable to natural and human-induced factors. They are increasingly affected by climate change, natural hazards, agricultural expansion, urbanization, timber extraction and recreational activities. Agricultural expansion, in particular, can result in high use of fertilizers and other inputs while recreational activities put pressure on soil health by altering its water retention and ion adsorption characteristics (e.g. through salting of ski runs); the construction of recreational sites can result in chemical pollution and disturbed topsoil (Freppaz et al. 2013).
Unsustainable soil management practices such as overgrazing, deforestation and monocropping are considered the main causes of erosion and reduced fertility, which degrade mountain soil and increase the potential for natural hazards such as landslides (FAO 2015b). It is essential for mountain ecosystems to be protected and appropriately managed to ensure their preservation, biodiversity conservation and sustainable development (United Nations Educational, Scientific and Cultural Organization [UNESCO] 2017; United Nations Decade on Ecosystem Restoration, UNEP and FAO 2021; International Union for Conservation of Nature [IUCN] n.d.; UNEP 2022c).
Insufficient global/regional data for analysis.
See detailed information▼ or See the data source
Sufficient data were not available to carry out an analysis for this indicator. Nevertheless, the unprecedented alteration of soil properties in the last few decades has been identified as a significant threat to species diversity, terrestrial ecosystem functioning, and, eventually, human health, for example through decreases in crop yields and exposure to heavy metals through the food chain (Martin and Griswold 2009; Nkwunonwo, Odika, and Onyia 2020; Kicińska, Pomykała and Izquierdo-Diaz 2022).
Land-use management and agricultural practices may affect soil pH, for example by removal of detritus, ploughing and burning. Higher soil acidity can reduce crop yield, depending on the crop and its pH preferences, by decreasing the availability of essential nutrients and increasing the impact of toxic elements such as metals. The application of chemical fertilizers or manure can affect soil microorganisms directly, by supplying nutrients, and indirectly by altering soil pH.
Nitrogen (N) deposition-induced soil acidification has become a global problem, although the response patterns of soil acidification to N addition and the underlying mechanisms remain far from clear (Tian and Niu 2015). Agricultural intensification to meet demand by an increasing population experiencing economic growth significantly accelerates soil pH alteration and hence changes in soil properties (FAO and UNEP 2021).
Insufficient global/regional data for analysis.
See detailed information▼ or Search the most up to date data
Indicator 2.4.1 is under SDG 2: “End hunger, achieve food security and improved nutrition and promote sustainable agriculture,“ Goal 2.4: “By 2030, ensure sustainable food production systems and implement resilient agricultural practices that increase productivity and production, that help maintain ecosystems, that strengthen capacity for adaptation to climate change, extreme weather, drought, flooding and other disasters and that progressively improve land and soil quality.”
Data have not yet been collected with a common set of criteria that fulfil the indicator requirements, nor are sufficient data currently available to carry out assessments for the SDG 2.4.1 sub-indicators (UNSD 2022b).
Agriculture contributes to development as an economic activity, a source of livelihood, and a provider and user of environmental services. The 2030 Agenda suggests that the three dimensions of sustainability (economic, social and environmental) be considered in all sectors including agriculture. Unsustainable agricultural practices deplete soil nutrients, remove organic matter, exacerbate irrigation, and lead to the loss of soil fertility, pollution and degradation (FAO 2018a; WWF 2023c).
FAO methodology identifies 10 main threats to soil functions: soil erosion, soil organic carbon losses, nutrient imbalance, acidification, contamination, waterlogging, compaction, soil sealing, salinization and loss of soil biodiversity (FAO 2017). Many of these threats are related to soil pollution as discussed in this section. The FAO methodology provides a detailed description for computing indicator-based on-farm surveys, integrating the sub-indicators in terms of their classification (using standard methods) as “desirable”, “acceptable” or “unacceptable”. Farm surveys capture farmers’ knowledge and experience, showing that they are very aware of the state of their soils.
It should be noted that some SDG indicators can be used to report on more than one aspect of DPSIR. For example, indicator 2.4.1, which uses farm surveys as a measurement instrument to capture the environmental, economic and social dimensions of sustainable production, can also be used to report on overall progress with respect to the 11 sub-indicators (UNSD 2022b), including management of fertilizers and management of pesticides, which can be used in turn to report on progress, or lack of it, regarding individual drivers of land and soil degradation.
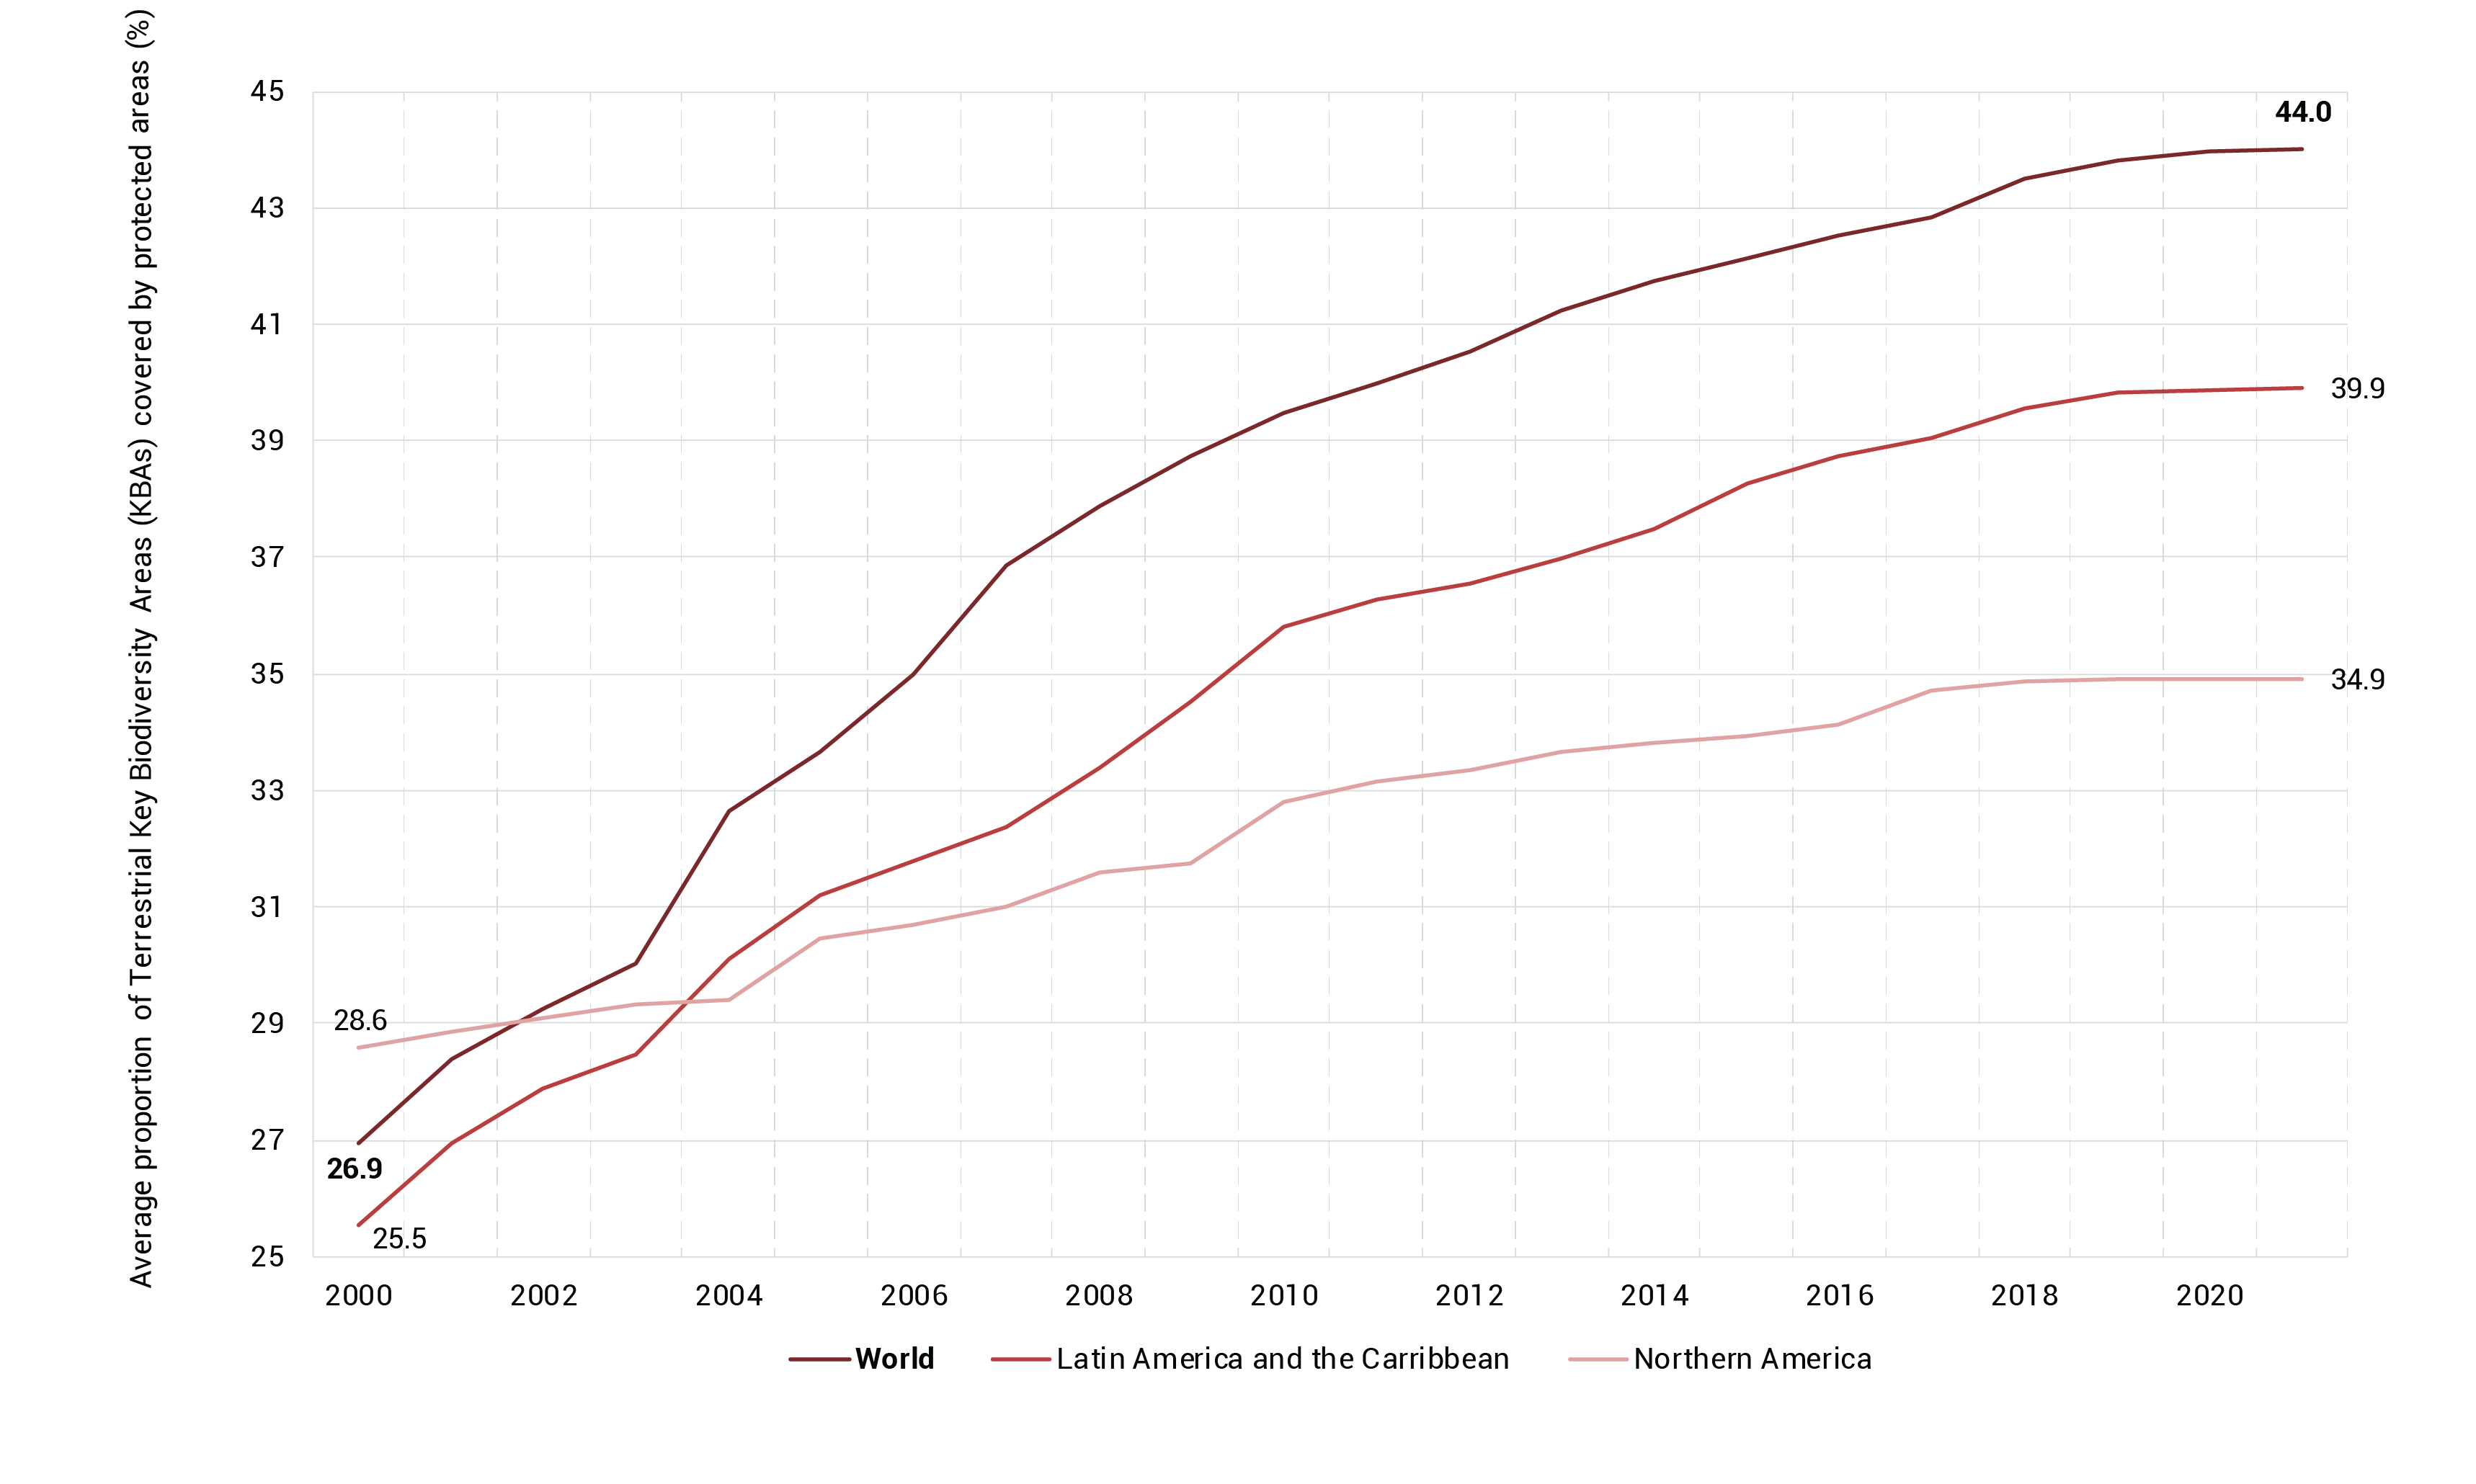
See detailed information▼ or Search the most up to date data
Indicator 15.1.2 is under SDG 15, “Protect, restore and promote sustainable use of terrestrial ecosystems, sustainably manage forests, combat desertification, and halt and reverse land degradation and halt biodiversity loss”, Target 15.1: “By 2020, ensure the conservation, restoration and sustainable use of terrestrial and inland freshwater ecosystems and their services, in particular forests, wetlands, mountains and drylands, in line with obligations under international agreements.”
Globally, the average proportion of terrestrial key biodiversity areas (KBAs) covered by protected areas increased by more than 17 per cent from 2000 to 2021, although the total number represents less than 50 per cent of the more than 15,000 KBAs identified. In all regions an increasing proportion of KBAs have been covered by protected areas in the last two decades. For example, in Latin America and the Caribbean and in North America the proportion increased by almost 15 and 6 per cent, respectively. However, data availability in some regions is scarce. A more complete analysis is necessary for sound decision-making and policy actions.
The five main drivers of biodiversity loss recognized by the Convention on Biological Diversity (CBD) are habitat loss, climate change, pollution, invasive alien species, and unsustainable use (IPBES 2019). Climate change and land-use intensification are particular threats to terrestrial biodiversity, with severe impacts on ecosystem functioning and human health (Mouillot et al. 2020).
The importance of treaties varies according to location; for example, invasive alien species are the principal driver of biodiversity loss in many island ecosystems. Land-use change in terrestrial areas represents a significant risk of soil pollution as it can result in soil erosion, while land clearance using fire can add to the deposition of atmospheric pollution affecting soils. At the same time, designated protected areas limit human activities, reducing soil pollution. Contamination of pristine and protected areas may occur, especially when organic contaminants are transported long distances, whereas biodiverse ecosystems and soils are more resilient and have a higher potential to degrade and filter these contaminants (FAO 2020b; Marino 2020).
SDG indicator 15.1.2 recognizes the need for protected areas to cover important sites of terrestrial biodiversity in order to promote sustainable development, biodiversity conservation and ecosystem health. Human activities, especially conversion and degradation of natural habitats, alter the natural state of ecosystems and cause widespread and severe biodiversity declines (Newbold et al. 2015). Thus, increased efforts and attention are required to prevent losses of terrestrial biodiversity and the ecosystem services they provide (Leclère et al. 2020).
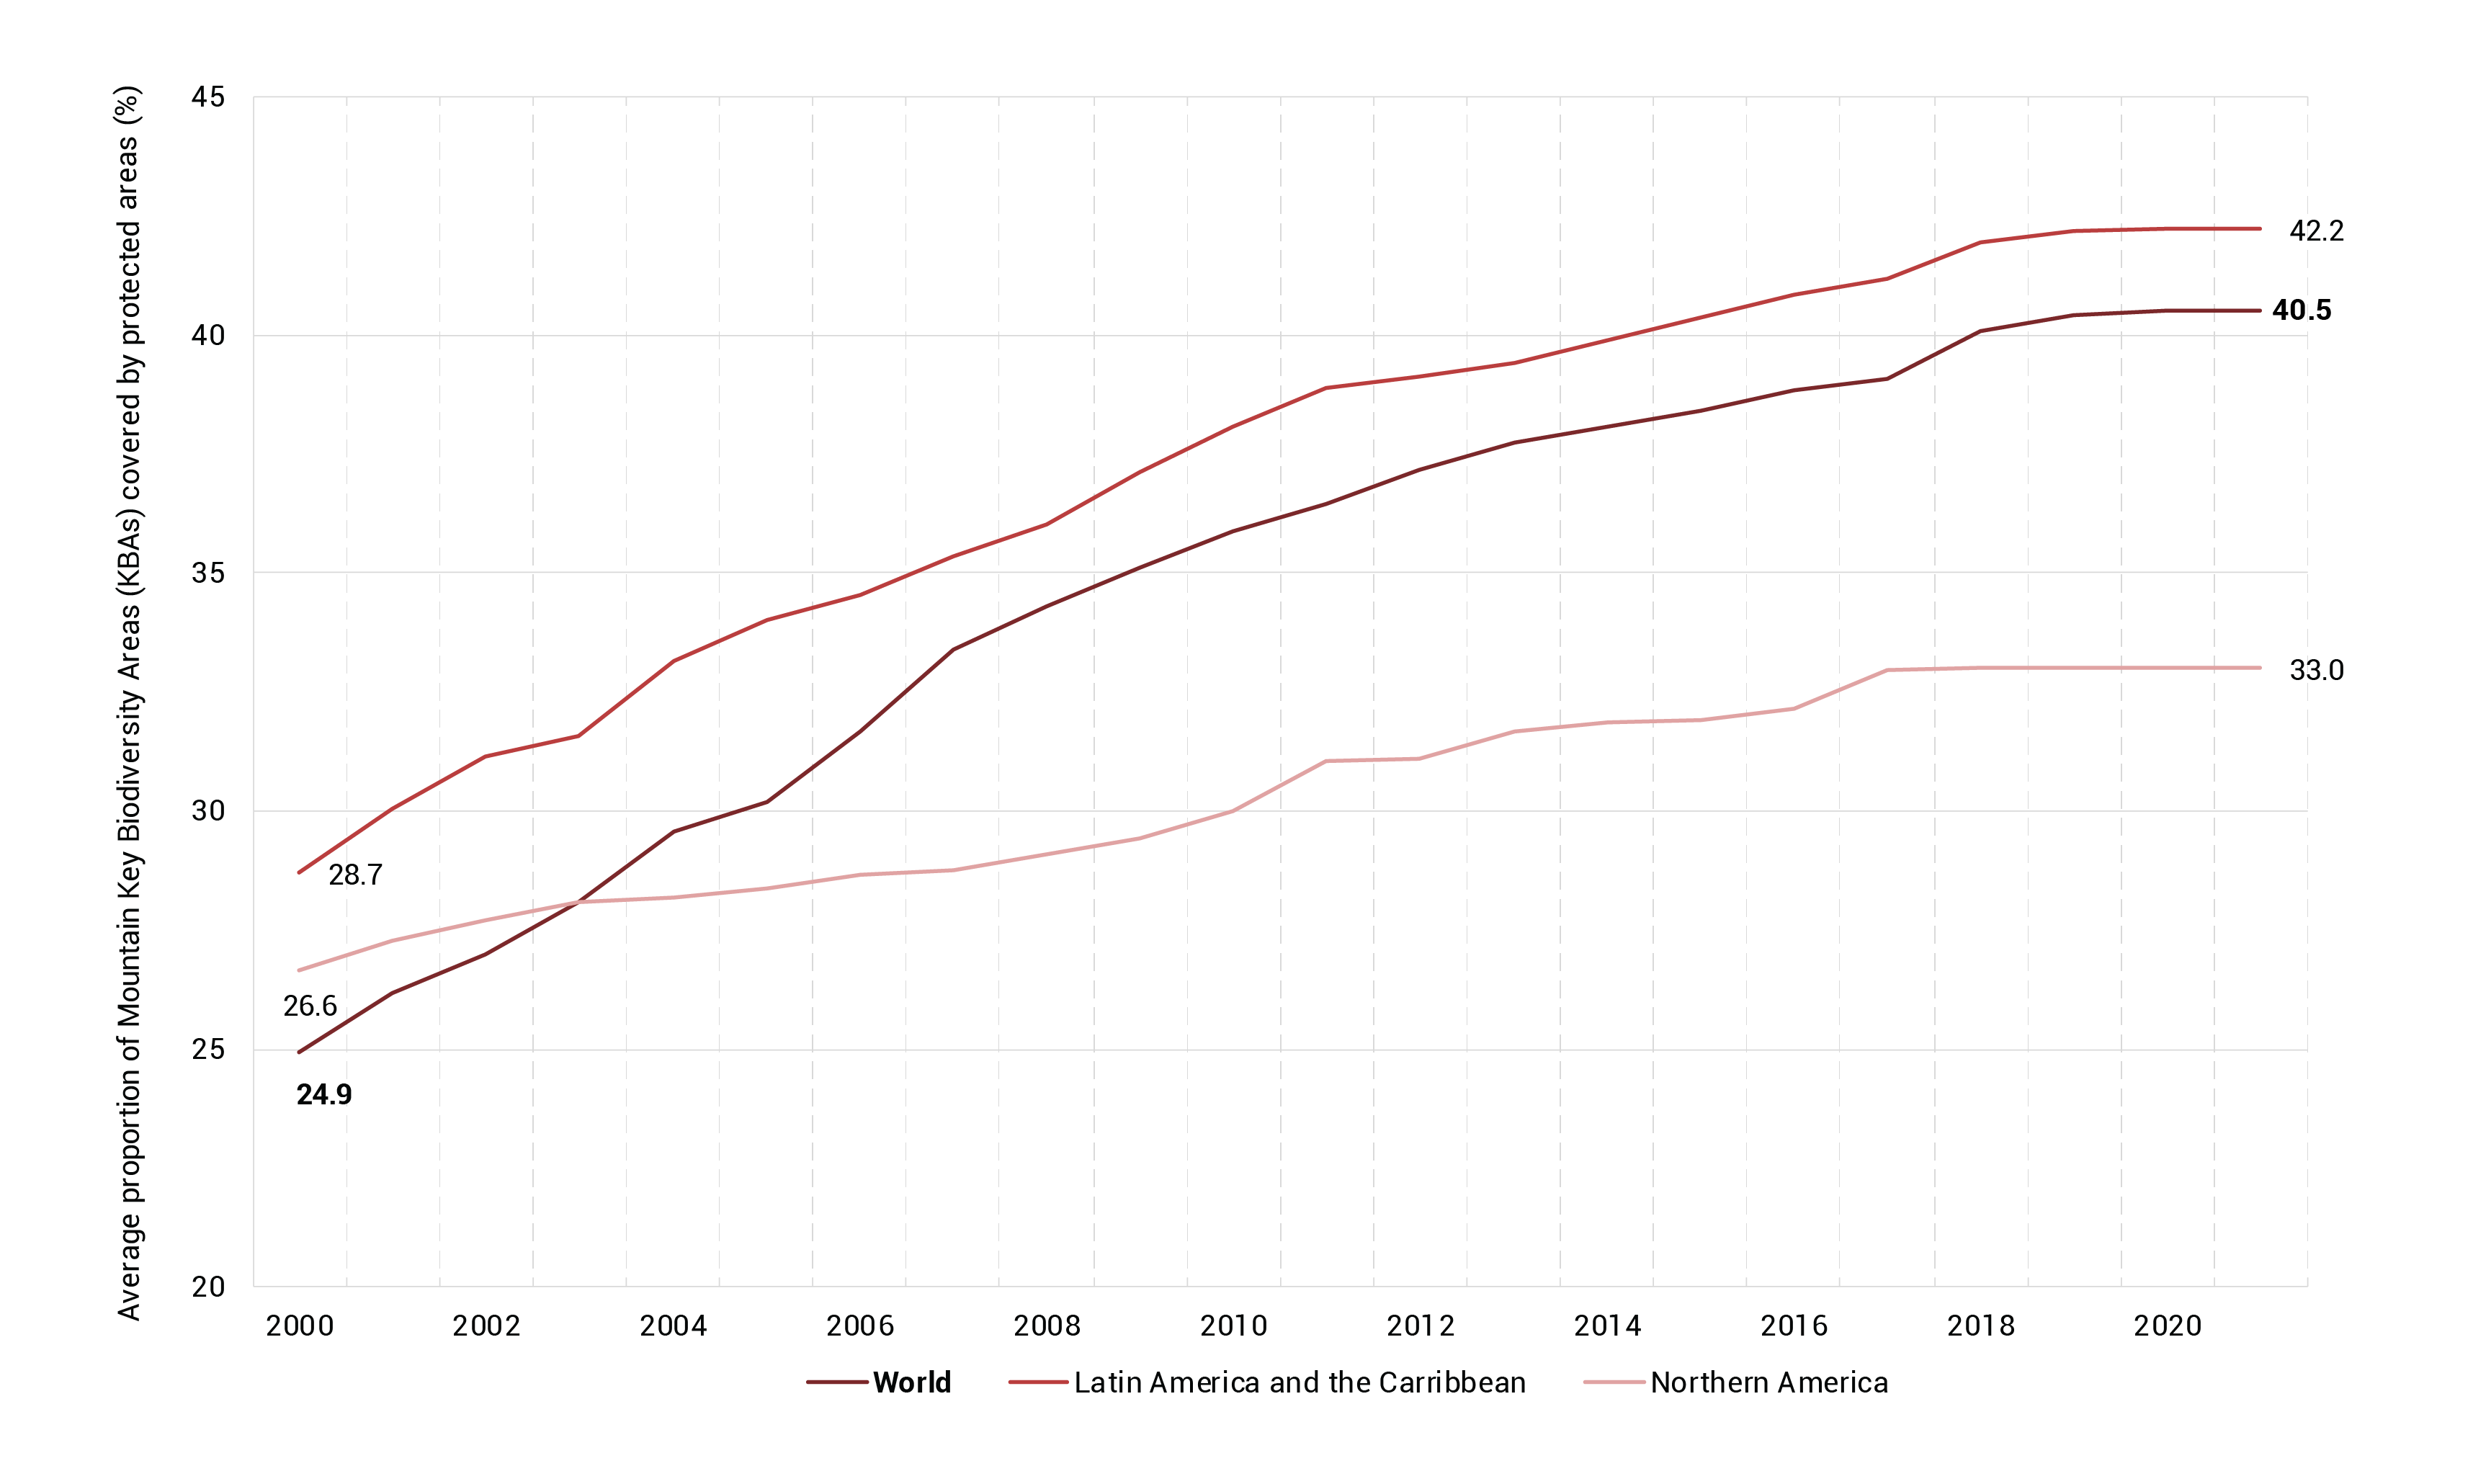
See detailed information▼ or Search the most up to date data
Indicator 15.4.1 is under SDG 15, “Protect, restore and promote sustainable use of terrestrial ecosystems, sustainably manage forests, combat desertification, and halt and reverse land degradation and halt biodiversity loss”, Target 15.4: “By 2030, ensure the conservation of mountain ecosystems, including their biodiversity, in order to enhance their capacity to provide benefits that are essential for sustainable development.”
The proportion of important sites for mountain biodiversity covered by key biodiversity areas (KBAs) increased from almost 25 per cent in 2000 to 40.5 per cent in 2021. During this period the proportion in Latin America and the Caribbean and in North America increased by 13 and 6 per cent respectively, indicating successful policy interventions to safeguard mountain areas.
The protection of important sites for mountain biodiversity plays a critical role in conserving biodiversity and maintaining viable populations of threatened mountain species. Soil pollution originating from anthropogenic activities and land-use change can be limited by designating these sites as protected areas where limited human activities are allowed, hence limiting potential pollution. Increasing anthropogenic activities present threats to biodiversity even in pristine areas.
Land-use change, human-induced climate change, and the introduction of invasive alien species reduce the extent of natural habitat and therefore favour mountain biodiversity loss and extinction (Vincent et al. 2019; GRID-Arendal 2020). The degradation of mountain ecosystems, including mountain biodiversity (SDG indicator 15.4.1) and green cover (SDG indicator 15.4.2), affects ecosystems’ ability to supply water, retain soil moisture, and prevent landslides and flooding downstream (United Nations Decade on Ecosystem Restoration, UNEP and FAO 2021).
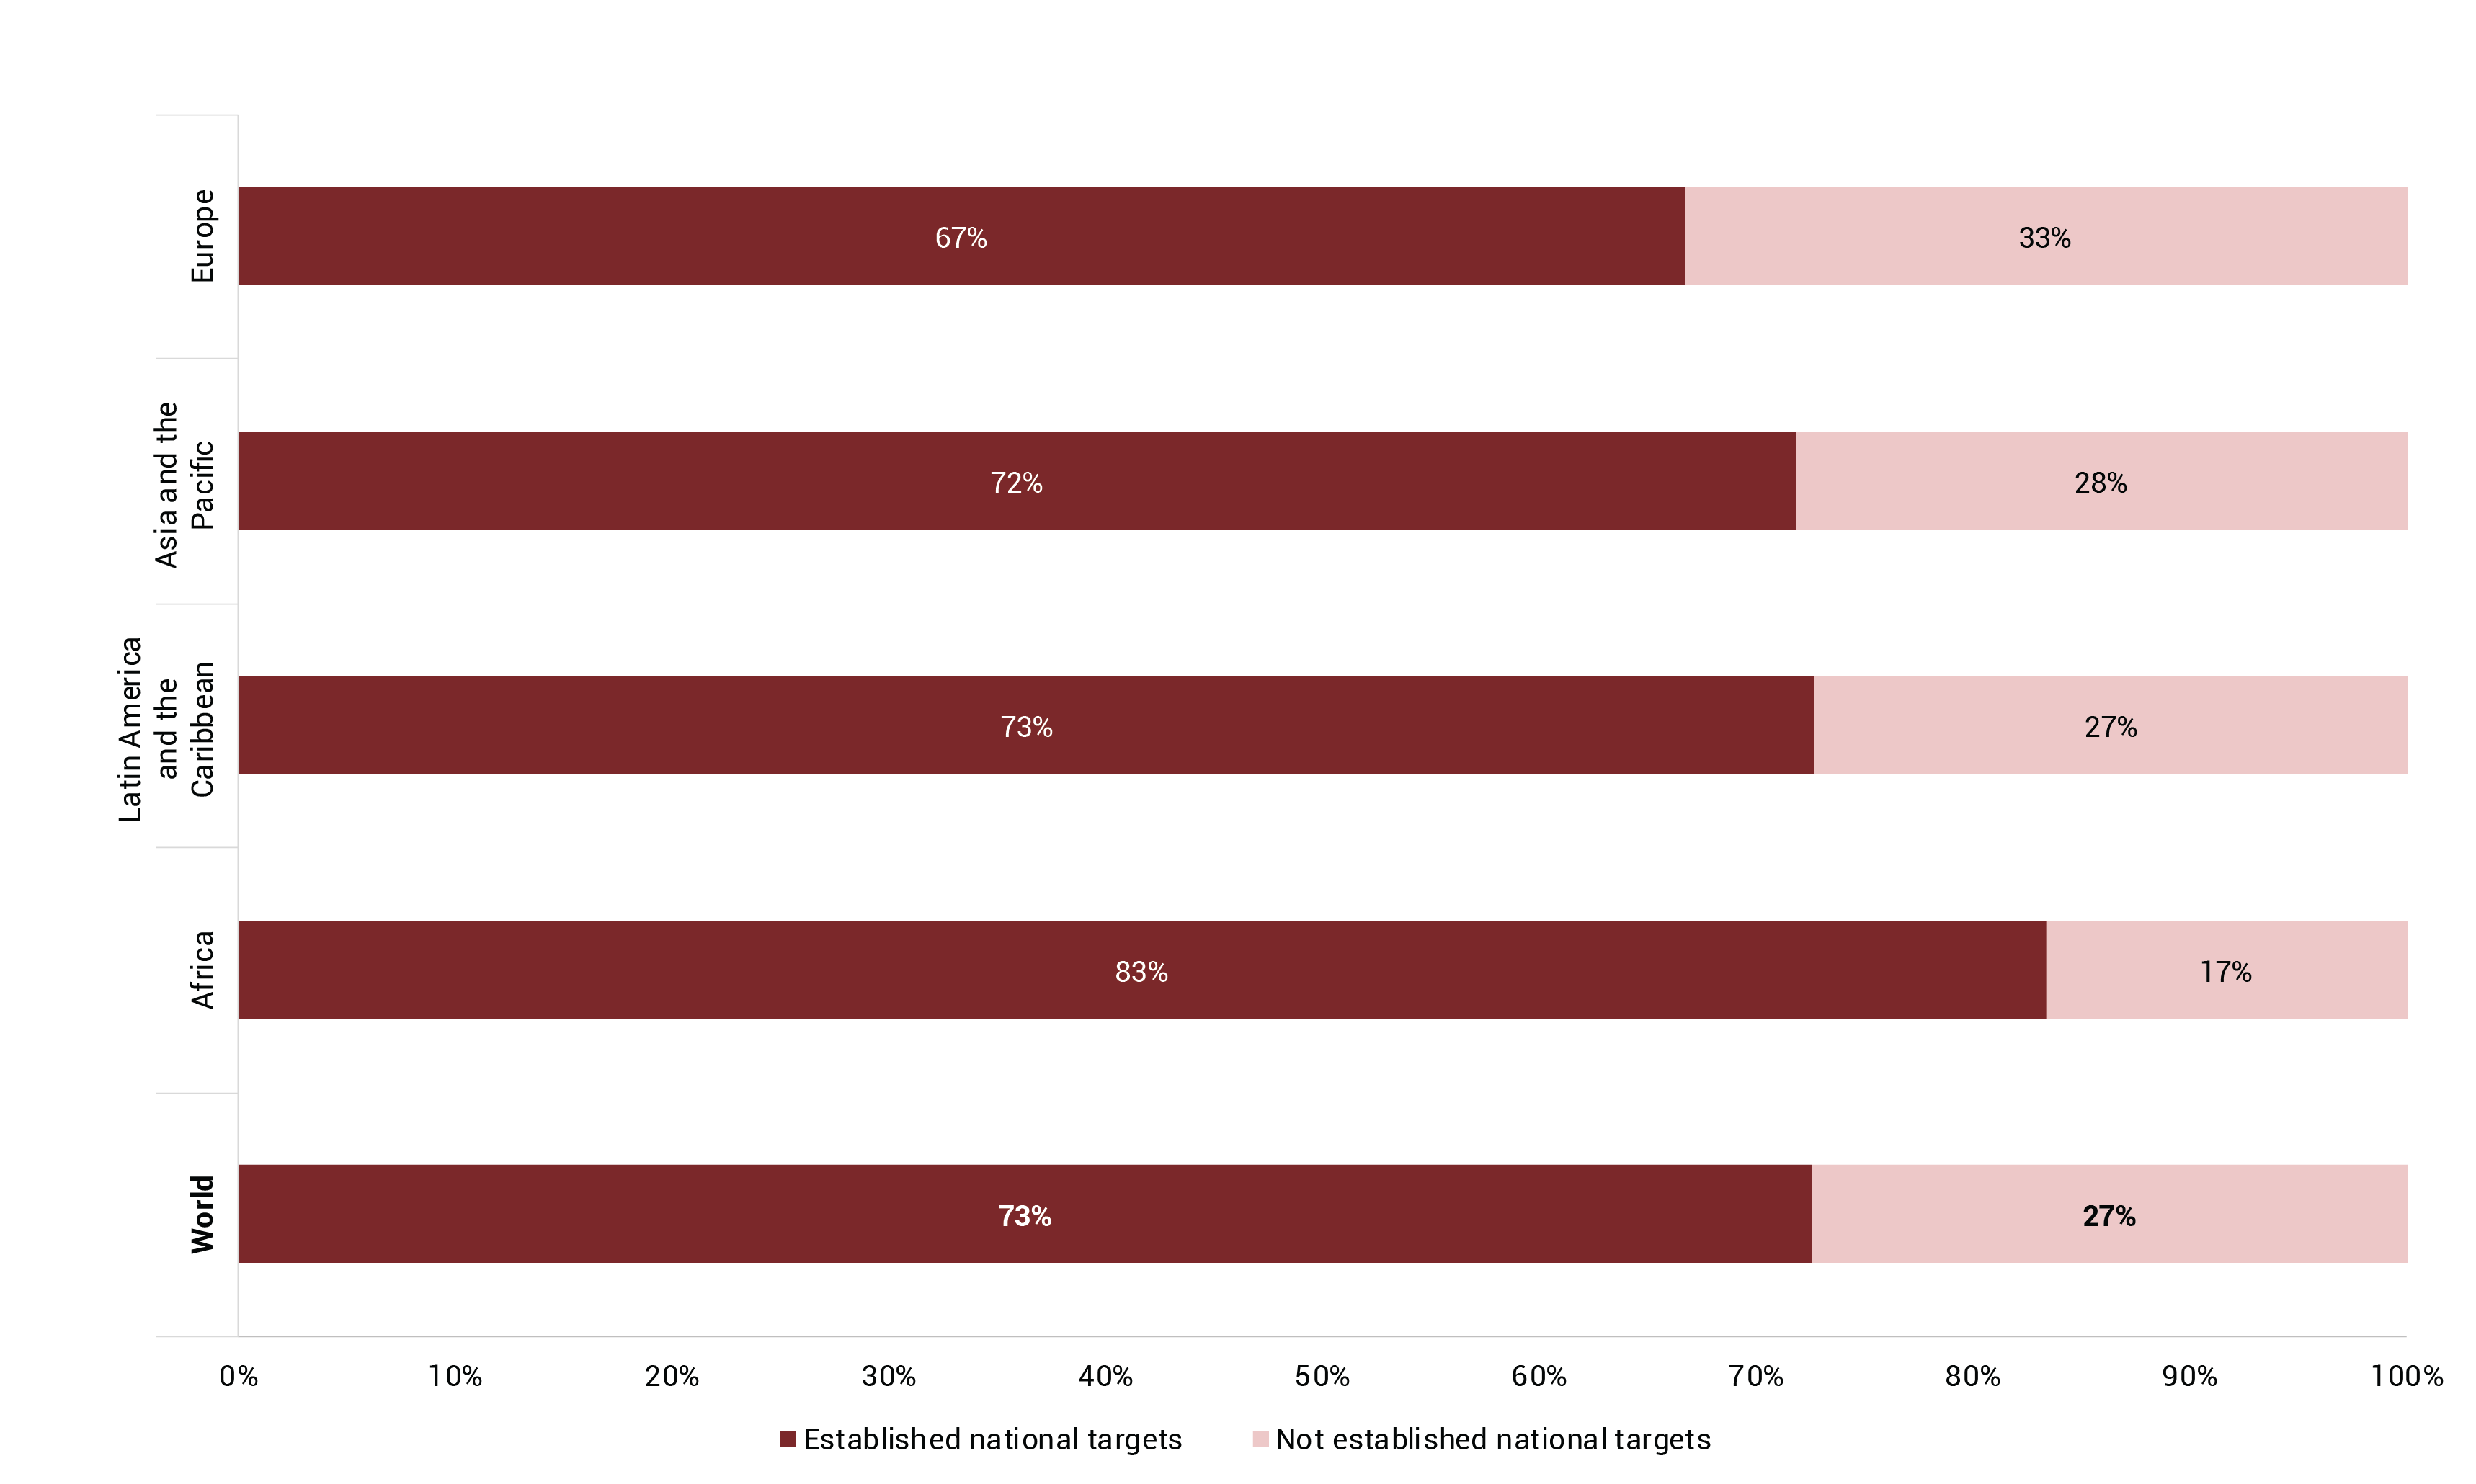
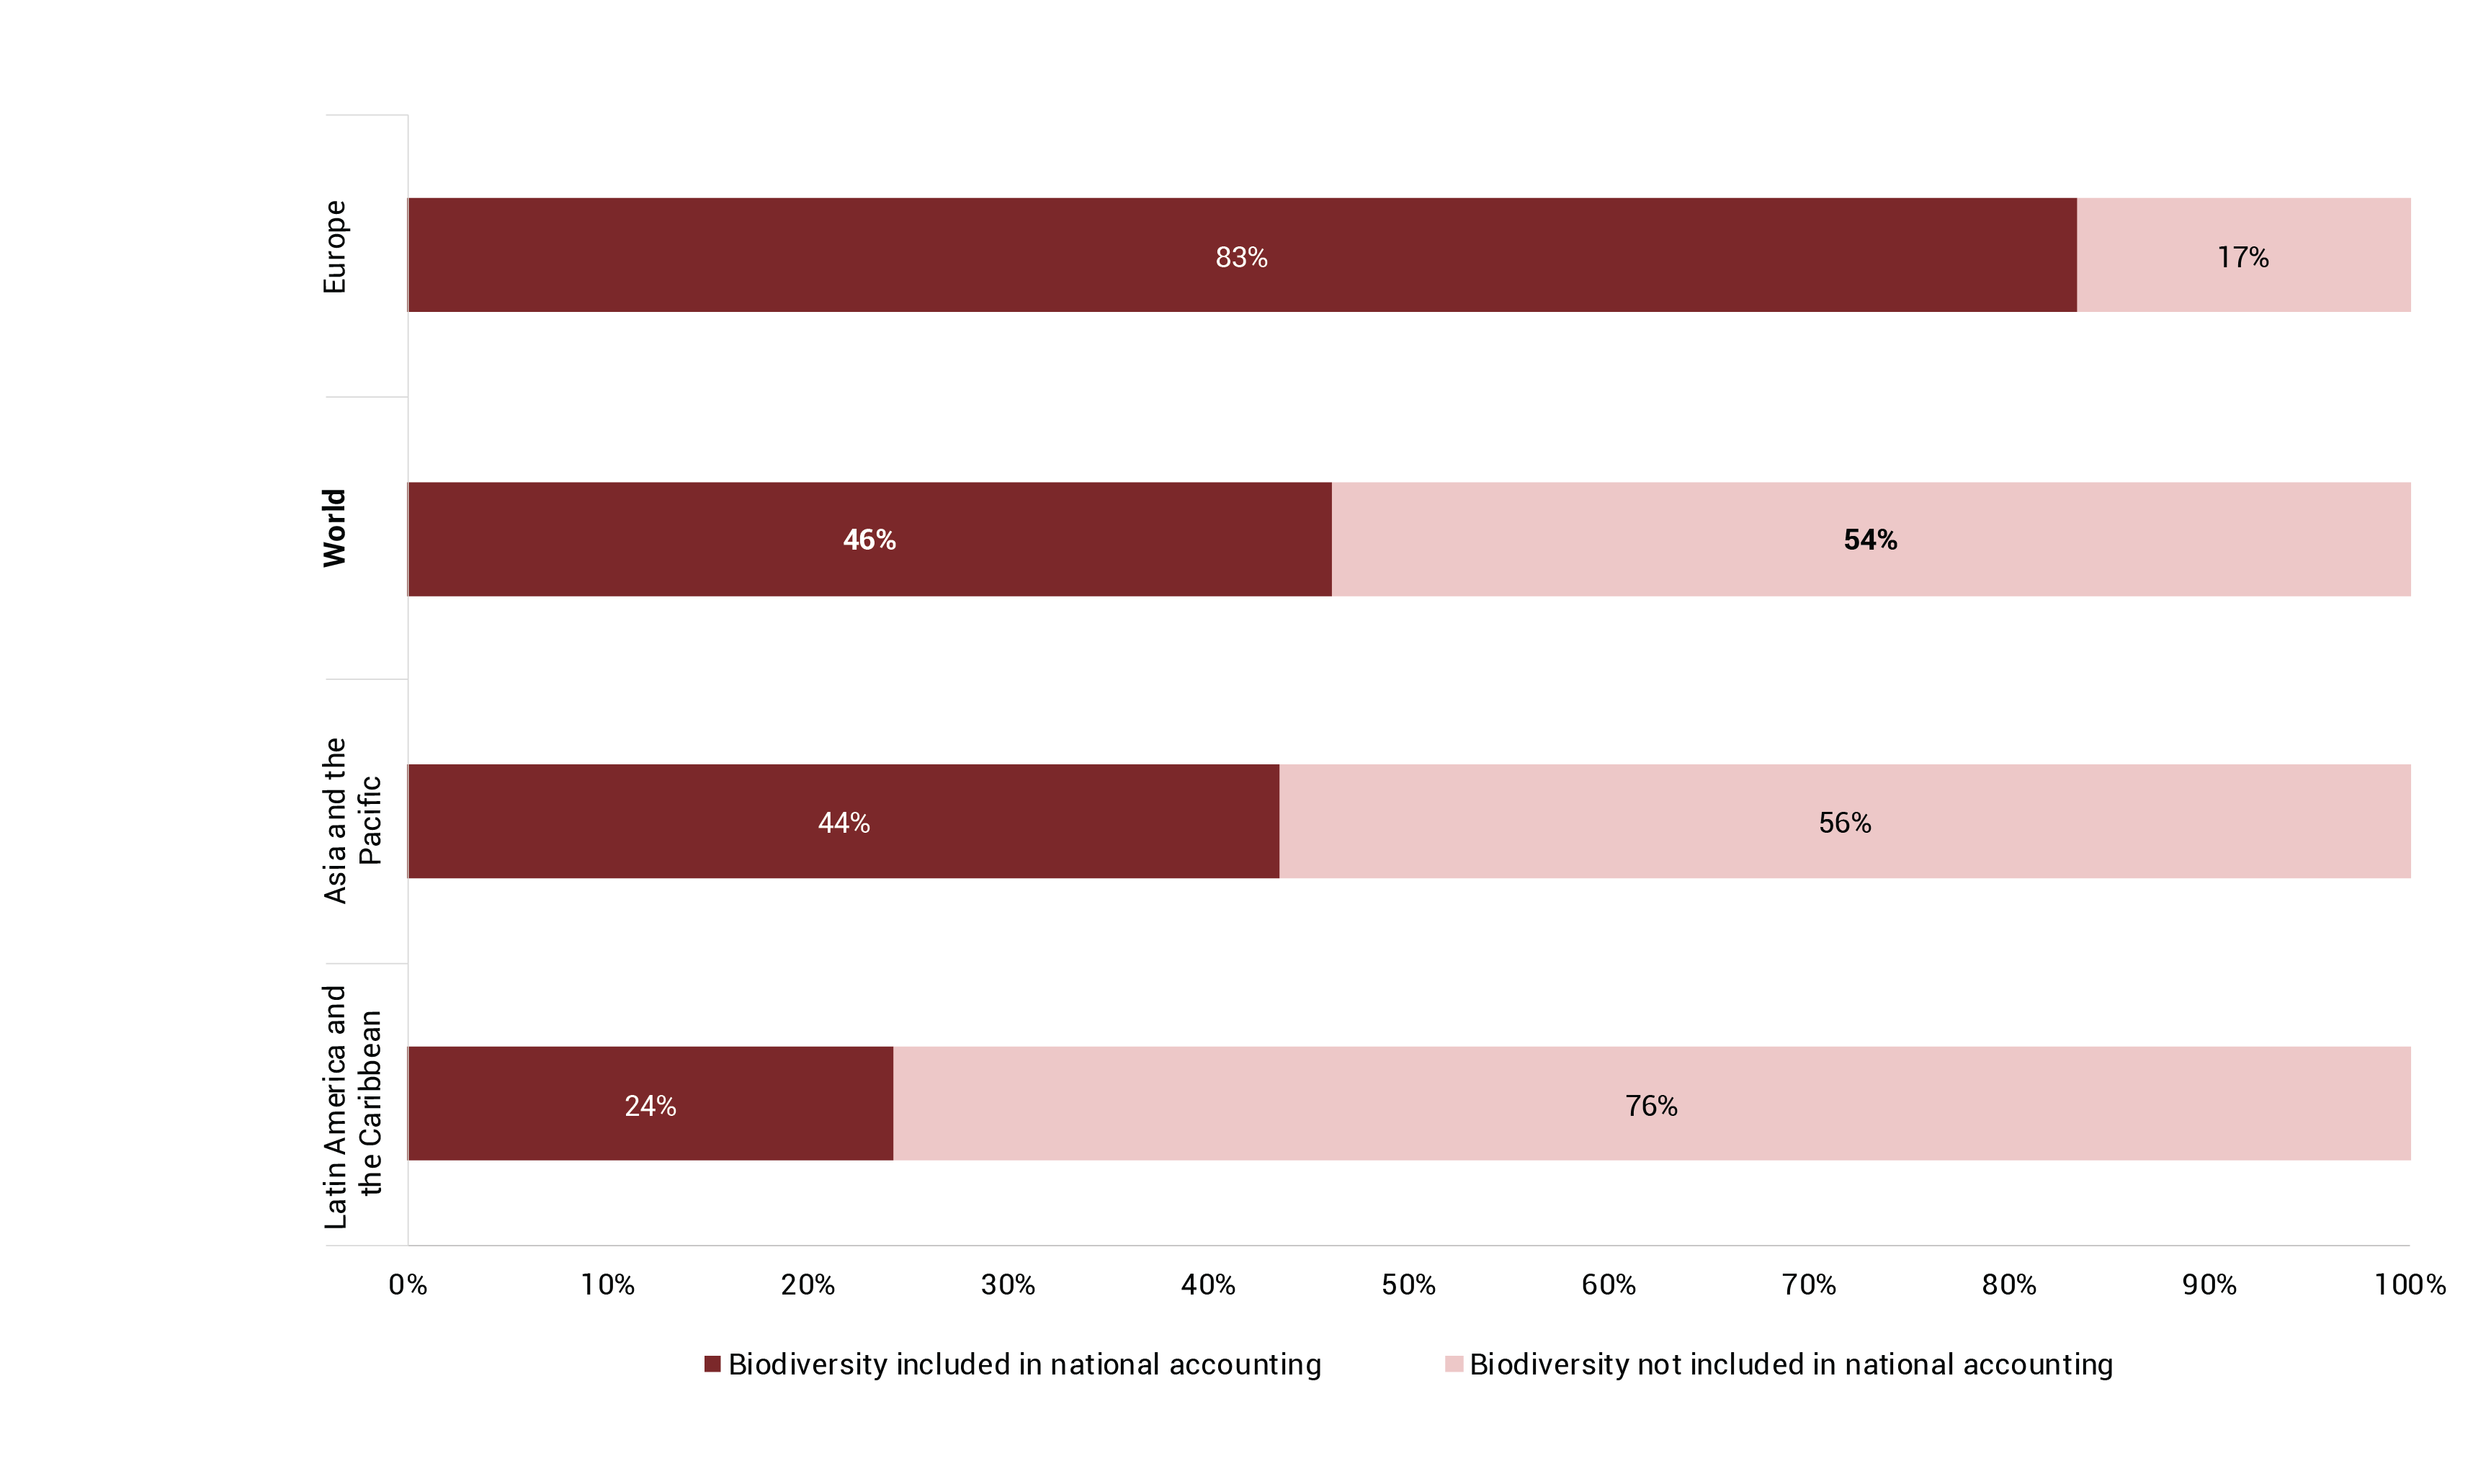
See detailed information▼ or Search the most up to date data for SDG 15.9.1 (a) or Search the most up to date data for SDG 15.9.1 (b)
Indicator 15.9.1 (a) and (b) are under SDG Goal 15: “Protect, restore and promote sustainable use of terrestrial ecosystems, sustainably manage forests, combat desertification, and halt and reverse land degradation and halt biodiversity loss”, Target 15.9, “By 2020, integrate ecosystem and biodiversity values into national and local planning, development processes, poverty reduction strategies and accounts.”
The main objective of this indicator is to help ensure that the diverse values of biodiversity and the opportunities derived from its conservation and sustainable use are recognized and reflected in all relevant public and private decision-making processes (UNSD 2023a). In 2021, 73 per cent of countries (140 out of 193) had established national targets in accordance with or similar to the Aichi Biodiversity Target 2: the integration of biodiversity values into strategies for development and poverty reduction, planning processes and national accounting. The highest shares were in Africa (83 per cent), followed by Latin America and the Caribbean (73 per cent), Asia and the Pacific (72 per cent) and Europe (67 per cent). A regional aggregation for North America was not possible due to Insufficient data.
In 46 per cent of the countries in the world biodiversity is integrated into national accounting and reporting systems, defined as implementation of the System of Environmental-Economic Accounting (SEEA). This means that more than half (54 per cent) have not mainstreamed biodiversity into their national accounting and reporting systems. By far the highest compliance rates can be found in Europe (83 per cent), followed by Asia and the Pacific (44 per cent) and Latin America and the Caribbean (24 per cent). Data for North America were insufficient for inclusion in the analysis.
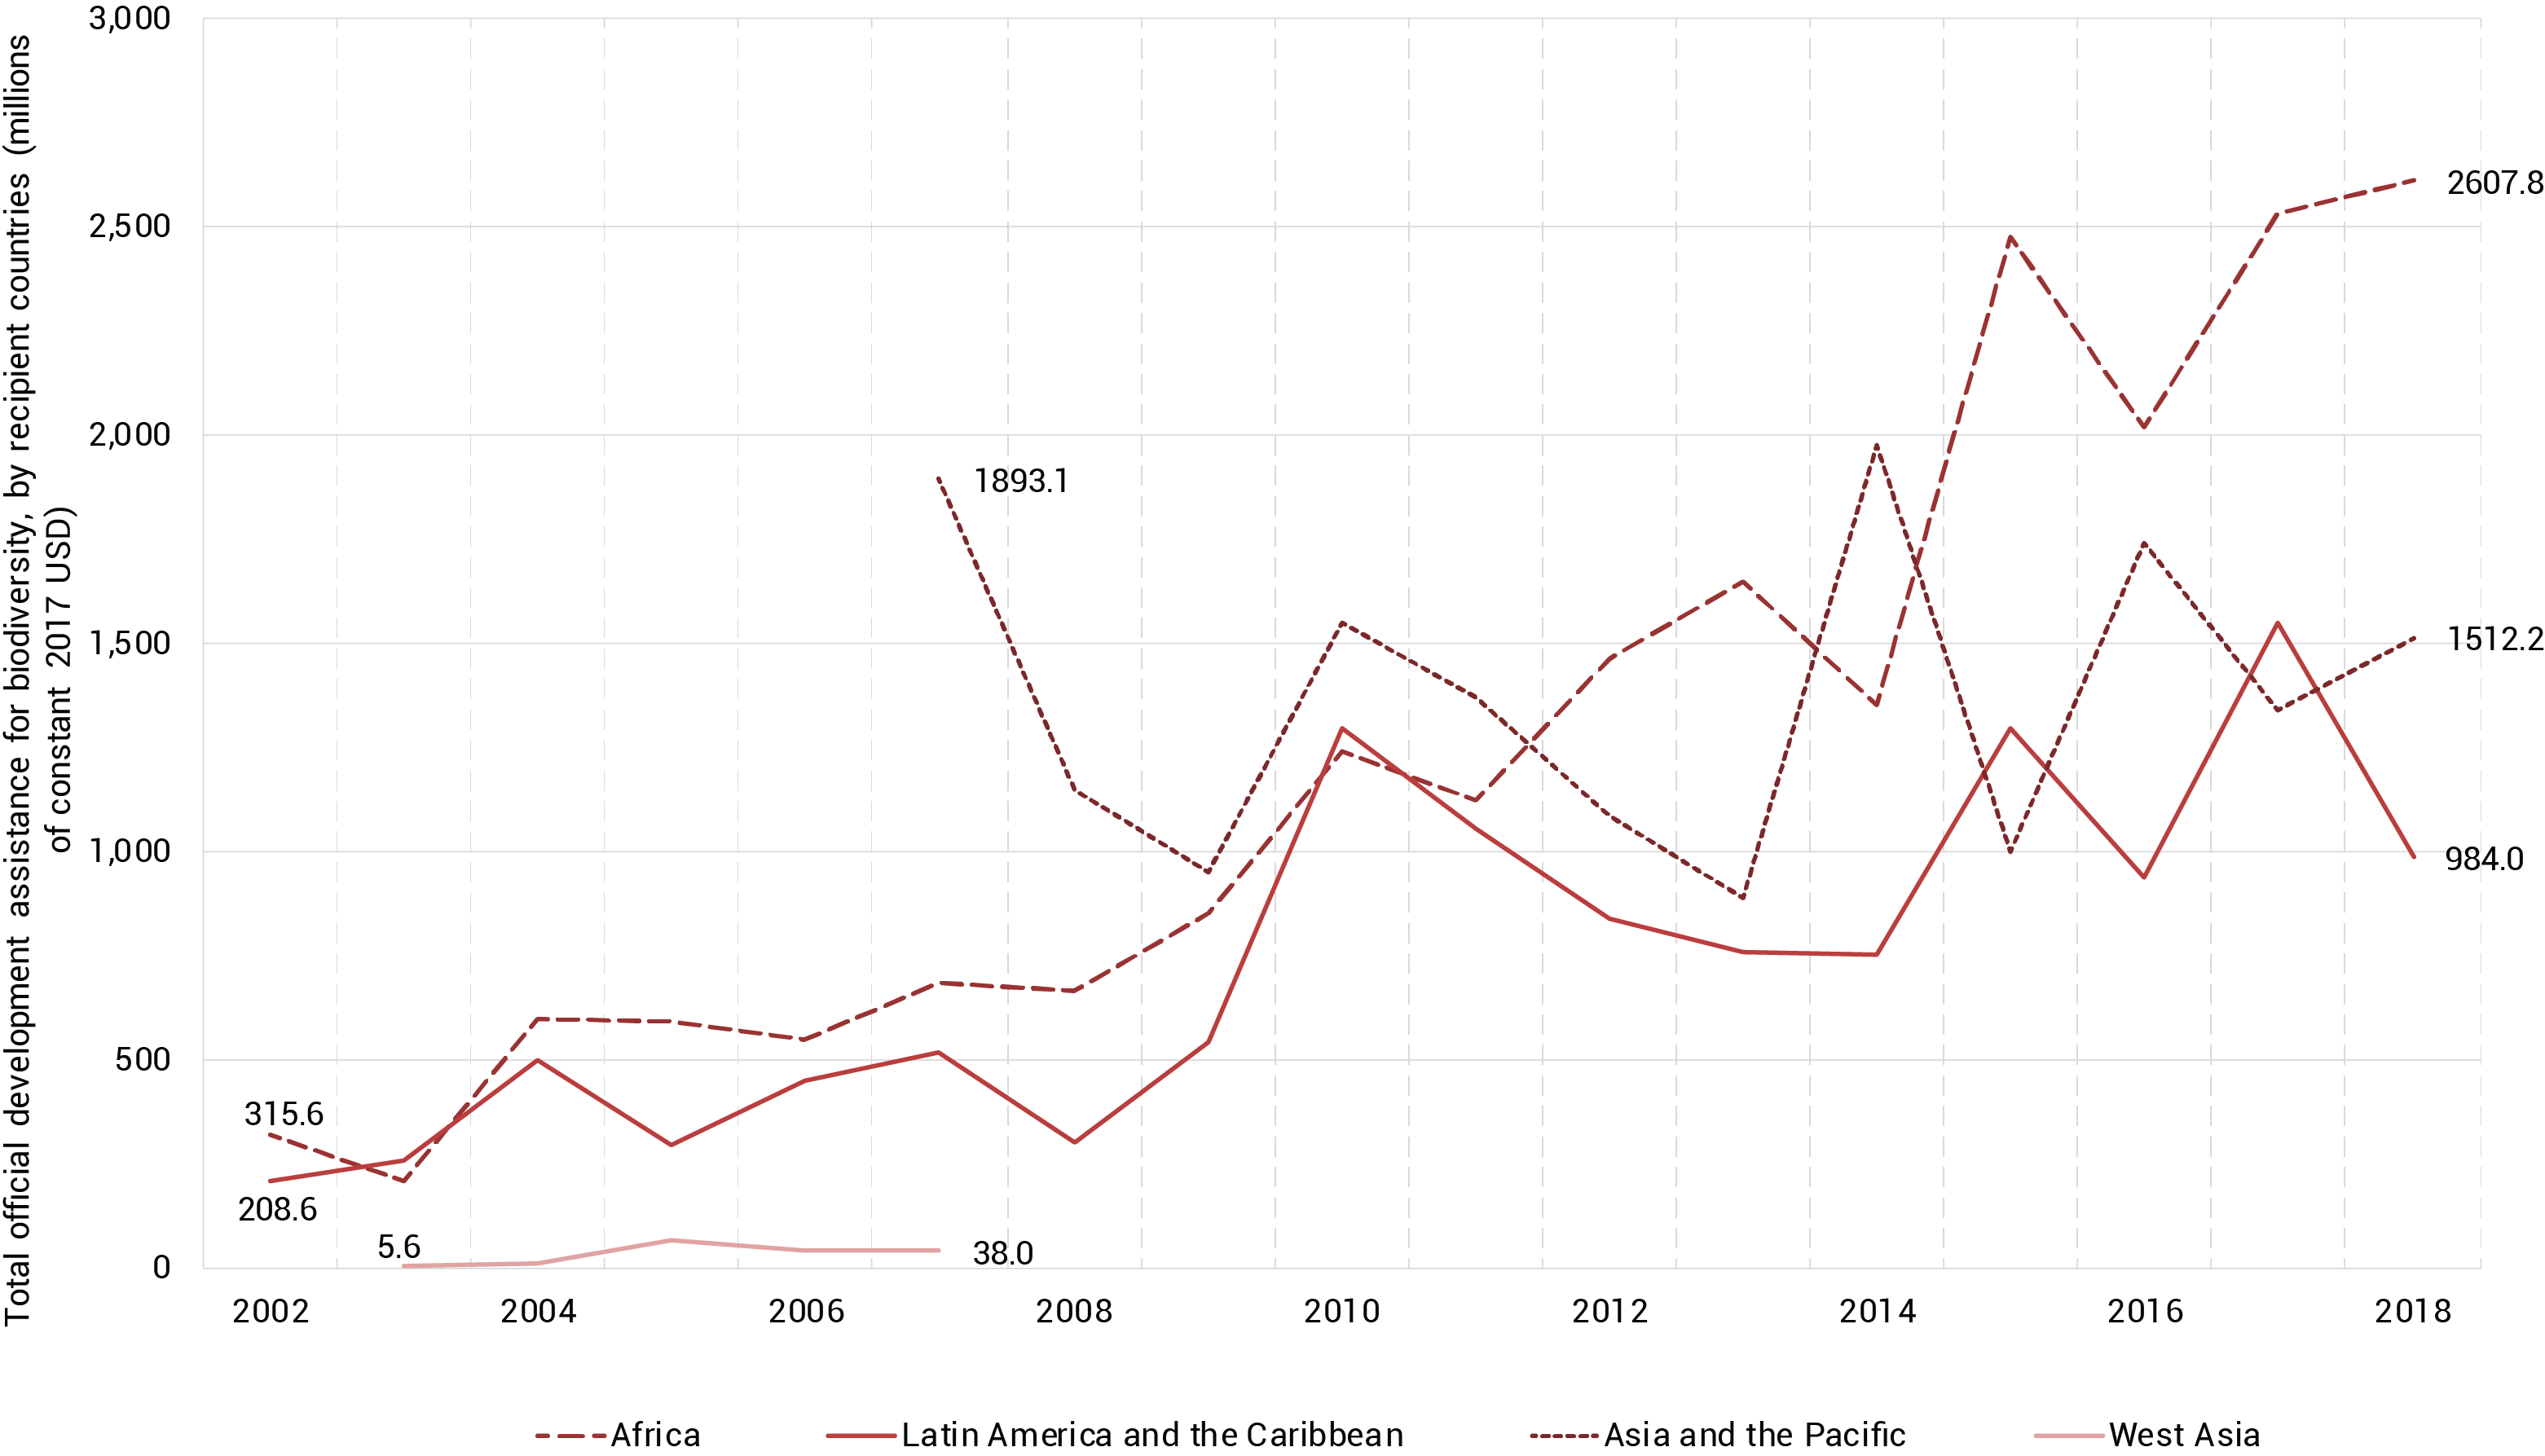
See detailed information▼ or Search the most up to date data
Indicator 15.b.1 (a) is under SDG Goal 15: “Protect, restore and promote sustainable use of terrestrial ecosystems, sustainably manage forests, combat desertification, and halt and reverse land degradation and halt biodiversity loss”, Target 15.b: “Mobilize significant resources from all sources and at all levels to finance sustainable forest management and provide adequate incentives to developing countries to advance such management, including for conservation and reforestation.”
Indicator 15.b.1 (a) measures official development assistance (ODA) for conservation and sustainable use of biodiversity. Development cooperation such as ODA supports low- and middle-income countries in making the transition to sustainable development. It can take the form of technical assistance in strengthening policies and institutional capacity or direct financial support for activities in support of biodiversity conservation (OECD 2020). ODA for conservation and sustainable use of biodiversity assists in easing the pressures on biodiversity and eventually human health caused by exposure to toxic pollutants arising from human activities (Swinehart et al. 2019).
Globally, total ODA for conservation and sustainable use of biodiversity showed fluctuating trends with overall increases during the past two decades. In Africa ODA flows increased sharply between 2002 and 2018, when they totaled more than US$ 2.5 billion.
Insufficient global/regional data for analysis.
See detailed information▼ or Search the most up to date data
Sufficient data for use with this indicator are not yet available. Therefore, an analysis of current trends is not possible.
Diversion of biodegradable and organic material from the waste stream through source or centralized mechanical separation is a prerequisite for further treatment by more environmentally friendly methods such as municipal waste composting (Wei et al. 2017). Composting is a process of waste recycling based on the biological degradation of organic matter. The organic matter is converted into mineralized products that benefit the environment through reduced greenhouse gas (GHG) emissions, decreased leachate, and support for humus formation and thus plant growth. However, composting processes can emit irritating odours and volatile organic compounds (VOCs), posing risks to ecosystems and human health. Good operating conditions for composting municipal solid waste (MSW), while optimizing composting parameters, are necessary to alleviate threats to the environment and health risks (Soobhany 2018).
Indicator Framework: Chemicals & Waste Pollution
See the data below
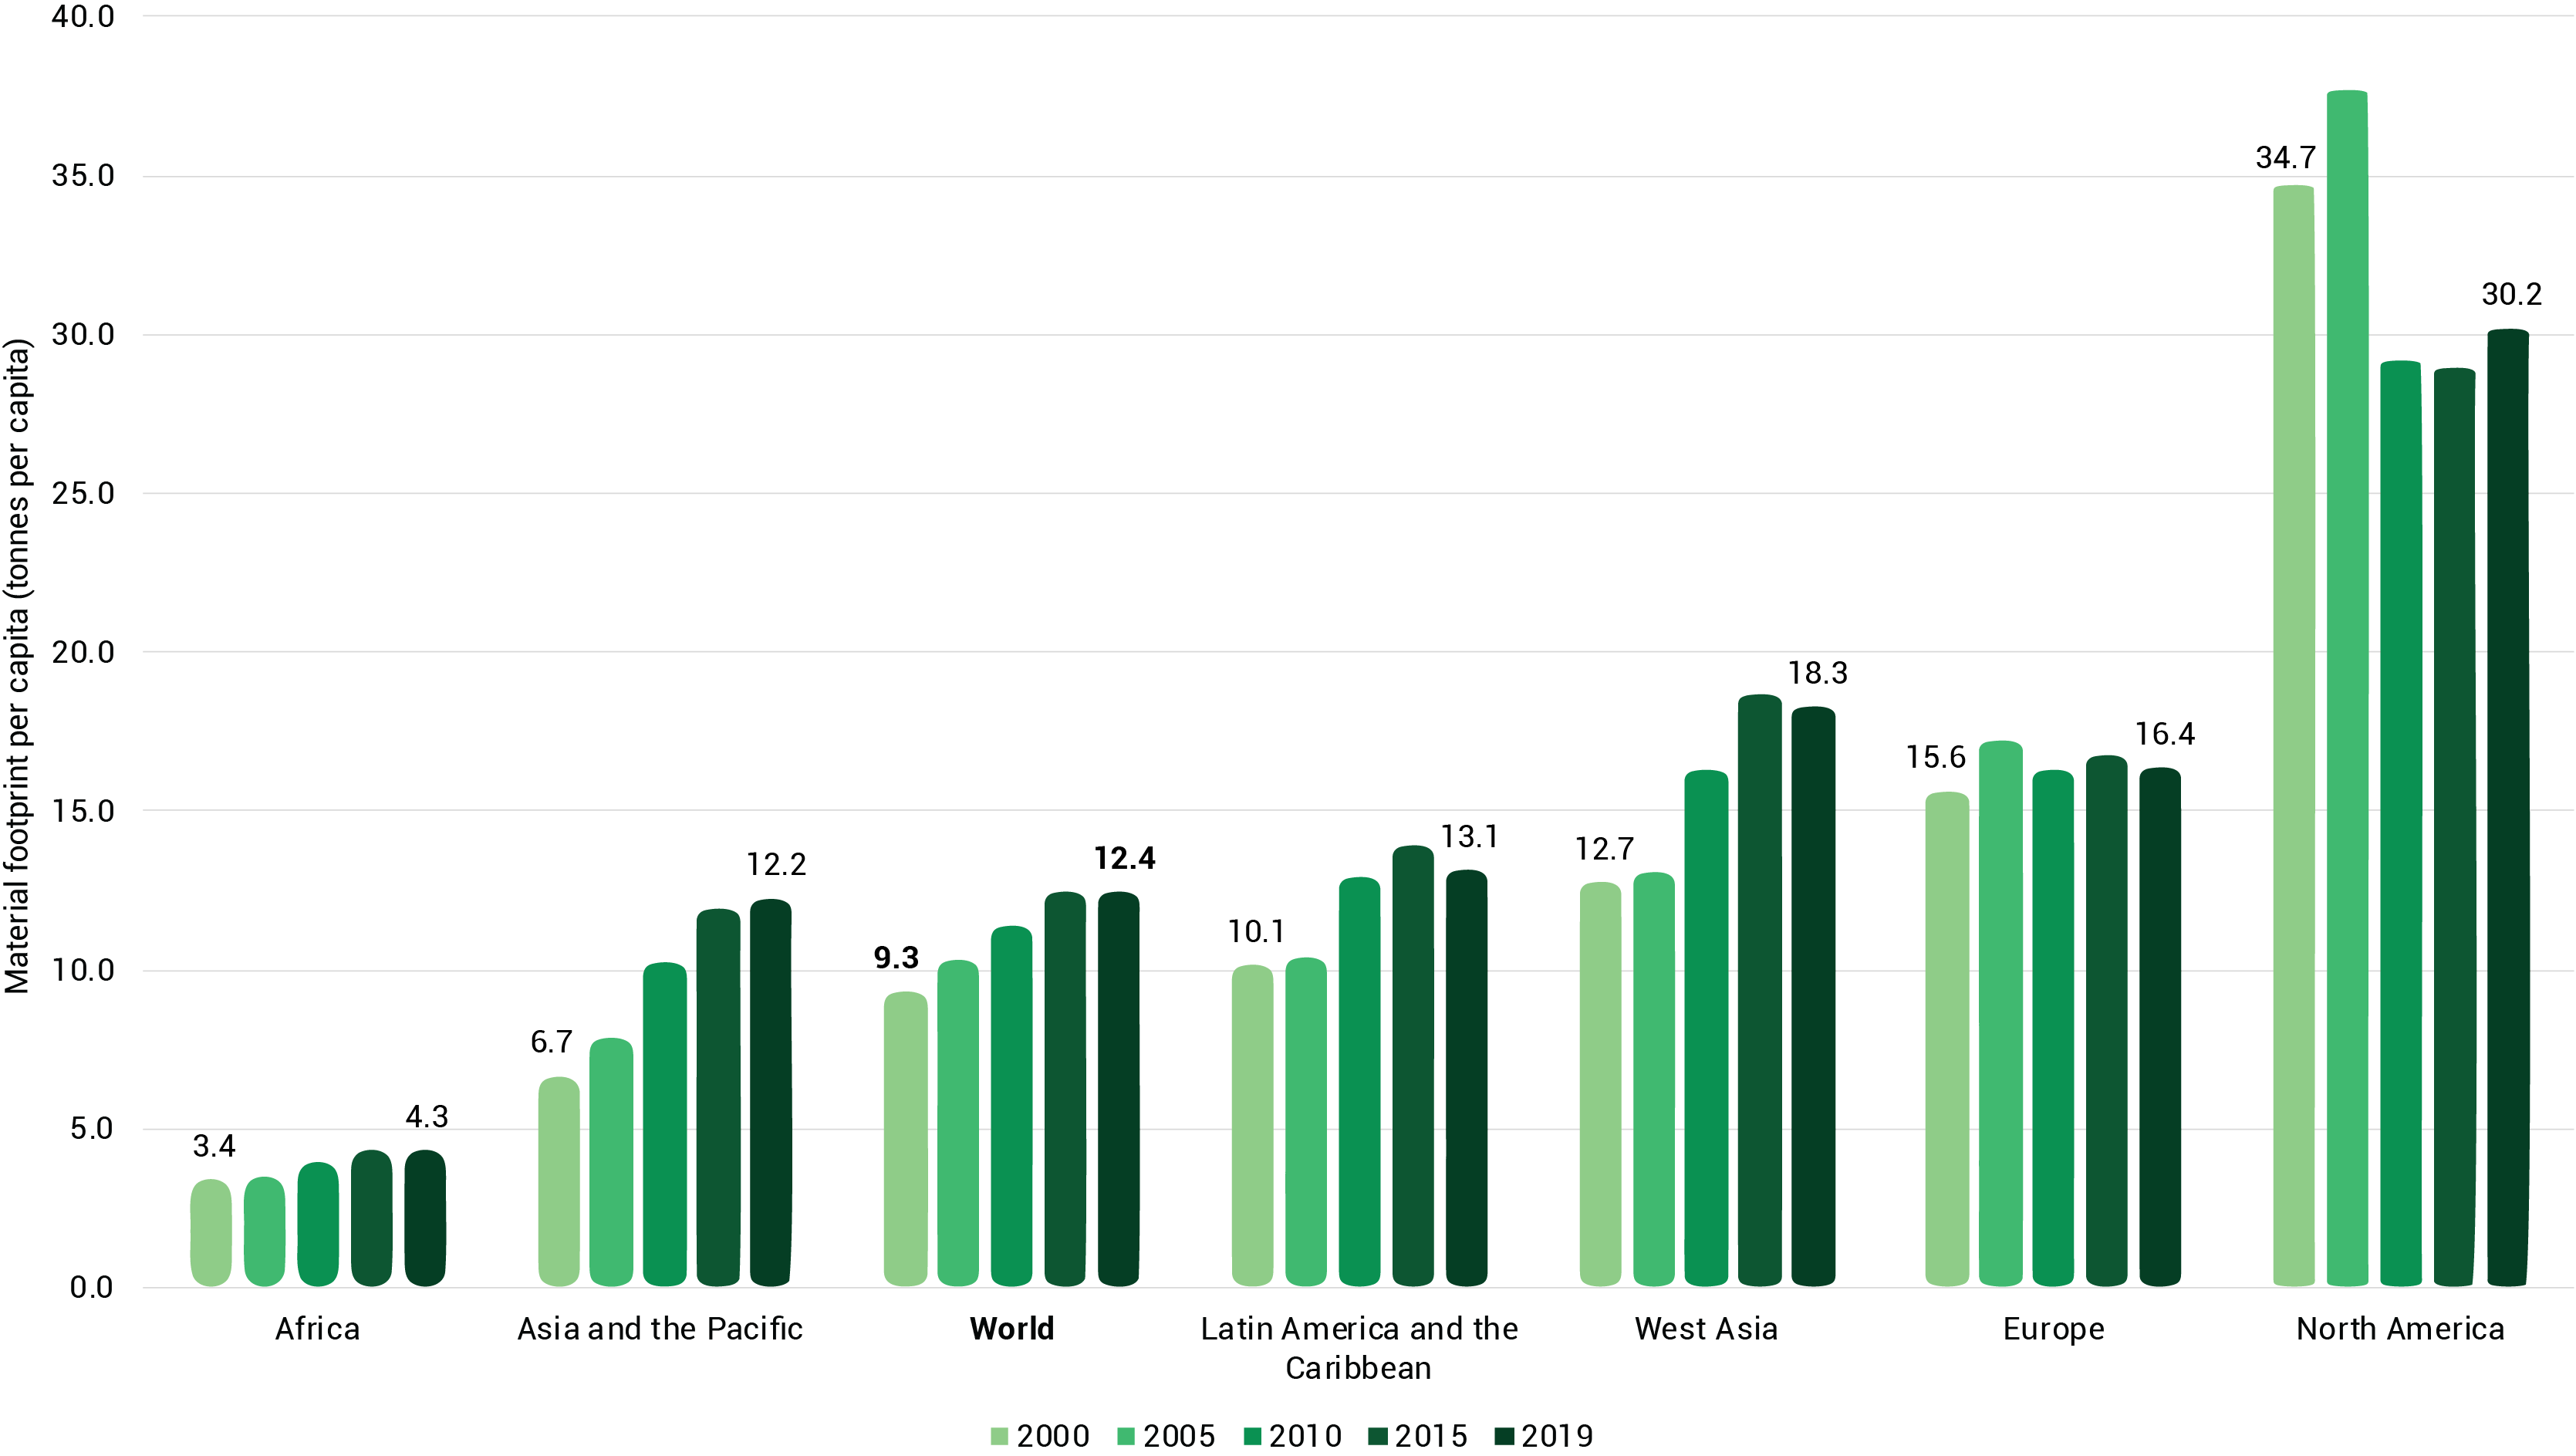
See detailed information▼ or Search the most up to date data
Indicator 8.4.1 is under SDG 8, “Promote sustained, inclusive and sustainable economic growth, full and productive employment and decent work for all”, Target 8.4: “Improve progressively through 2030 global resource efficiency in consumption and production, and endeavour to decouple economic growth from environmental degradation in accordance with the 10-year framework of programs on sustainable consumption and production with developed countries taking the lead”.
Indicator 12.2.1 is under SDG 12: “Ensure sustainable consumption and production patterns,” Target 12.2: “By 2030, achieve the sustainable management and efficient use of natural resources.”
Wastewater discharges can adversely affect not only freshwater ecosystems (see the section on freshwater pollution in Part 2), but also marine and coastal ones. Inadequate wastewater treatment increases the risk of human exposure to infectious disease. It can also result in releases of pollutants that degrade the environment, with adverse effects on marine life and the aquatic food chain (Bonin-Font et al. 2018).
The world’s reliance on natural resources has continued to accelerate in the last three decades. Between 2000 and 2019 the material footprint (MF) per capita increased more than 30 per cent globally and in all regions except North America and Europe. The highest growth rate can be observed in Asia and the Pacific, where MF per capita almost doubled between 2000 and 2019. An increase in the MF in some regions will still be required in order to improve the living standards of growing populations. However, to protect the environment globally it is essential to reduce raw materials extraction and improve the efficiency of materials use and reuse through recycling and, eventually, implementation of the circular economy (Wright et al. 2019; Smart Prosperity Institute 2021; UNEP n.d.c).
The material footprint of an economy refers to the amount of raw materials extracted across the entire supply chain to meet that economy’s final consumption demand. It reflects the volume of primary materials needed to meet basic human needs. Since raw materials are not found equally in all countries, some countries extract amounts of these materials that are beyond their own needs with the intention of exporting them (World Bank 2022a; OECD n.d.). The extraction and processing of raw materials have environmental, health, social and economic consequences within and beyond a country’s borders (OECD 2018; International Resource Panel 2019; OECD 2021; Lyatuu et al. 2021).
The extractive industries produce significant amounts of solid and liquid waste (UNEP 2017d; Garbarino, Orveillon and Saveyn 2020; Kulczycka and Dziobek 2021). This waste results in severe air, water (surface and aquifer) and soil contamination, which can damage ecosystems and reach large areas far from the source (Emmanuel, Jerry and Dzigbodi 2018; Lucas da Silva-Rêgo, Augusto de Almeida and Gasparotto 2022).
Hazardous chemicals used in mining include cyanide, sulphuric acid and mercury (The World Counts 2023b); ammonium nitrate may be used to blast tunnels and acetylene for welding and soldering (Baekken 2014; Hesperian Health Guides 2020). Human exposure to small particles from mining (e.g. dust, uranium, iron, lead, zinc, silicon, titanium, sulphur, nitrogen, platinum, chromium, vanadium, manganese and mercury) constitutes a major health risk (UNEP 2017d; Lucas da Silva-Rêgo, Augusto de Almeida and Gasparotto 2022). Growing material footprints and rates of domestic consumption are associated with increased production and use of chemicals and generation of waste. The planetary boundary for novel entities (i.e. the boundary related to environmental pollutants and other “novel entities” including plastics) has not been quantified, but it may have been exceeded as annual production and releases have been increasing at a pace that outstrips the global capacity for assessment and monitoring (Persson et al. 2022; Stockholm Resilience Centre 2022).
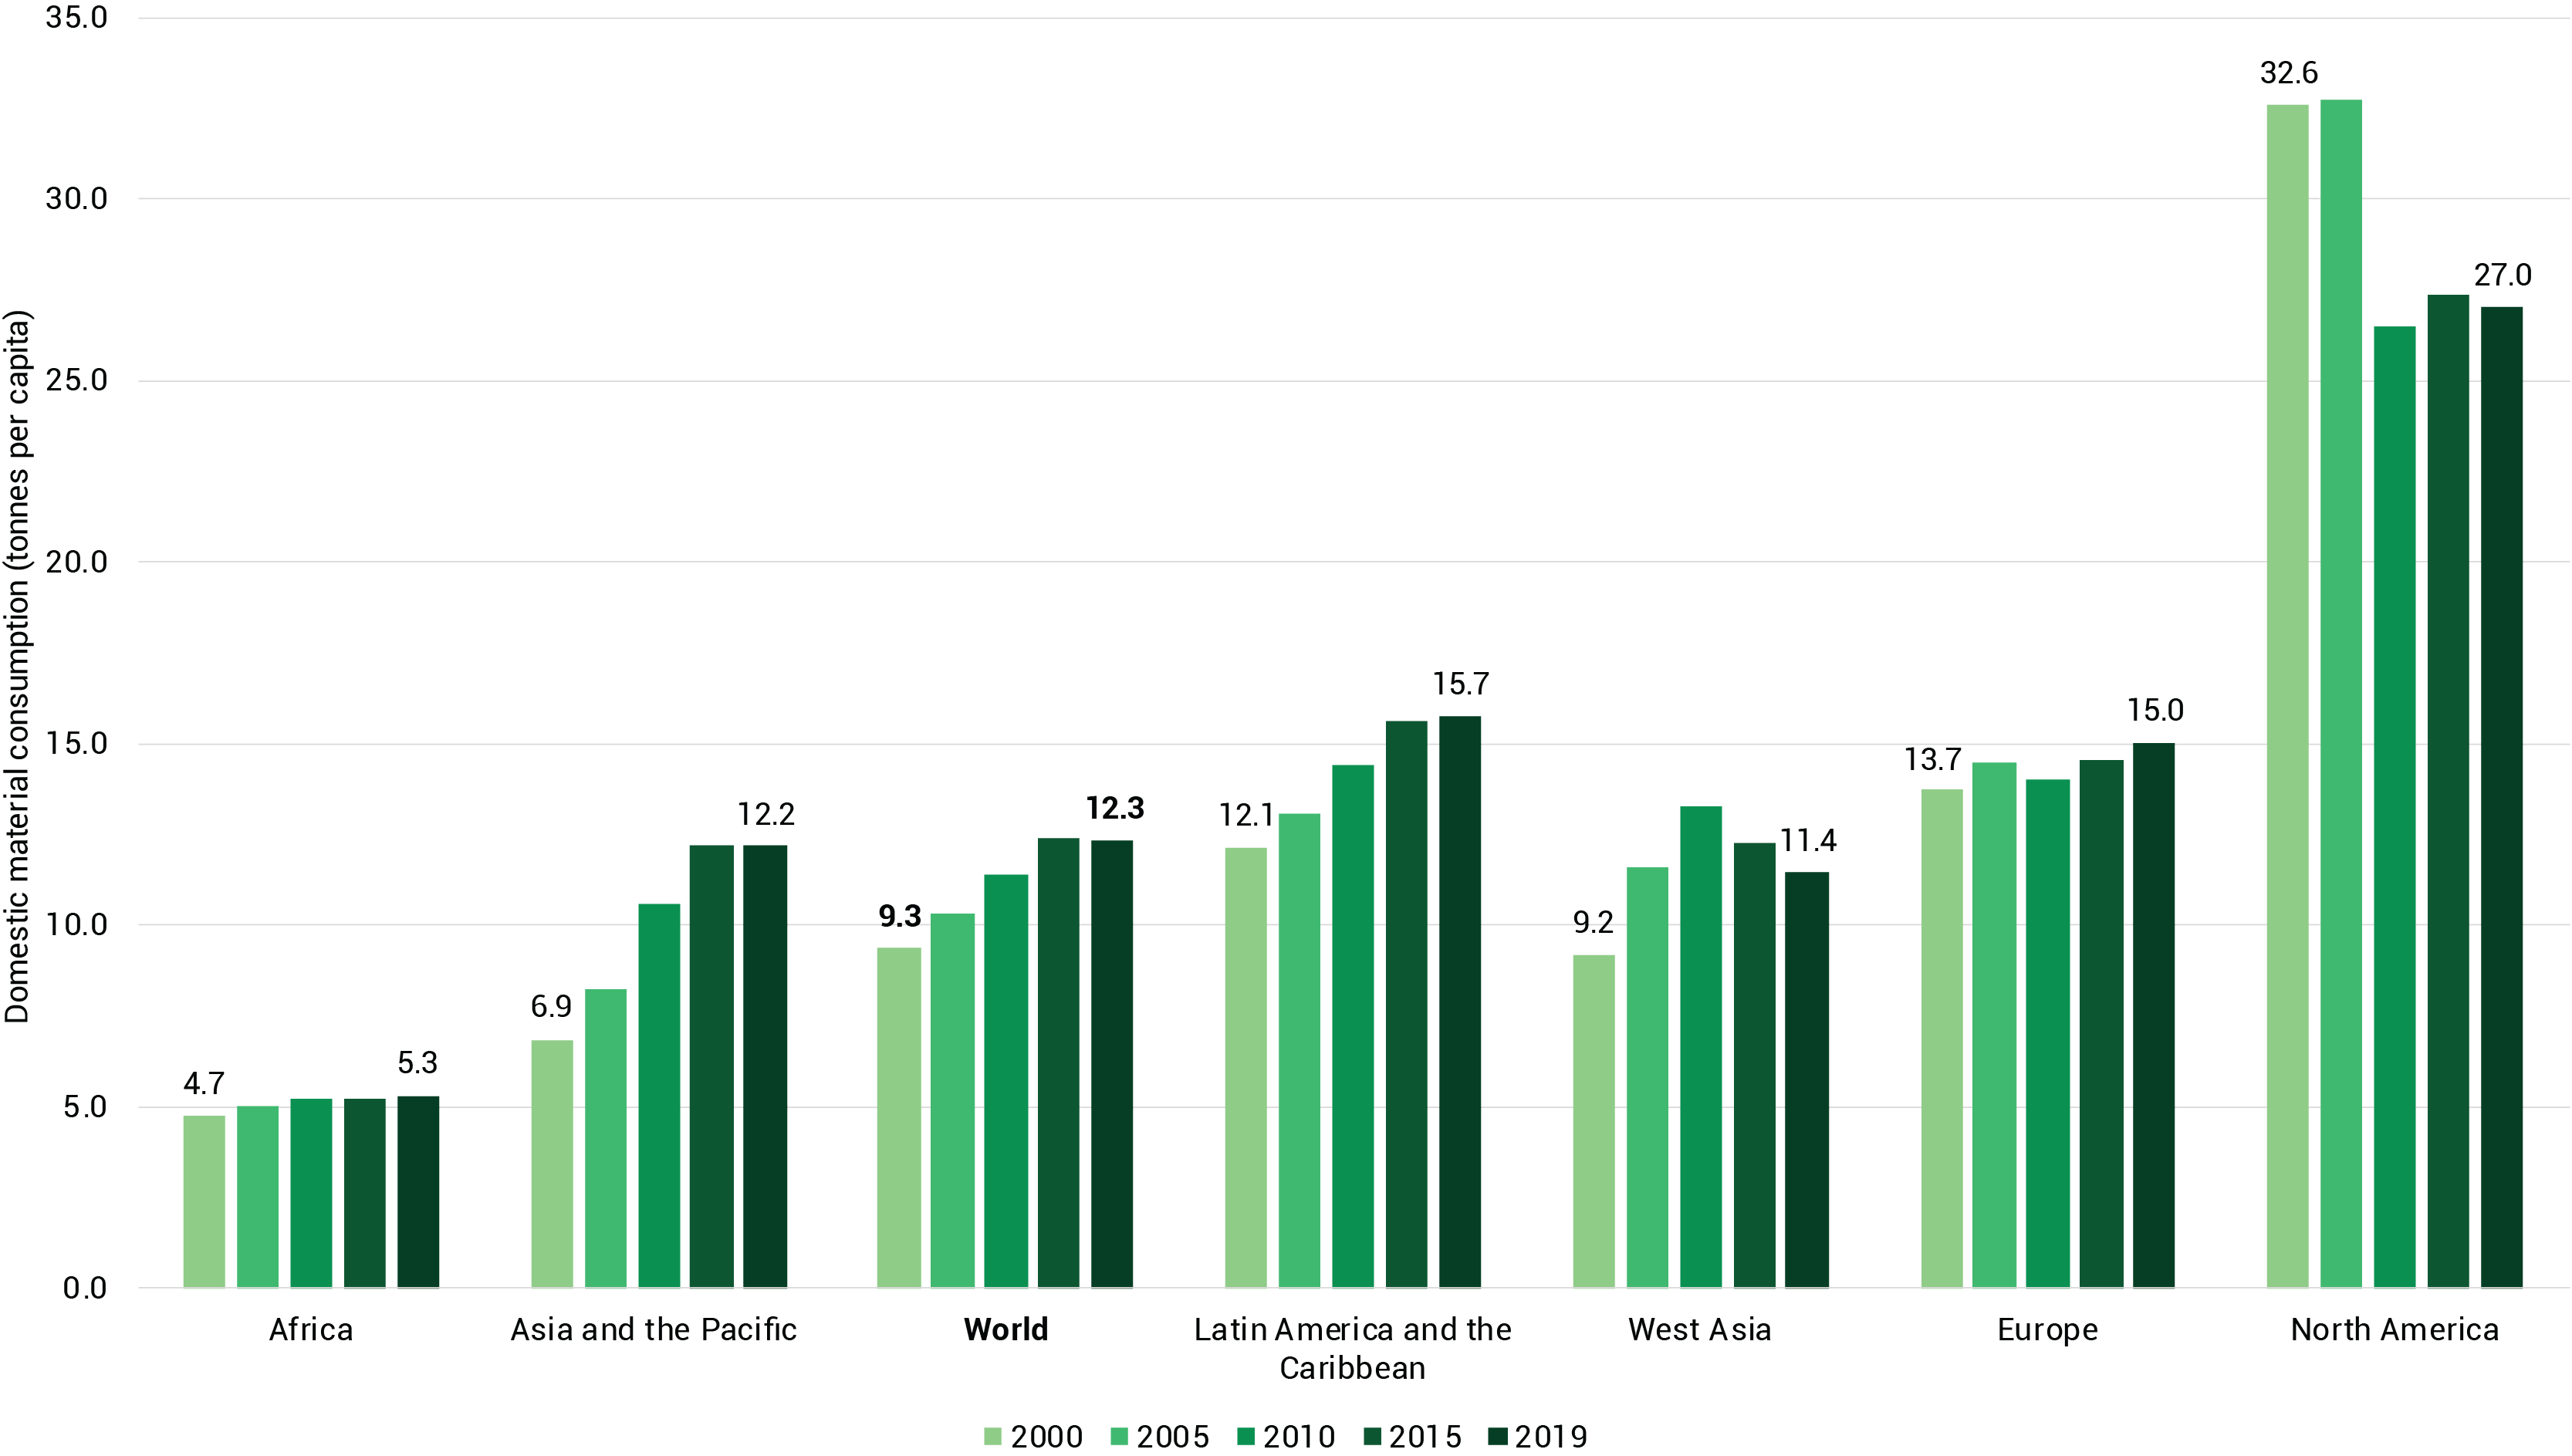
See detailed information▼ or Search the most up to date data
Indicator 8.4.2 is under SDG 8, “Promote sustained, inclusive and sustainable economic growth, full and productive employment and decent work for all”, Target 8.4: “Improve progressively through 2030 global resource efficiency in consumption and production, and endeavour to decouple economic growth from environmental degradation in accordance with the 10-year framework of programs on sustainable consumption and consumption and production with developed countries taking the lead”.
Indicator 12.2.2 is under SDG 12: “Ensure sustainable consumption and production patterns,” Target 12.2: “By 2030, achieve the sustainable management and efficient use of natural resources.”
Globally, annual domestic material consumption (DMC) per capita increased by more than 30 per cent from 9 metric tons (MT) per capita in 2000 to almost 12 MT in 2019. Significant increases could be observed in all regions except North America, where it fell by almost 17 per cent. The DMC in Asia and the Pacific increased sharply from 7 MT per capita in 2000 to 12 MT in 2017, mainly due to rapid industrialization during the last two decades (Nayyar 2019). Despite decreasing trends in North America, DMC per capita in that region still far exceeds the global average and that of other regions.
Domestic material consumption (DMC), like the material footprint (MF), measures materials flows and indicates the total amount of materials directly used by an economy for its production processes. The indicator measures potential environmental pressures on domestic territory, as it covers all material flows entering an economy that are eventually emitted back to the domestic environment as waste and emissions (Giljum, Bruckner and Martinez 2015). Manufacturing waste can be non-hazardous (solid, liquid and gaseous) or hazardous, with flammable, corrosive, active and toxic characteristics, causing significant pollution of the environment (Millati et al. 2019). As waste management is relatively limited in many countries, waste in these countries ends up being disposed in the environment with significant health and environmental impacts.
DMC does not consider upstream resources in the supply chain for traded goods. Thus it indicates only the actual weight of imported goods. However, outsourcing material-intensive extraction and processing eventually increases environmental burdens abroad (Wiedmann et al. 2015). A certain amount of, and an increase in, DMC is needed in emerging economies to meet people’s basic needs and ensure economic growth; however, in almost all regions increasing DMC is unsustainable and puts human health and the environment at risk.
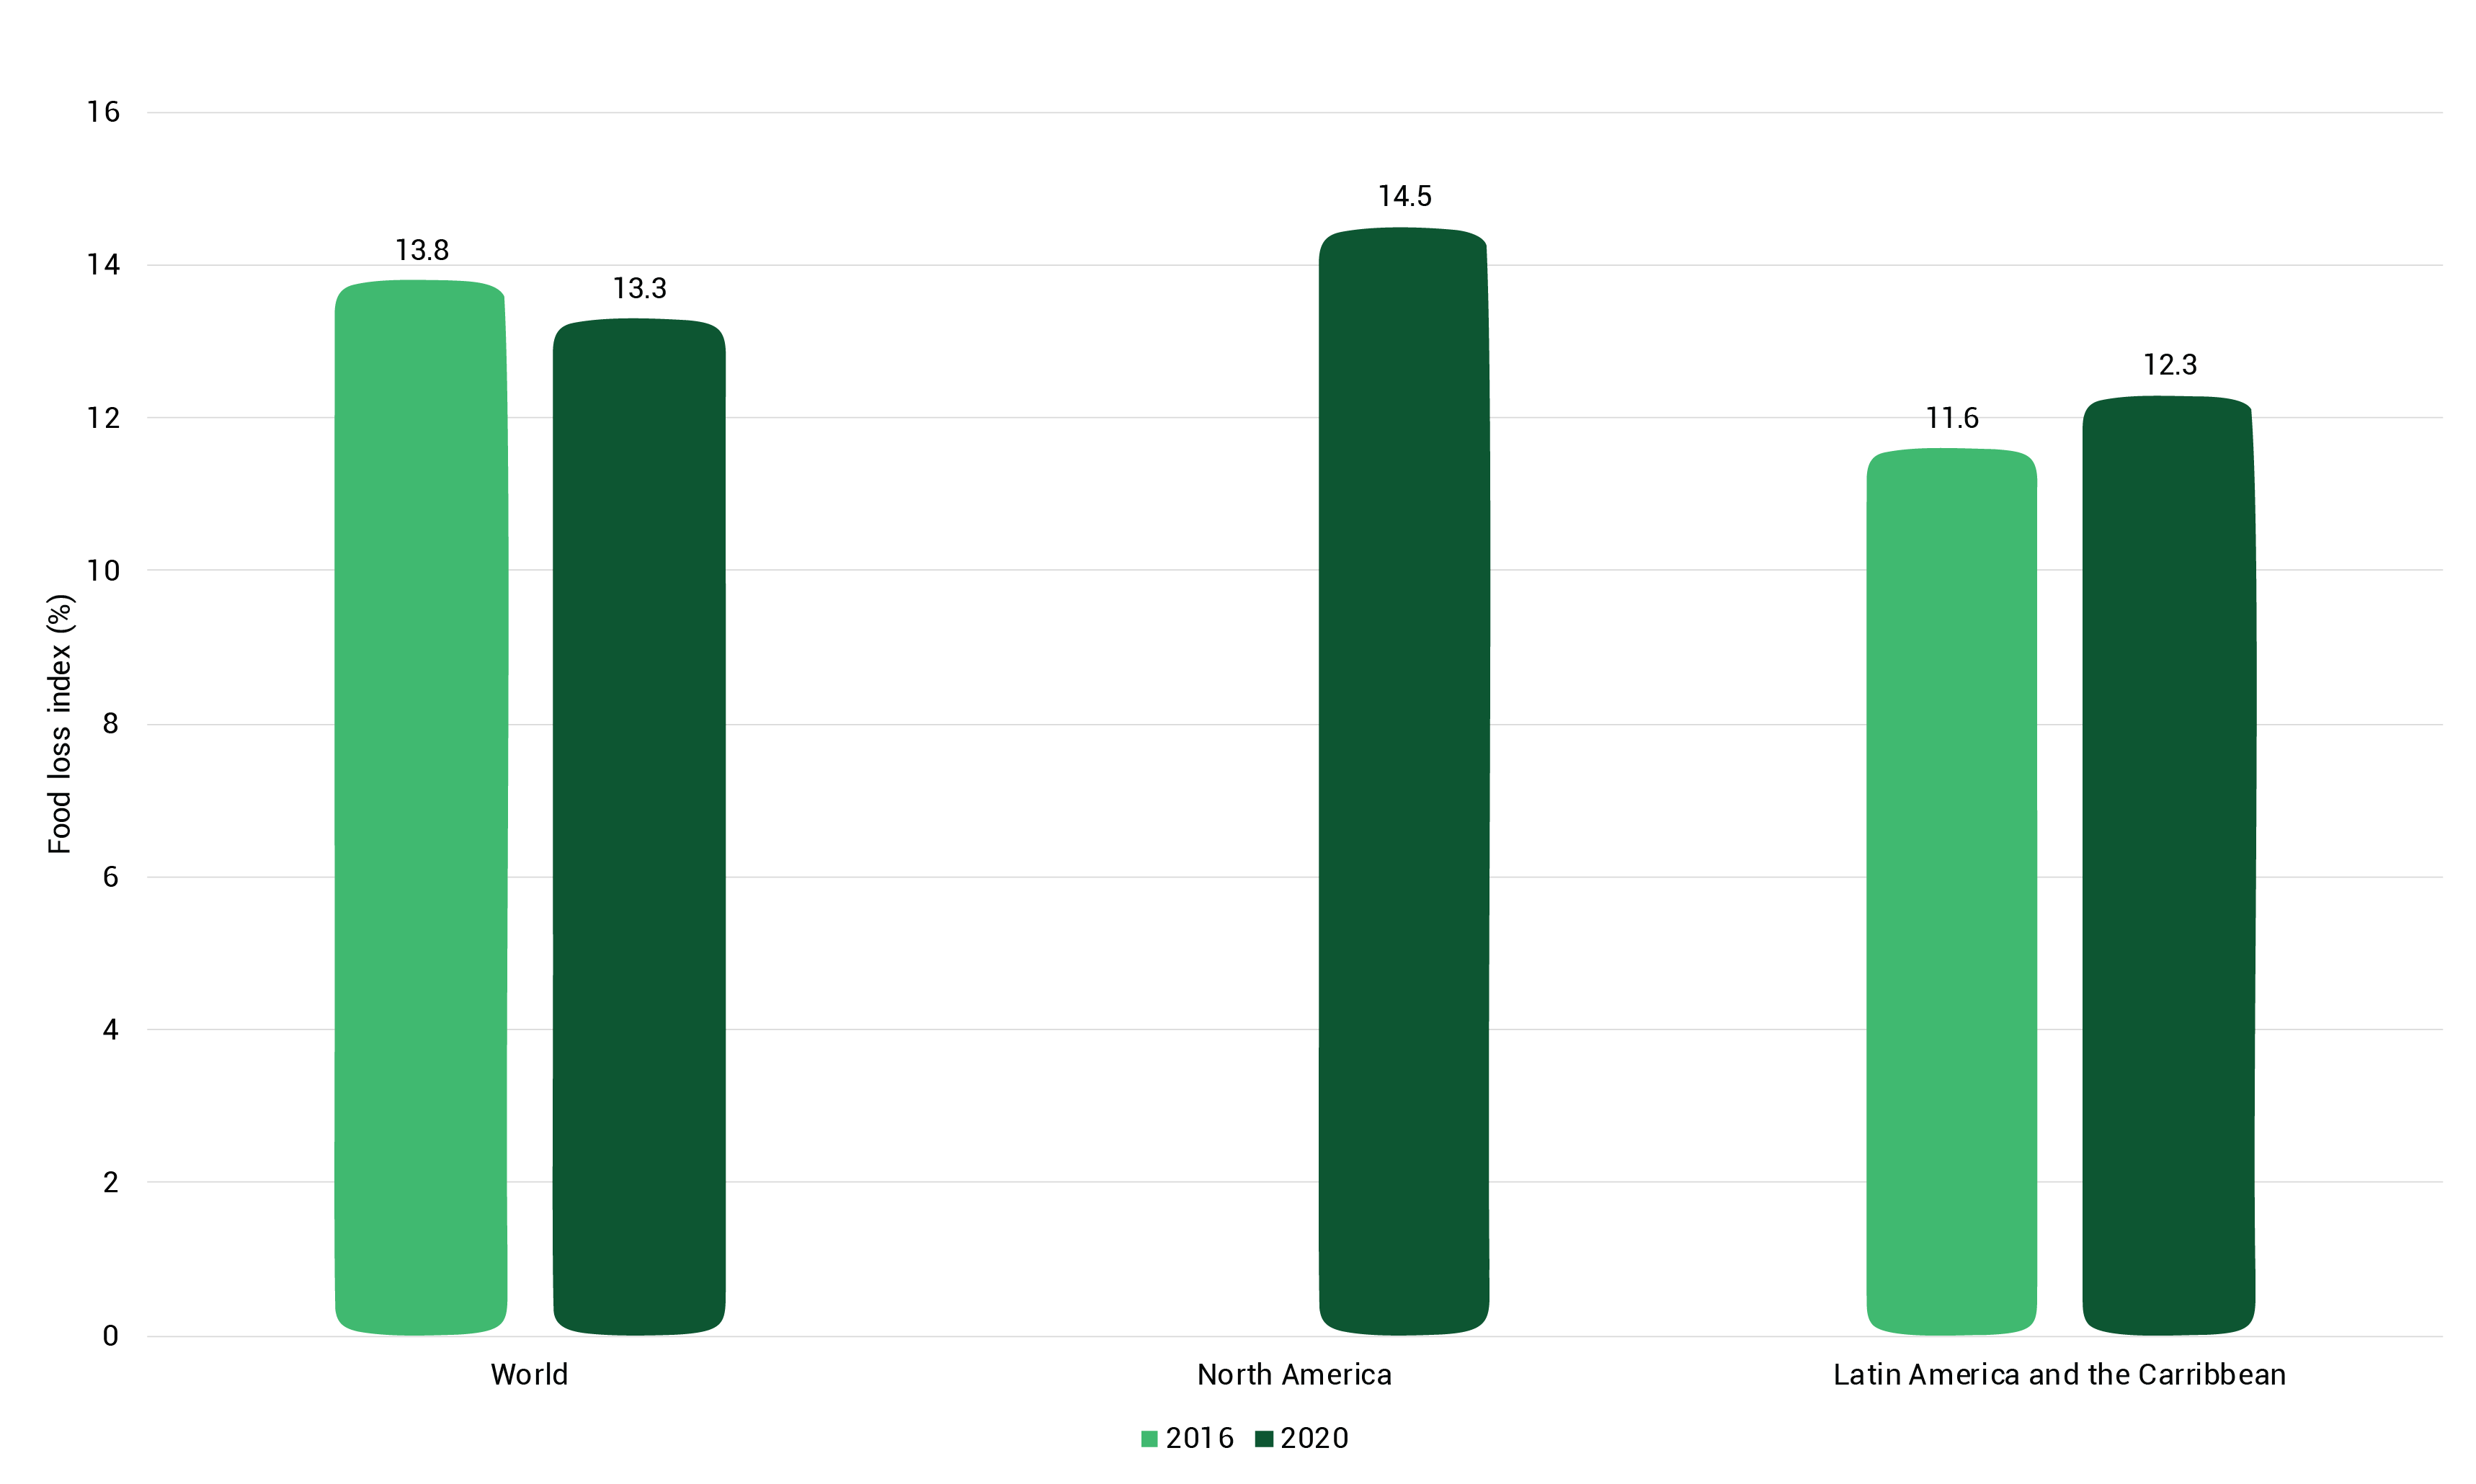
See detailed Information▼ or search the most up to date data
Indicator 12.3.a(a) is under SDG 12: “Ensure sustainable consumption and production patterns,” Target 12.3: “By 2030, halve per capita global food waste at the retail and consumer levels and reduce food losses along production and supply chains, including post-harvest losses.”
The global average for food loss stood at 13.3 per cent in 2020, a slight decrease compared with 13.8 per cent in 2016. Data for indicator 12.3.1(a) are scarce. Aggregated data are available for only a few regions. Further capacity building is necessary in order to acquire sufficient data on food loss and consequently initiate informed policy action.
About one-third of the world’s food is squandered or lost before it can be consumed, as the food that has been produced travels through various supply chains. Around 14 per cent is lost between harvest and retail. Significant quantities are also wasted in retail and at the consumption level. An estimated 17 per cent of total global food production is wasted (11 per cent in households, 5 per cent in the food service and 2 per cent in retail). This implies that one-third of the natural land resources, water and chemical inputs (pesticides and fertilizers) used to improve yield are also lost or wasted. Food that is lost and wasted accounts for 38 per cent of total energy usage in the global food system (United Nations 2022a; Food and Agriculture Organization of the United Nations [FAO] 2023).
Reducing food loss improves food security and nutrition and decreases pollution. It lowers production costs (e.g. though lower energy consumption, less use of pesticides and fertilizers) and increases the efficiencies of food systems, easing pressures on natural resources and reducing pollution by waste (FAO 2023).
Food loss has negative economic and environmental impacts. Economically it represents wasted investments that reduce farmers’ incomes while increasing costs to the consumer; adverse environmental effects include unnecessary GHG emissions and greater inefficiencies in water usage and land consumption (Lipinski et al. 2013; FAO 2017; Munoz and Antehm 2021). Reducing food loss can limit the toll exacted on human health and the environment by global food systems (Read et al. 2019).
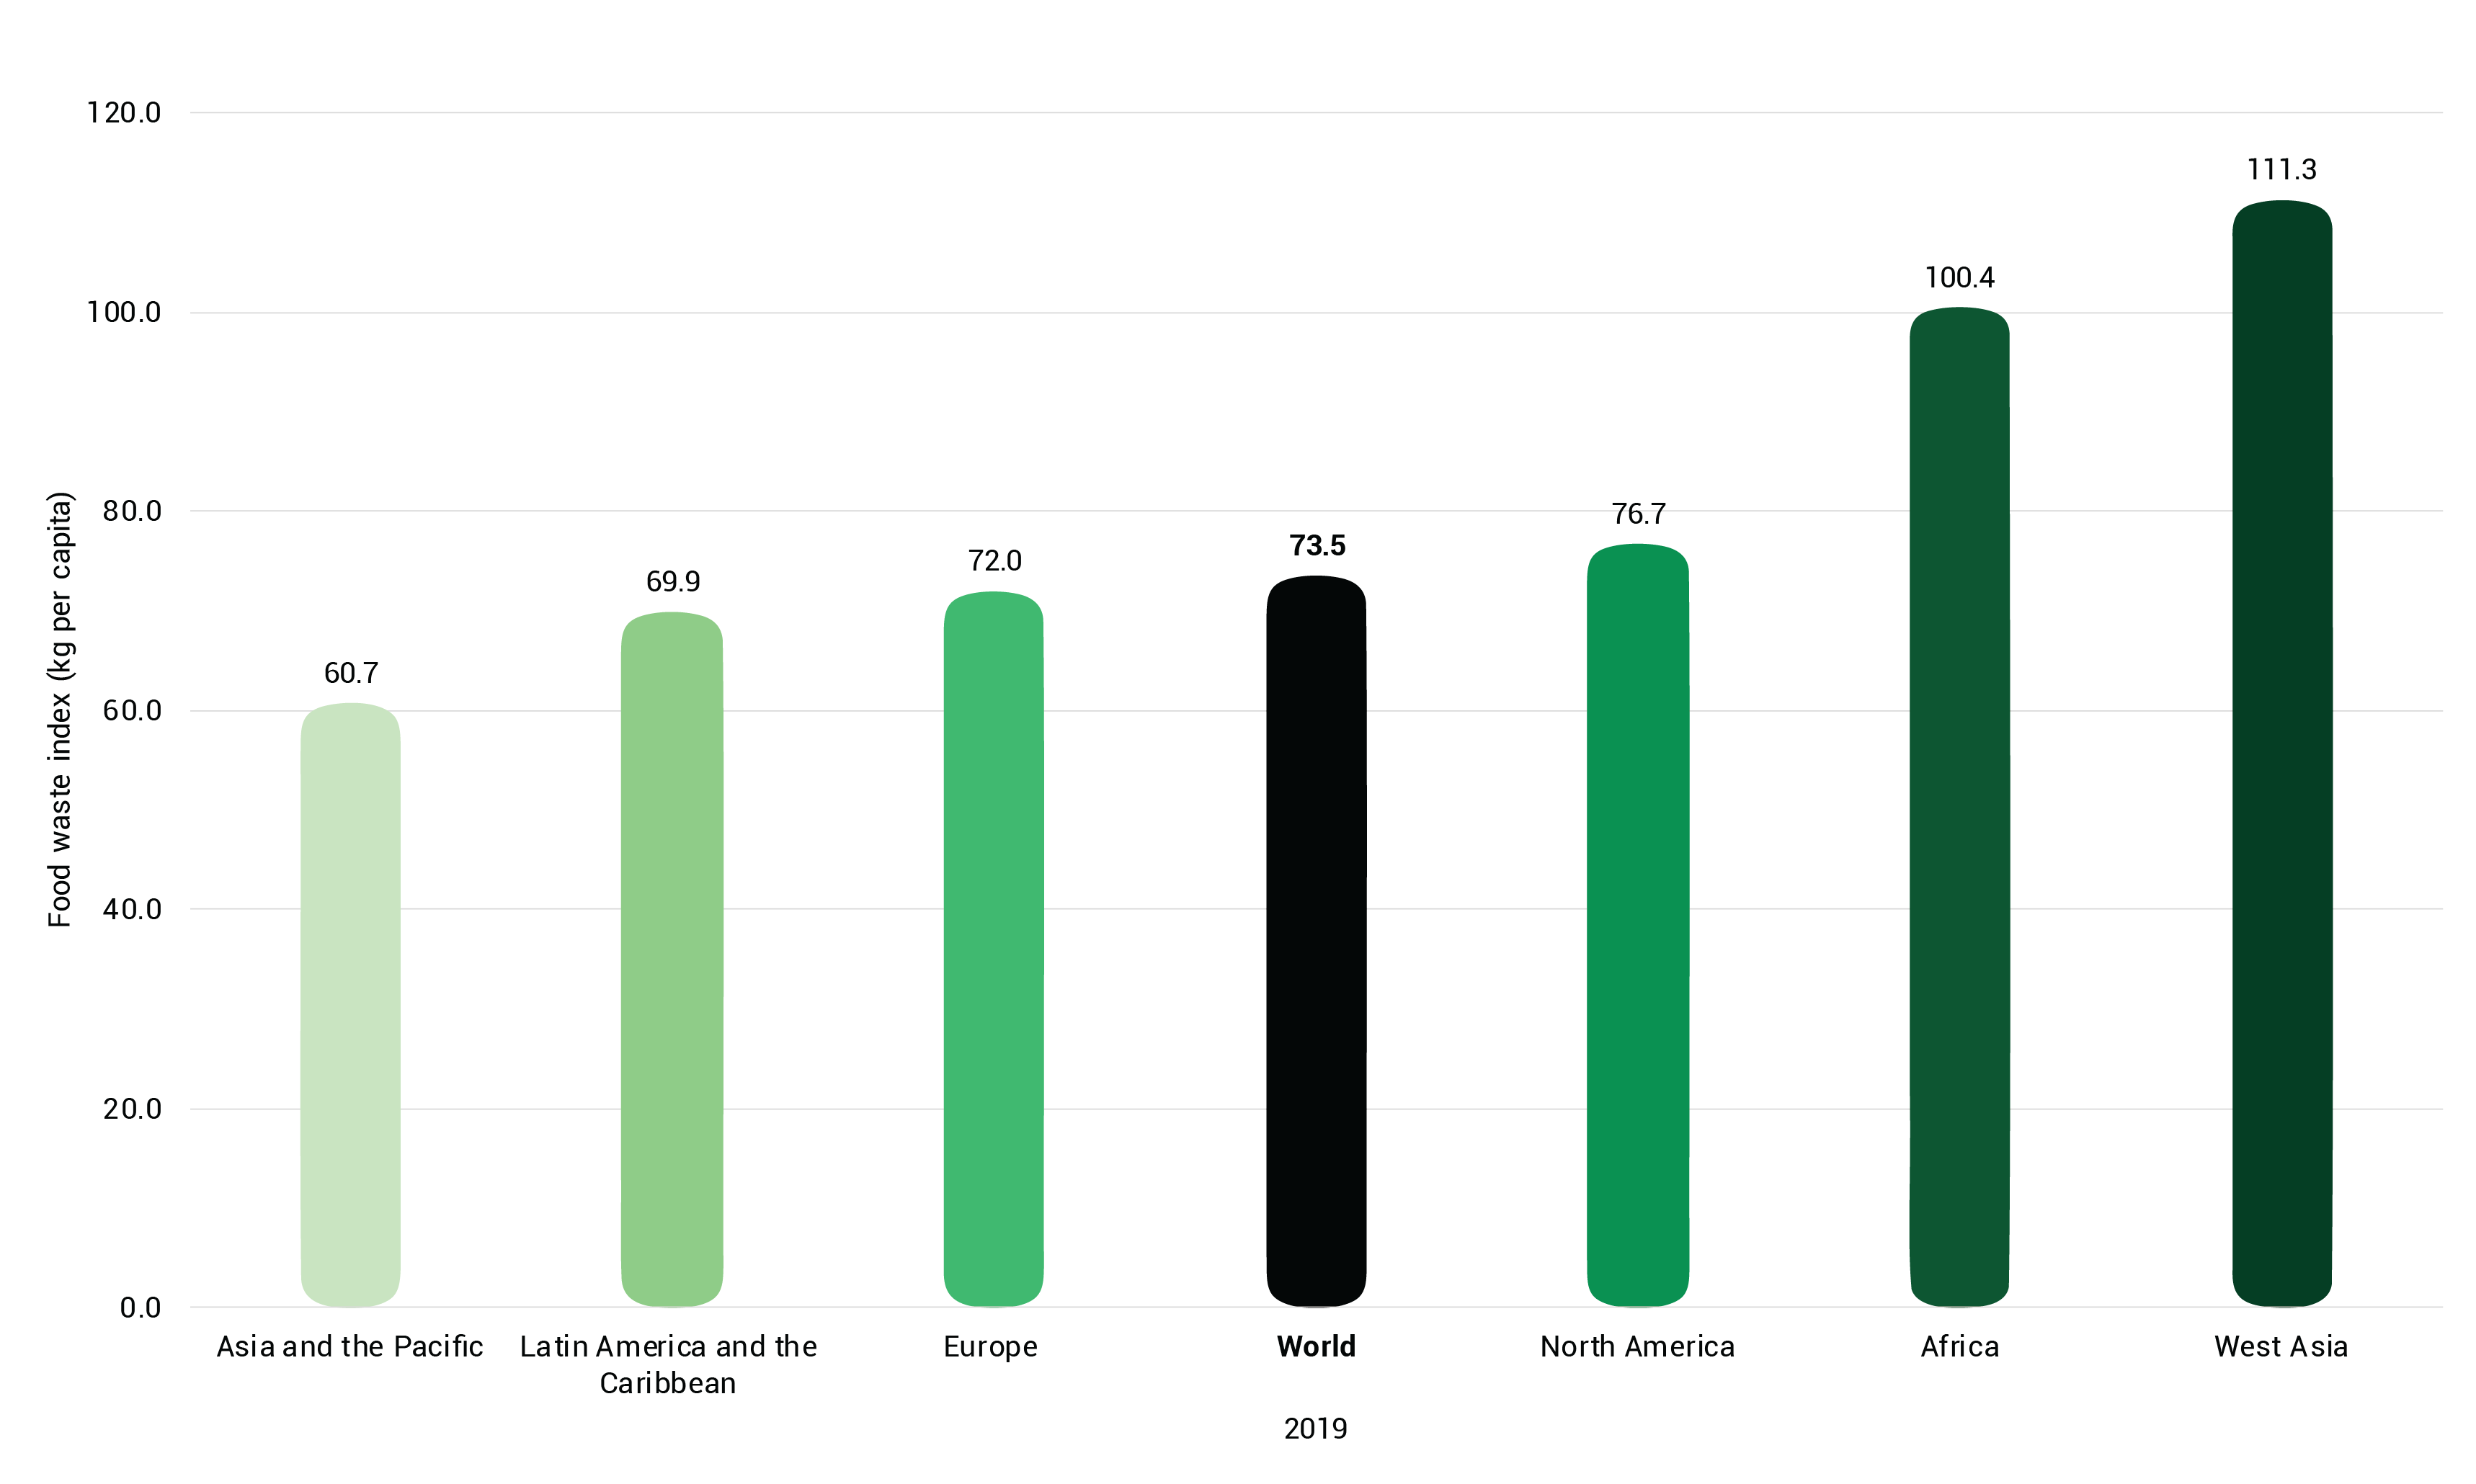
See detailed information▼ or Search the most up to date data
Similar to indicator 12.3.1(a), indicator 12.3.a(a) is under SDG 12: “Ensure sustainable consumption and production patterns,” Target 12.3: “By 2030, halve per capita global food waste at the retail and consumer levels and reduce food losses along production and supply chains, including post-harvest losses.”
Data for SDG indicator 12.3.1(b) are available for 2019. Globally, there was 73 kg of food waste per person in that year. This average was significantly exceeded in Africa and West Asia, while the lowest rate of food waste was in Asia and the Pacific at around 61 kg per capita.
Food waste refers to a decrease in the quantity or quality of food resulting from decisions and actions by retailers, food service providers and consumers. Like the food loss index, the food waste index covers both the amount of food wasted and the consequences. Reducing food loss and food waste would lead to more efficient land use and better management of water resources, with positive impacts on climate change and livelihoods (United Nations 2022a; FAO 2023).
Food waste results in economic losses and increasing pressures on food systems as they attempt to maintain economic viability and meet global consumption demands. It has adverse impacts on ecosystems (FAO 2017) and biodiversity (Benton et al. 2021; Read, Hondula and Muth 2022). Reducing food waste is critical in order to maximize the value of agricultural land and limit environmental damage, such as that resulting from emissions of insecticide volatile organic compounds (VOCs) (Yang et al. 2023) and leaching of heavy metals during food waste composting (Chu et al. 2019).
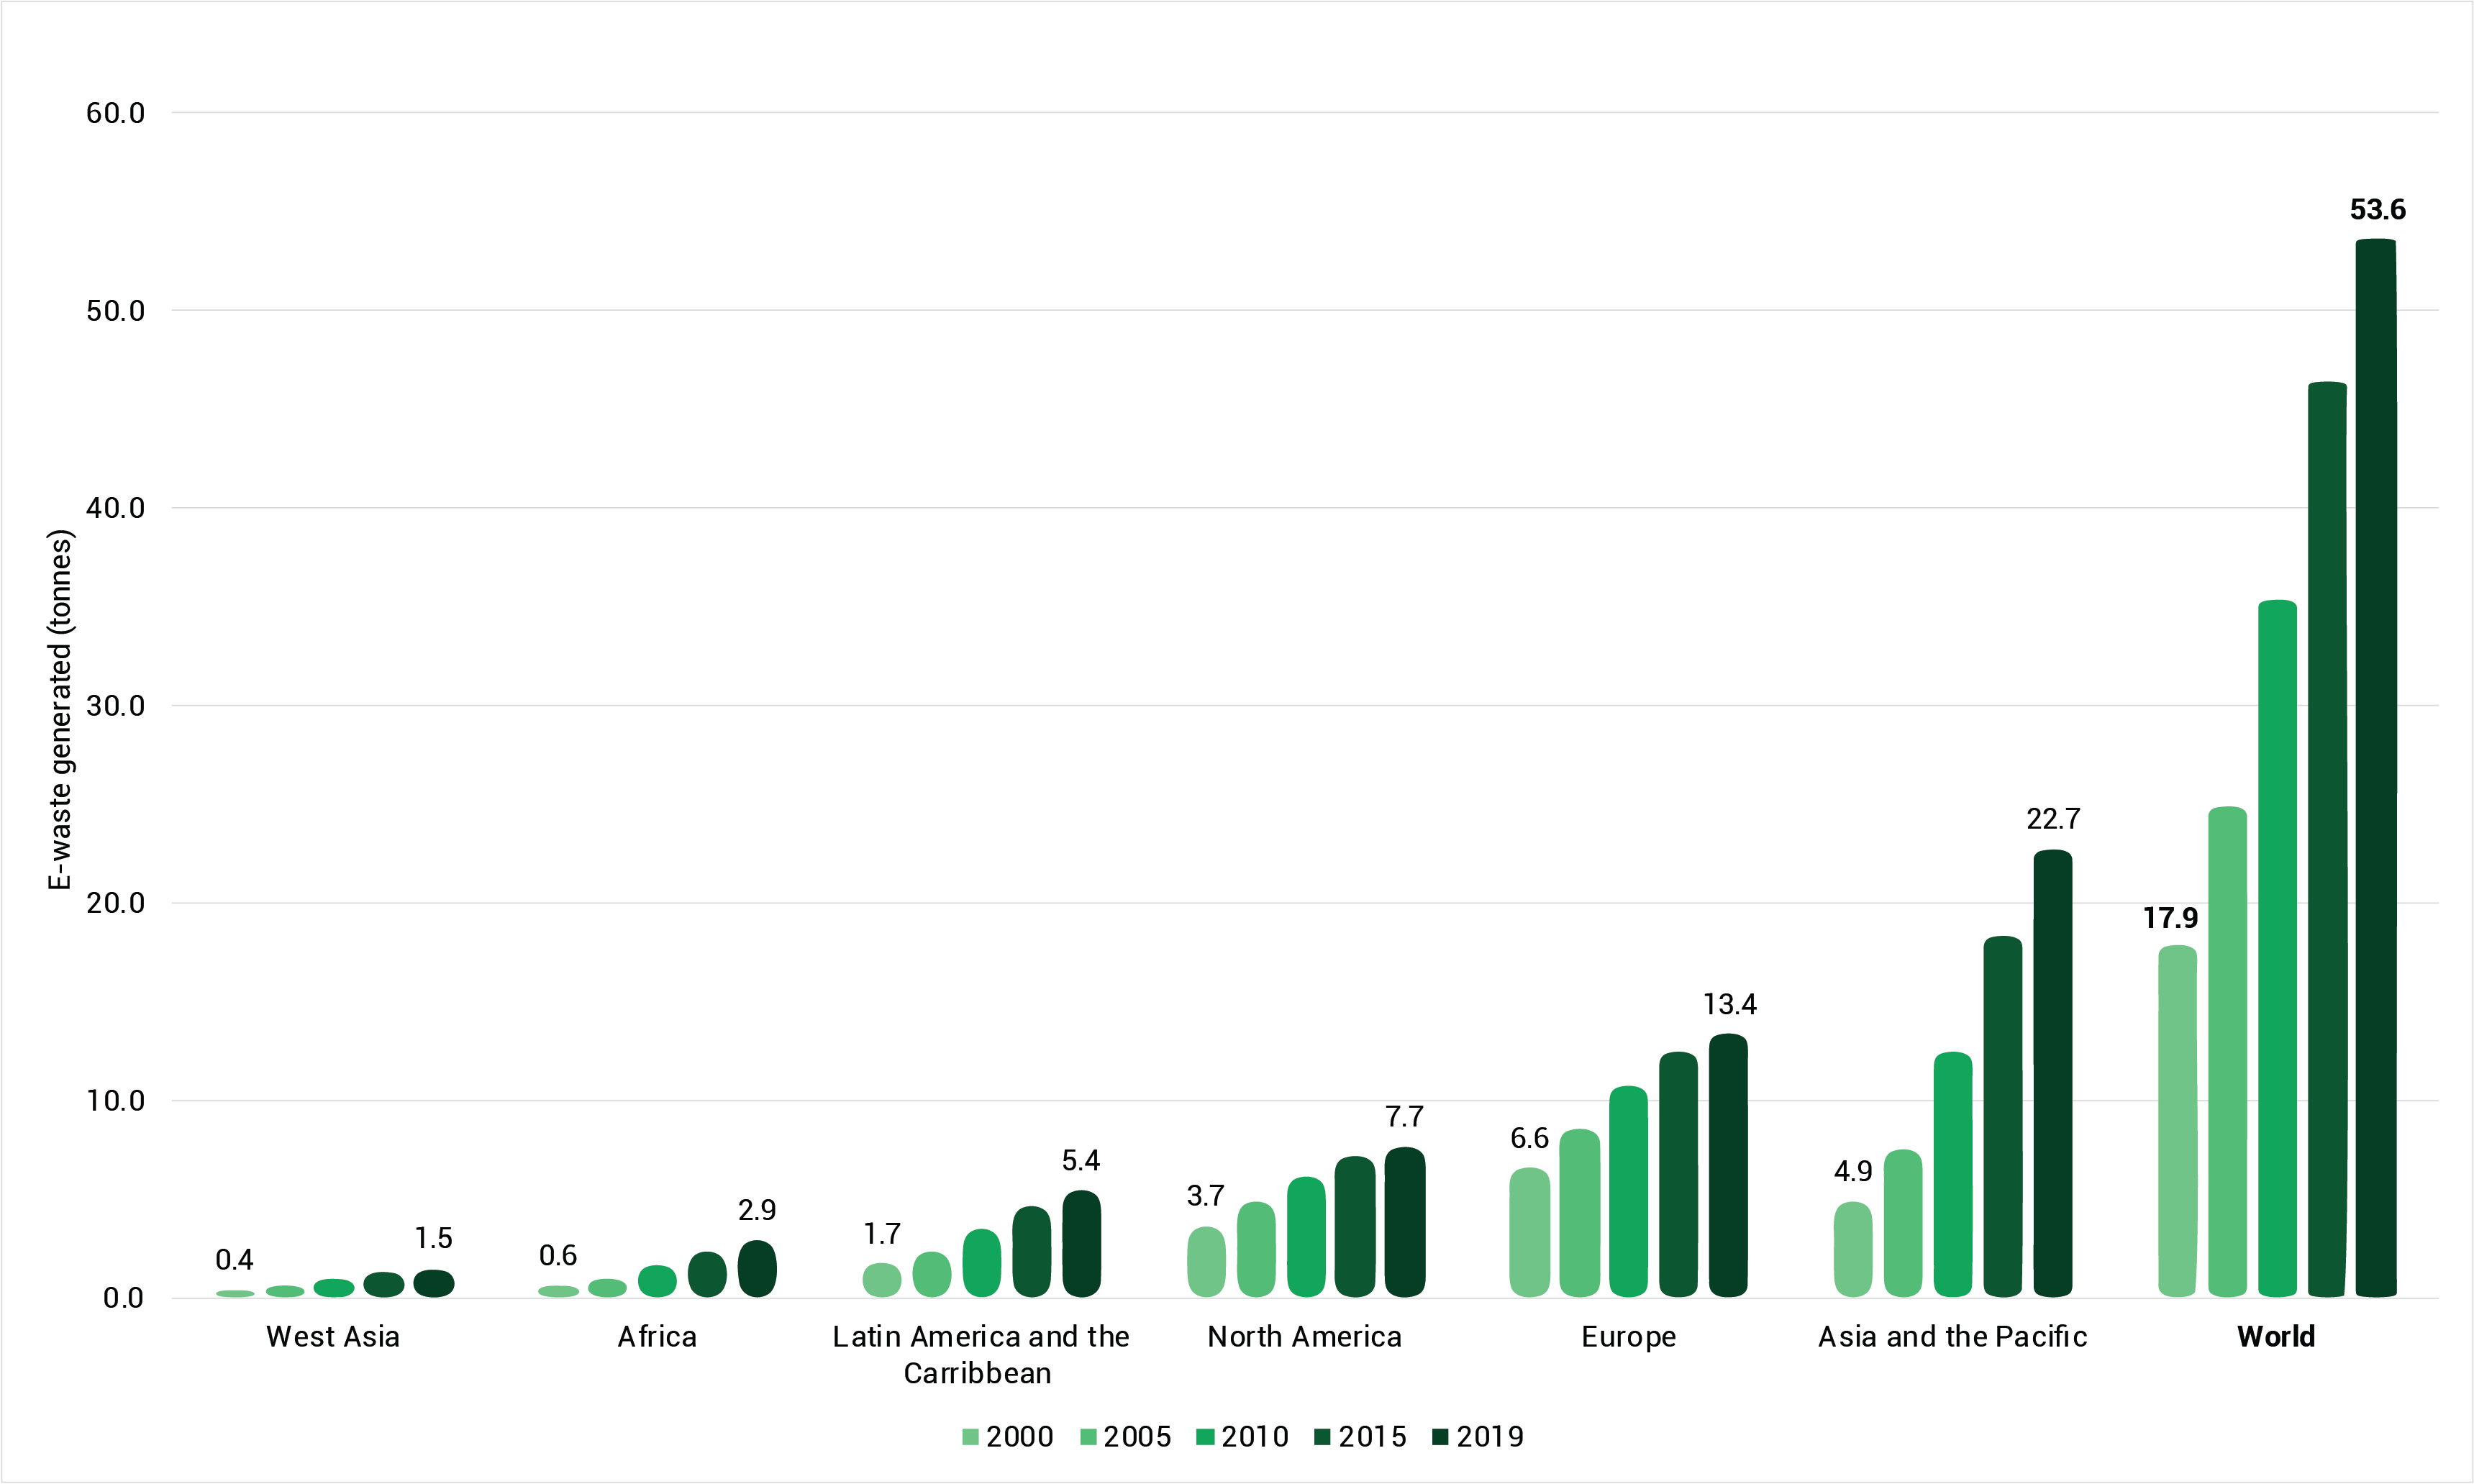
See detailed information▼ or Search the most up to date data
Indicator 12.4.2(a) is under SDG 12: “Ensure sustainable consumption and production patterns,” Target 12.4: “By 2020, achieve the environmentally sound management of chemicals and all wastes throughout their life cycle, in accordance with agreed international frameworks, and significantly reduce their release to air, water and soil in order to minimize their adverse impacts on human health and the environment.” This target for 2020 was not met (UNEP 2019a).
Global e-waste generation per person almost tripled between 2000 and 2019 (from 17.9 million tons to 53.6 MT). All regions show similar trends, with the greatest increase (in percentage and total amount generated) in Asia and the Pacific, which accounted for more than 40 per cent of e-waste generated in 2019 followed by Europe and North America (25 and 14 per cent, respectively). Africa accounted for only around 5 per cent of the total, although its e-waste generation rate increased almost five-fold during this period. E-waste generation in the regions and globally is expected to continue to rise during the next few years, with an expected volume generated of 75 MT by 2030 (Forti et al. 2020).
Economic growth and emerging technologies have led to a diversification of the types and an increase in the volumes of hazardous chemicals and other toxic substances used in industry, many of which, at the end of their life cycle, inevitably become hazardous chemical waste (UNEP 2019a). Electric and electronic waste (e-waste) is of growing concern around the world. Rapid technological advancements, greater automation, and an increasing number of users of electric and electronic equipment (EEE) have led to an exponential increase in e-waste generation in the last two decades (Kumar, Holuszko and Espinosa 2017; Forti et al. 2020; Rosane 2021; Duboust 2022). Relevant hazardous waste legislation and official take-back systems are necessary to ease the enormous pressures created by the complex pollution mixtures in e-waste (Nithya, Sivasankari and Thirunavukkarasu 2020; Miner 2022).
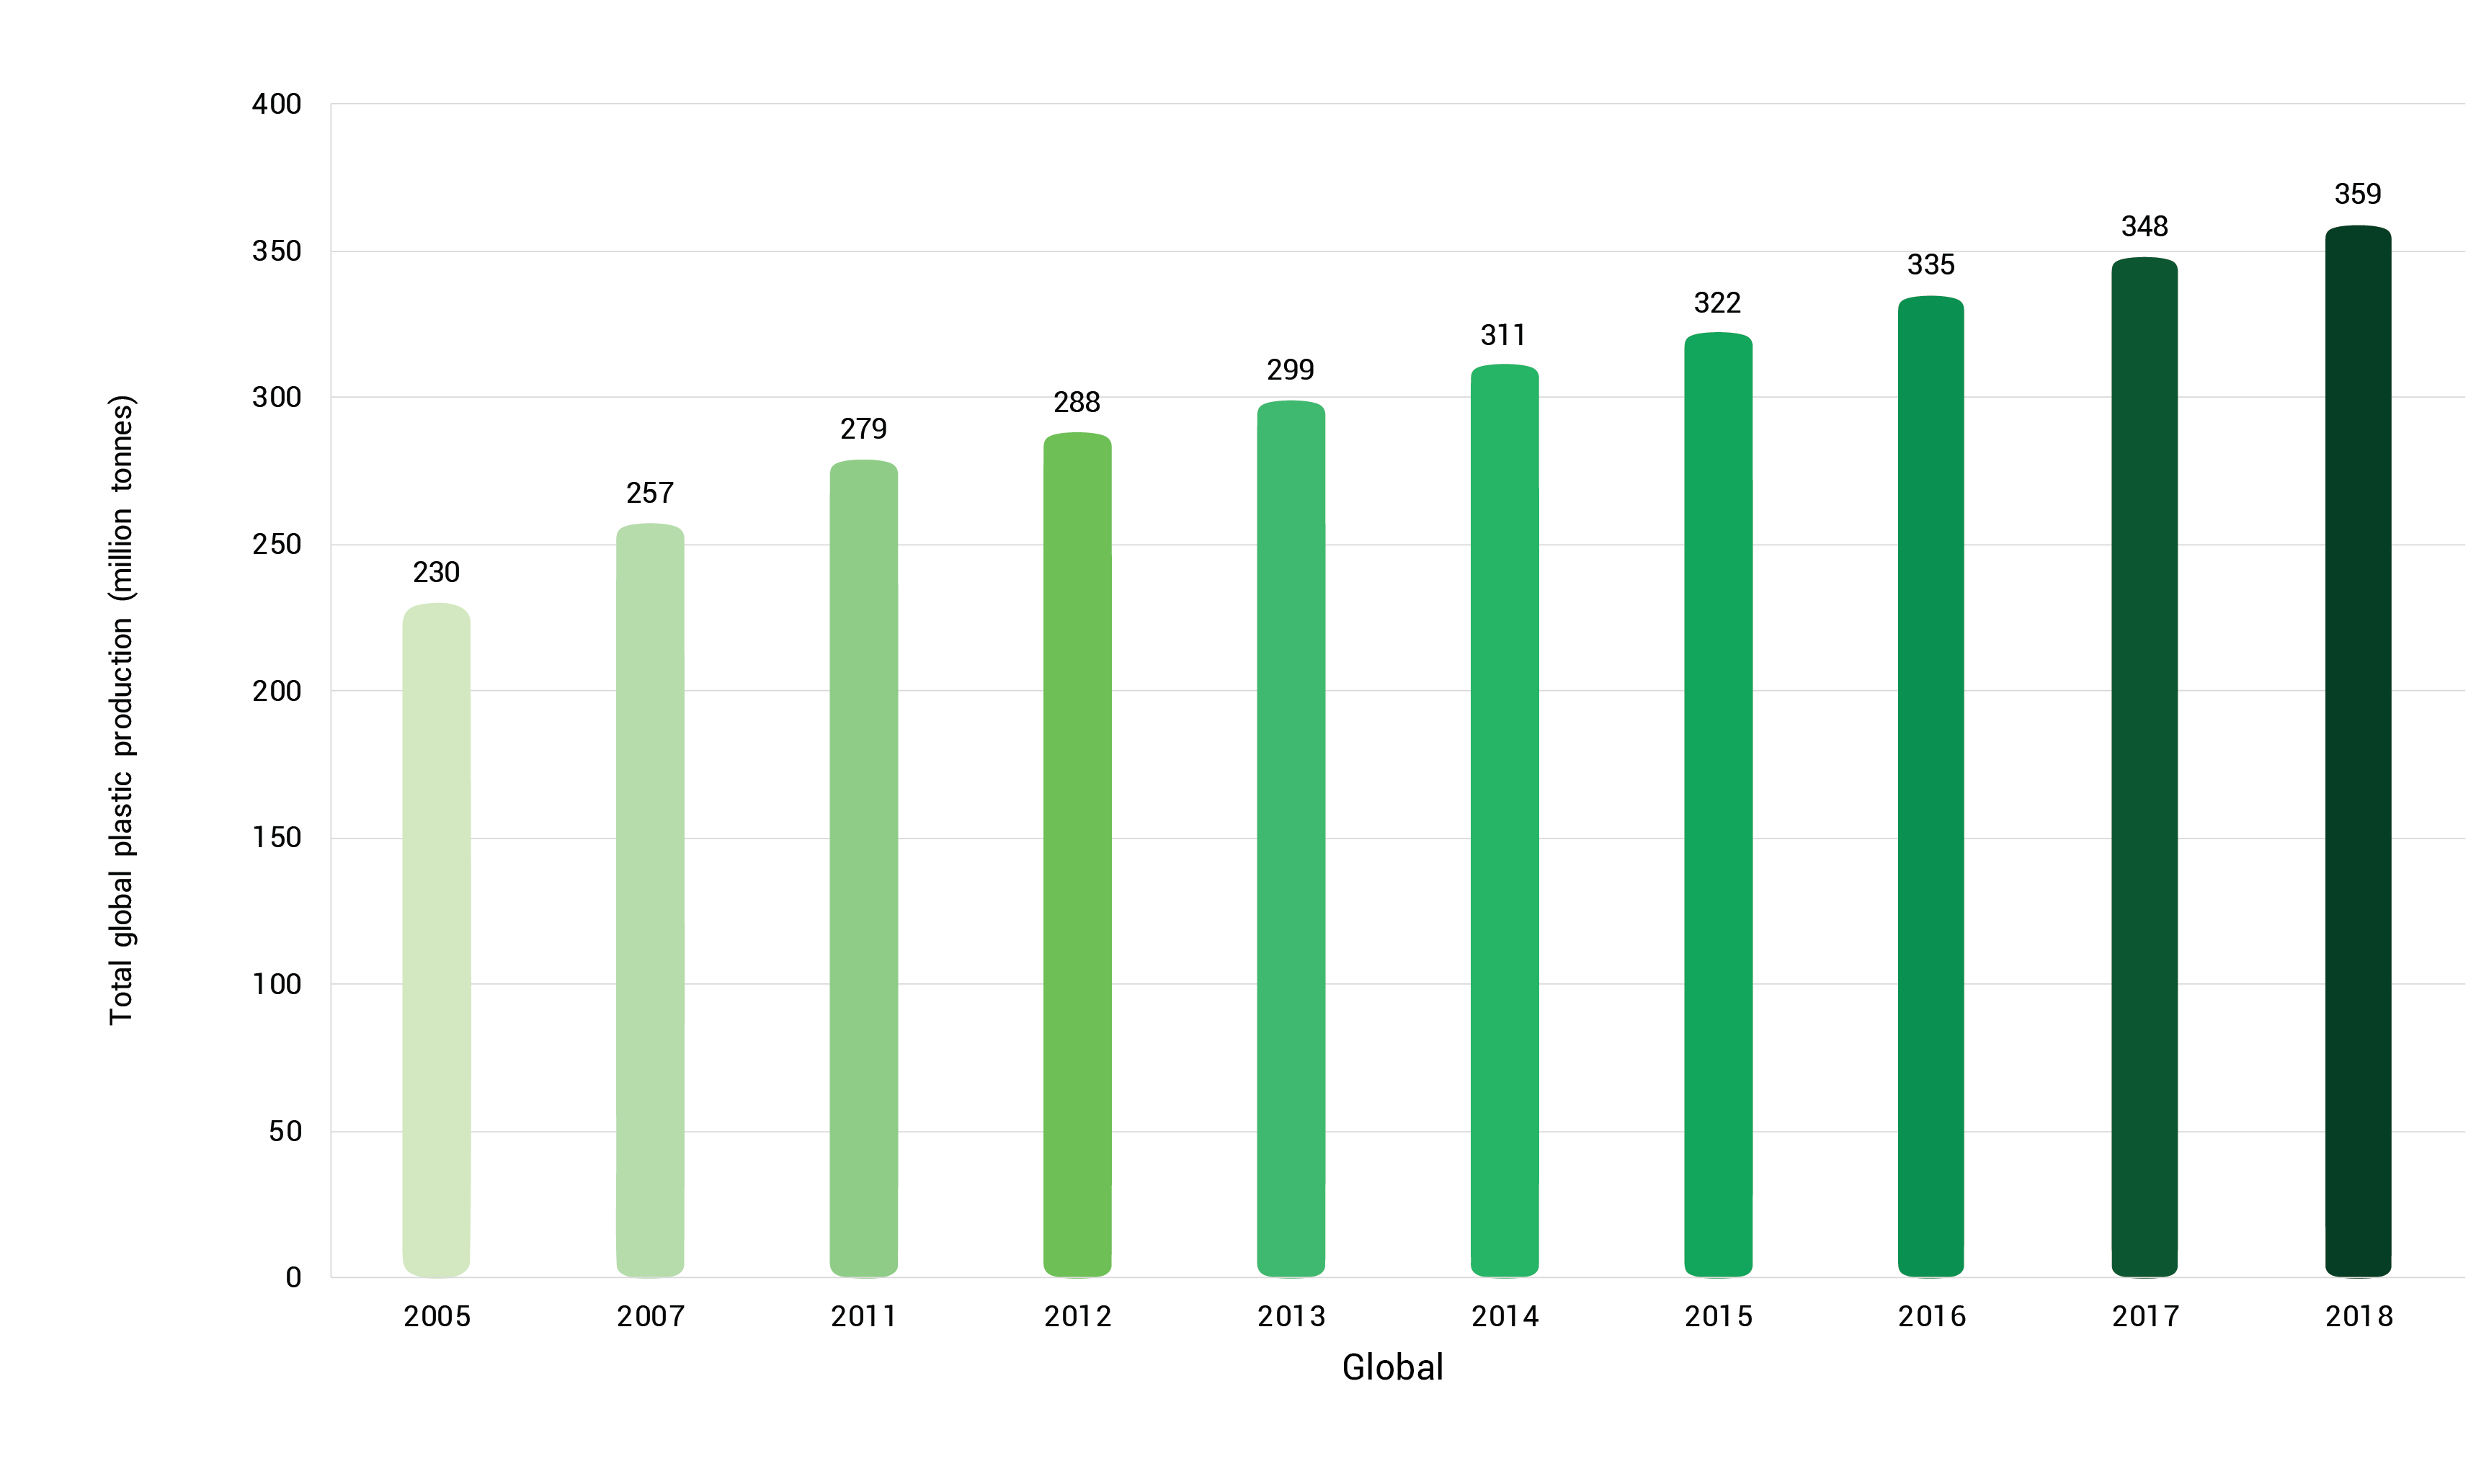
See detailed information▼ or search the most up to date data
In 1950 around 2 MT of plastics were produced in the world. Since then annual plastics production has increased nearly 200-fold, reaching an estimated 359 million tons in 2018. Between 2005 and 2018 the amount of plastics produced globally increased by more than 50 per cent.
Plastics account for around 85 per cent of all marine pollution (UNEP 2021b). Annual flows of plastics to the oceans in 2016 have been estimated at around 11 million tons (MT) (range: 9-14 MT) (Lau et al. 2020; The Pew Charitable Trusts and SYSTEMIC 2020). Borrelle et al. (2017) estimated that 19 to 23 million MT, or 11 per cent, of plastic waste generated globally in 2016 entered aquatic ecosystems. Microplastics, which are pervasive in these ecosystems (Vivekanand, Mohapatra and Tyagi 2021; Mehinto et al. 2022), are present in much of the seafood intended for human consumption, although their toxic effects on marine species and on humans remain largely unknown (Danopoulos et al. 2020; Nicole 2021; Bhuyan 2022).
Pollution from plastics production and the incineration of plastic waste causes widespread harm to human health and the environment (UNEP 2019a; Synoracki 2021; Cosier 2022; Center for Biological Diversity n.d.). When plastics are burned, dangerous pollutants including dioxins, furans, mercury and polychlorinated biphenyls (PCBs) are emitted; burning polyvinyl chloride (PVC) liberates hazardous halogens that accelerate climate change and lead to stratospheric ozone depletion (Verma et al. 2016; Li et al. 2022). Plastics production and consumption in low- and middle-income countries are growing, as are plastic waste exports to these countries (Bai and Givens 2021; Wakunuma 2021; Agnelli and Tortora 2022; PlasticsEurope 2022; OECD 2023b). Solid waste management infrastructure in some LMICs is inadequate to manage increasing levels of plastic waste (Agnelli and Tortora 2022; Vinti and Vaccari 2022; World Bank 2022b).
A growing number of countries are putting measures in place to control or ban single-use plastic items including bags, straws and cups (European Commission [EC] 2021; One Planet and Stockholm Environment Institute 2021; UNEP 2021c). Nevertheless, plastic production and pollution are likely to continue to accelerate unless plastic substitutes and circular economy approaches are used more widely (Lebreton and Andrady 2019; Wright et al. 2019; UNEP 2021b; Rana 2022).
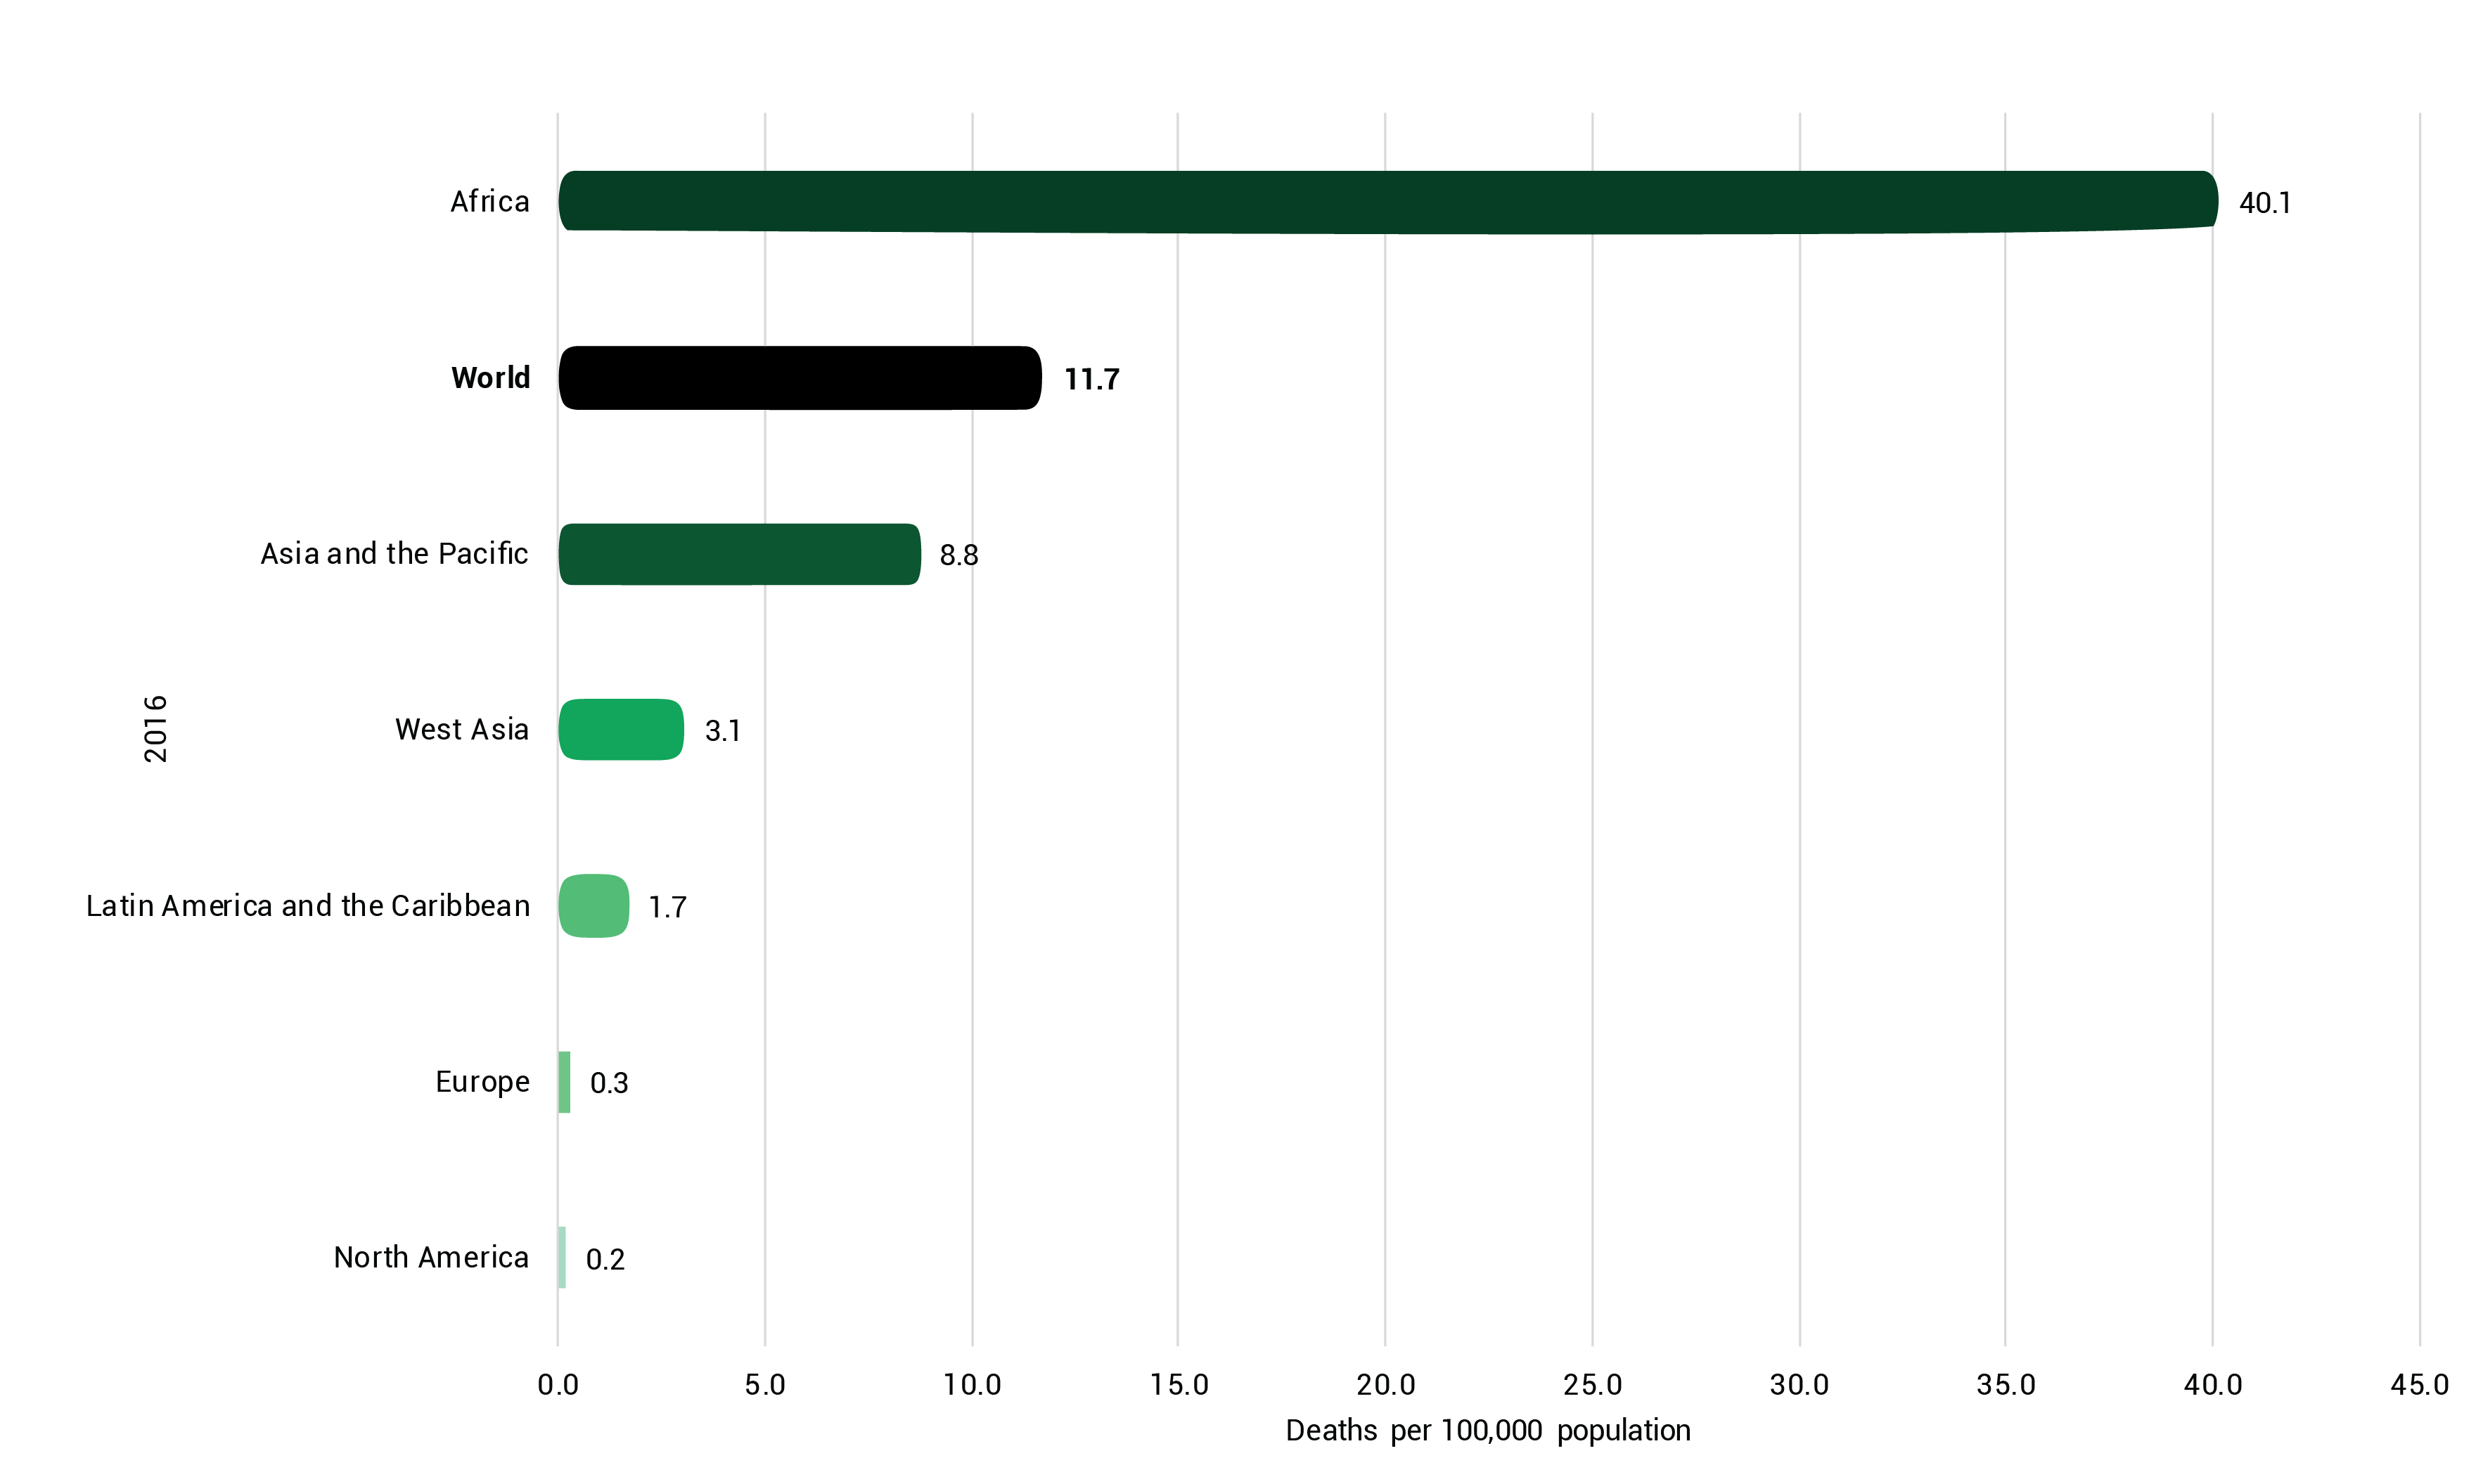
See detailed information▼ or Search the most up to date data
Indicator 3.9.2 is under SDG 3: “By 2030, substantially reduce the number of deaths and illnesses from hazardous chemicals and air, water and soil pollution and contamination, Target 3.9 :”By 2030 substantially reduce the number of deaths and illnesses from hazardous chemicals and air, water, and soil pollution and contamination.”
Data and analysis for this indicator for the year 2016 are presented in the freshwater indicators section of Part 2. Rates of mortality attributed to unsafe water, unsafe sanitation and lack of hygiene in that year differed significantly between regions. The highest rate was in Africa, where there were 40.1 deaths per 100,000 population, almost four times the global average of 11.7. The rates in Asia and the Pacific (8.3), West Asia (3.1) and Latin America and the Caribbean (1.1) were substantially higher than in Europe (0.3) and North America (0.2).
The mortality rate attributed to unsafe Water, Sanitation and Hygiene (WASH) is closely associated with the adverse health effects of chemicals and waste. For example, water bodies used for drinking, sanitation and hygiene may be contaminated by several pollution sources, including agriculture, manufacturing, mining and power generation. Polluted water bodies can cause diseases such as cholera, diarrhoea, dysentery and hepatitis A. Chemical poisoning occurs through ingestion of elevated levels of arsenic, nitrates, fluoride and other pollutants in drinking water. Arsenic is naturally present in the groundwater of several countries including Bangladesh (Hasan, Shahriar and Jim 2019; WHO 2023c).
Forest protection continues to entail complex challenges as a result of both overexploitation and agricultural expansion, which act as the main drivers of deforestation, forest fragmentation and associated biodiversity losses (FAO 2020a). Replacing forests with agricultural land impacts soil ecosystems. Agriculture is usually intensive and accompanied by fertilizer and pesticide fertilizer use. Deforestation negatively impacts soil properties through soil acidification and reduced soil organic carbon content, biological properties and biodiversity, increasing the soil’s vulnerability to pollutants (Nunes et al. 2020).
The resilience of soil ecosystems, and their capacity to adapt to future changes, depend on their biodiversity. Soil organisms provide a wide range of ecosystem services, including transforming organic and inorganic compounds to enhance nutrient availability, enhancing litter decomposition, modifying soil porosity, and transporting water and gas transport (FAO, ITPS, Global Soil Biodiversity Initiative, Convention on Biodiversity and European Commission 2020).
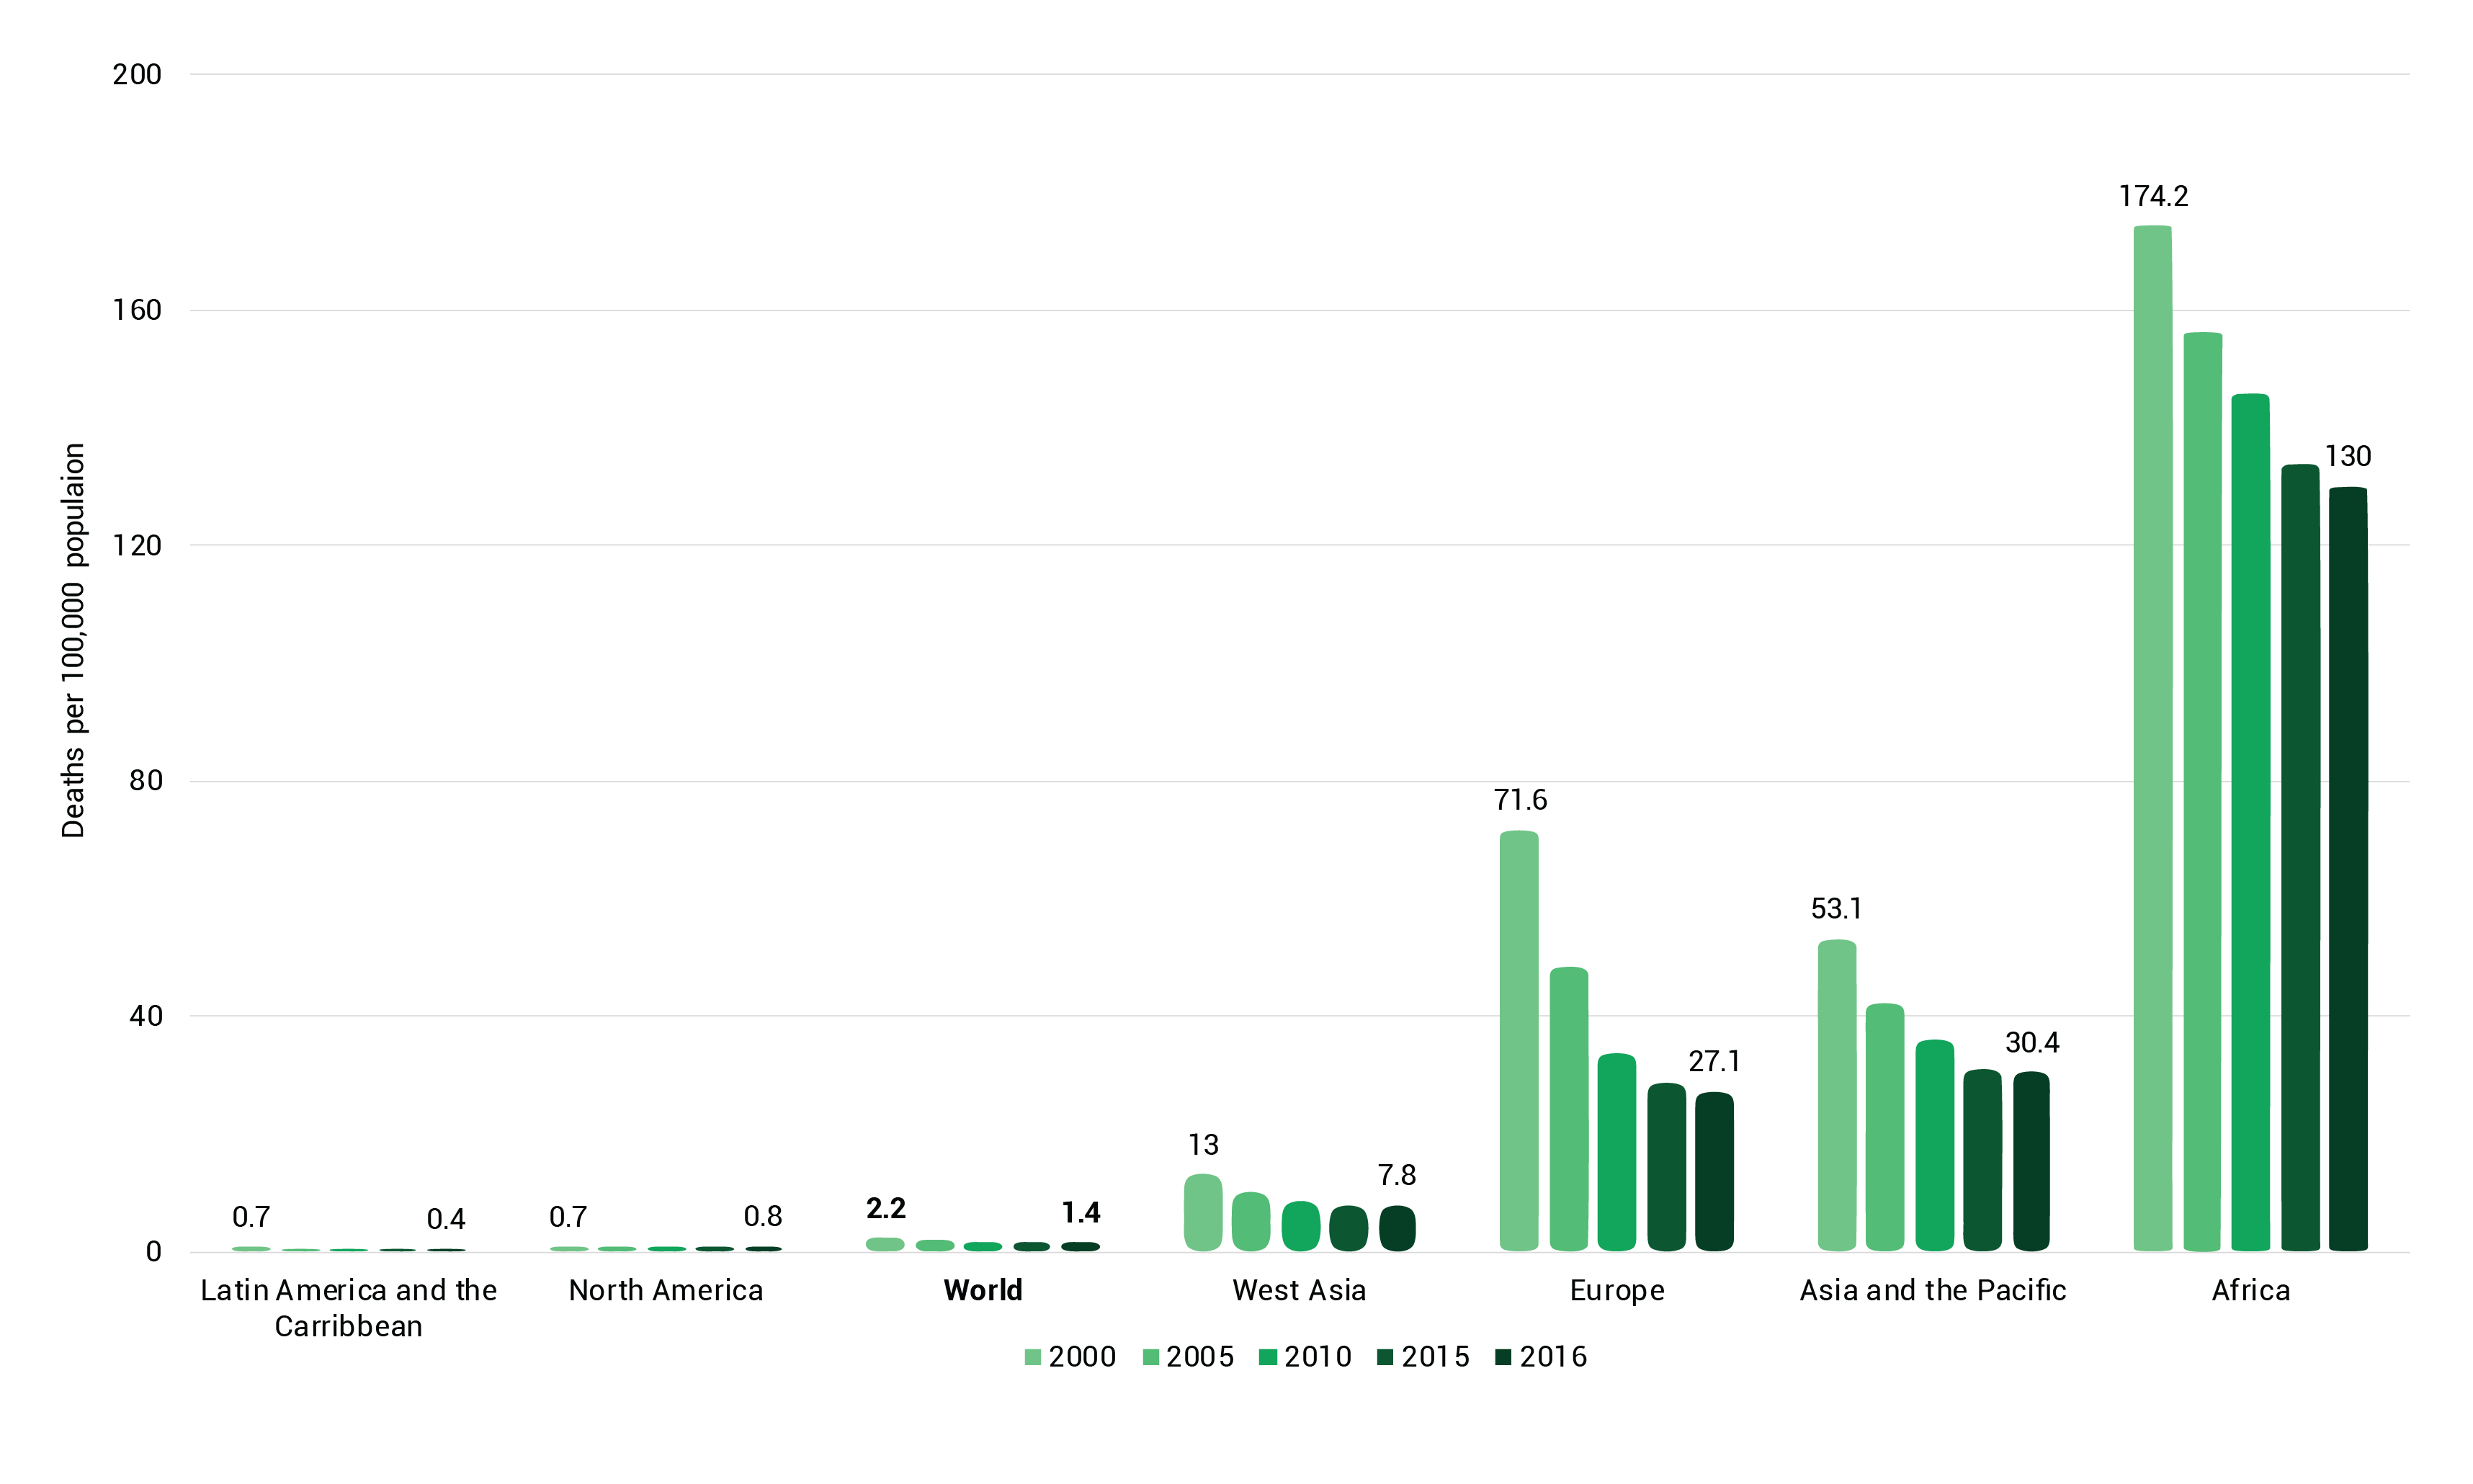
See detailed information▼ or Search the most up to date data
Indicator 3.9.2 is under SDG 3: “Ensure healthy lives and promote well-being for all at all ages”. Target 3.9 :”By 2030 substantially reduce the number of deaths and illnesses from hazardous chemicals and air, water, and soil pollution and contamination.”
The global mortality rate attributed to unintentional poisoning fell from 2.2 deaths per 100,000 population in 2000 to 1.4 in 2016, a decrease of more than 36 per cent. There was an improvement in all regions except North America, where this number has consistently been below 1 although there was an increase from 0.7 in 2000 to 0.8 in 2016. In Africa the rate is far higher than in any other region, at 130 deaths per 100,000 population in 2016, but this rate decreased significantly from 174 in 2000.
The mortality rate attributed to unintentional poisoning provides an indication of the extent to which hazardous chemicals and waste are adequately managed, as well as the effectiveness of a country’s health system (WHO 2023d). Cause of death statistics can help public health authorities determine how to focus their actions (WHO 2023e).
Hazardous substances and waste threaten human health and the environment (Fazzo et al. 2017; UNEP 2019a; EC 2020; WHO 2023f). Many diseases are caused by exposure to pollutants directly related to inadequate waste management (Krystosik et al. 2020; Omang et al. 2021). Systems for sound data collection on causes of death have been implemented in high-income countries (e.g. Australian Bureau of Statistics 2022; United States Centers for Disease Control and Prevention 2023), but such systems often still do not exist in many LMICs. High quality cause-of-death data are nevertheless crucial for improving health and reducing preventable deaths in all countries (Ordi 2016; Iburg et al. 2021; Coates et al. 2021).
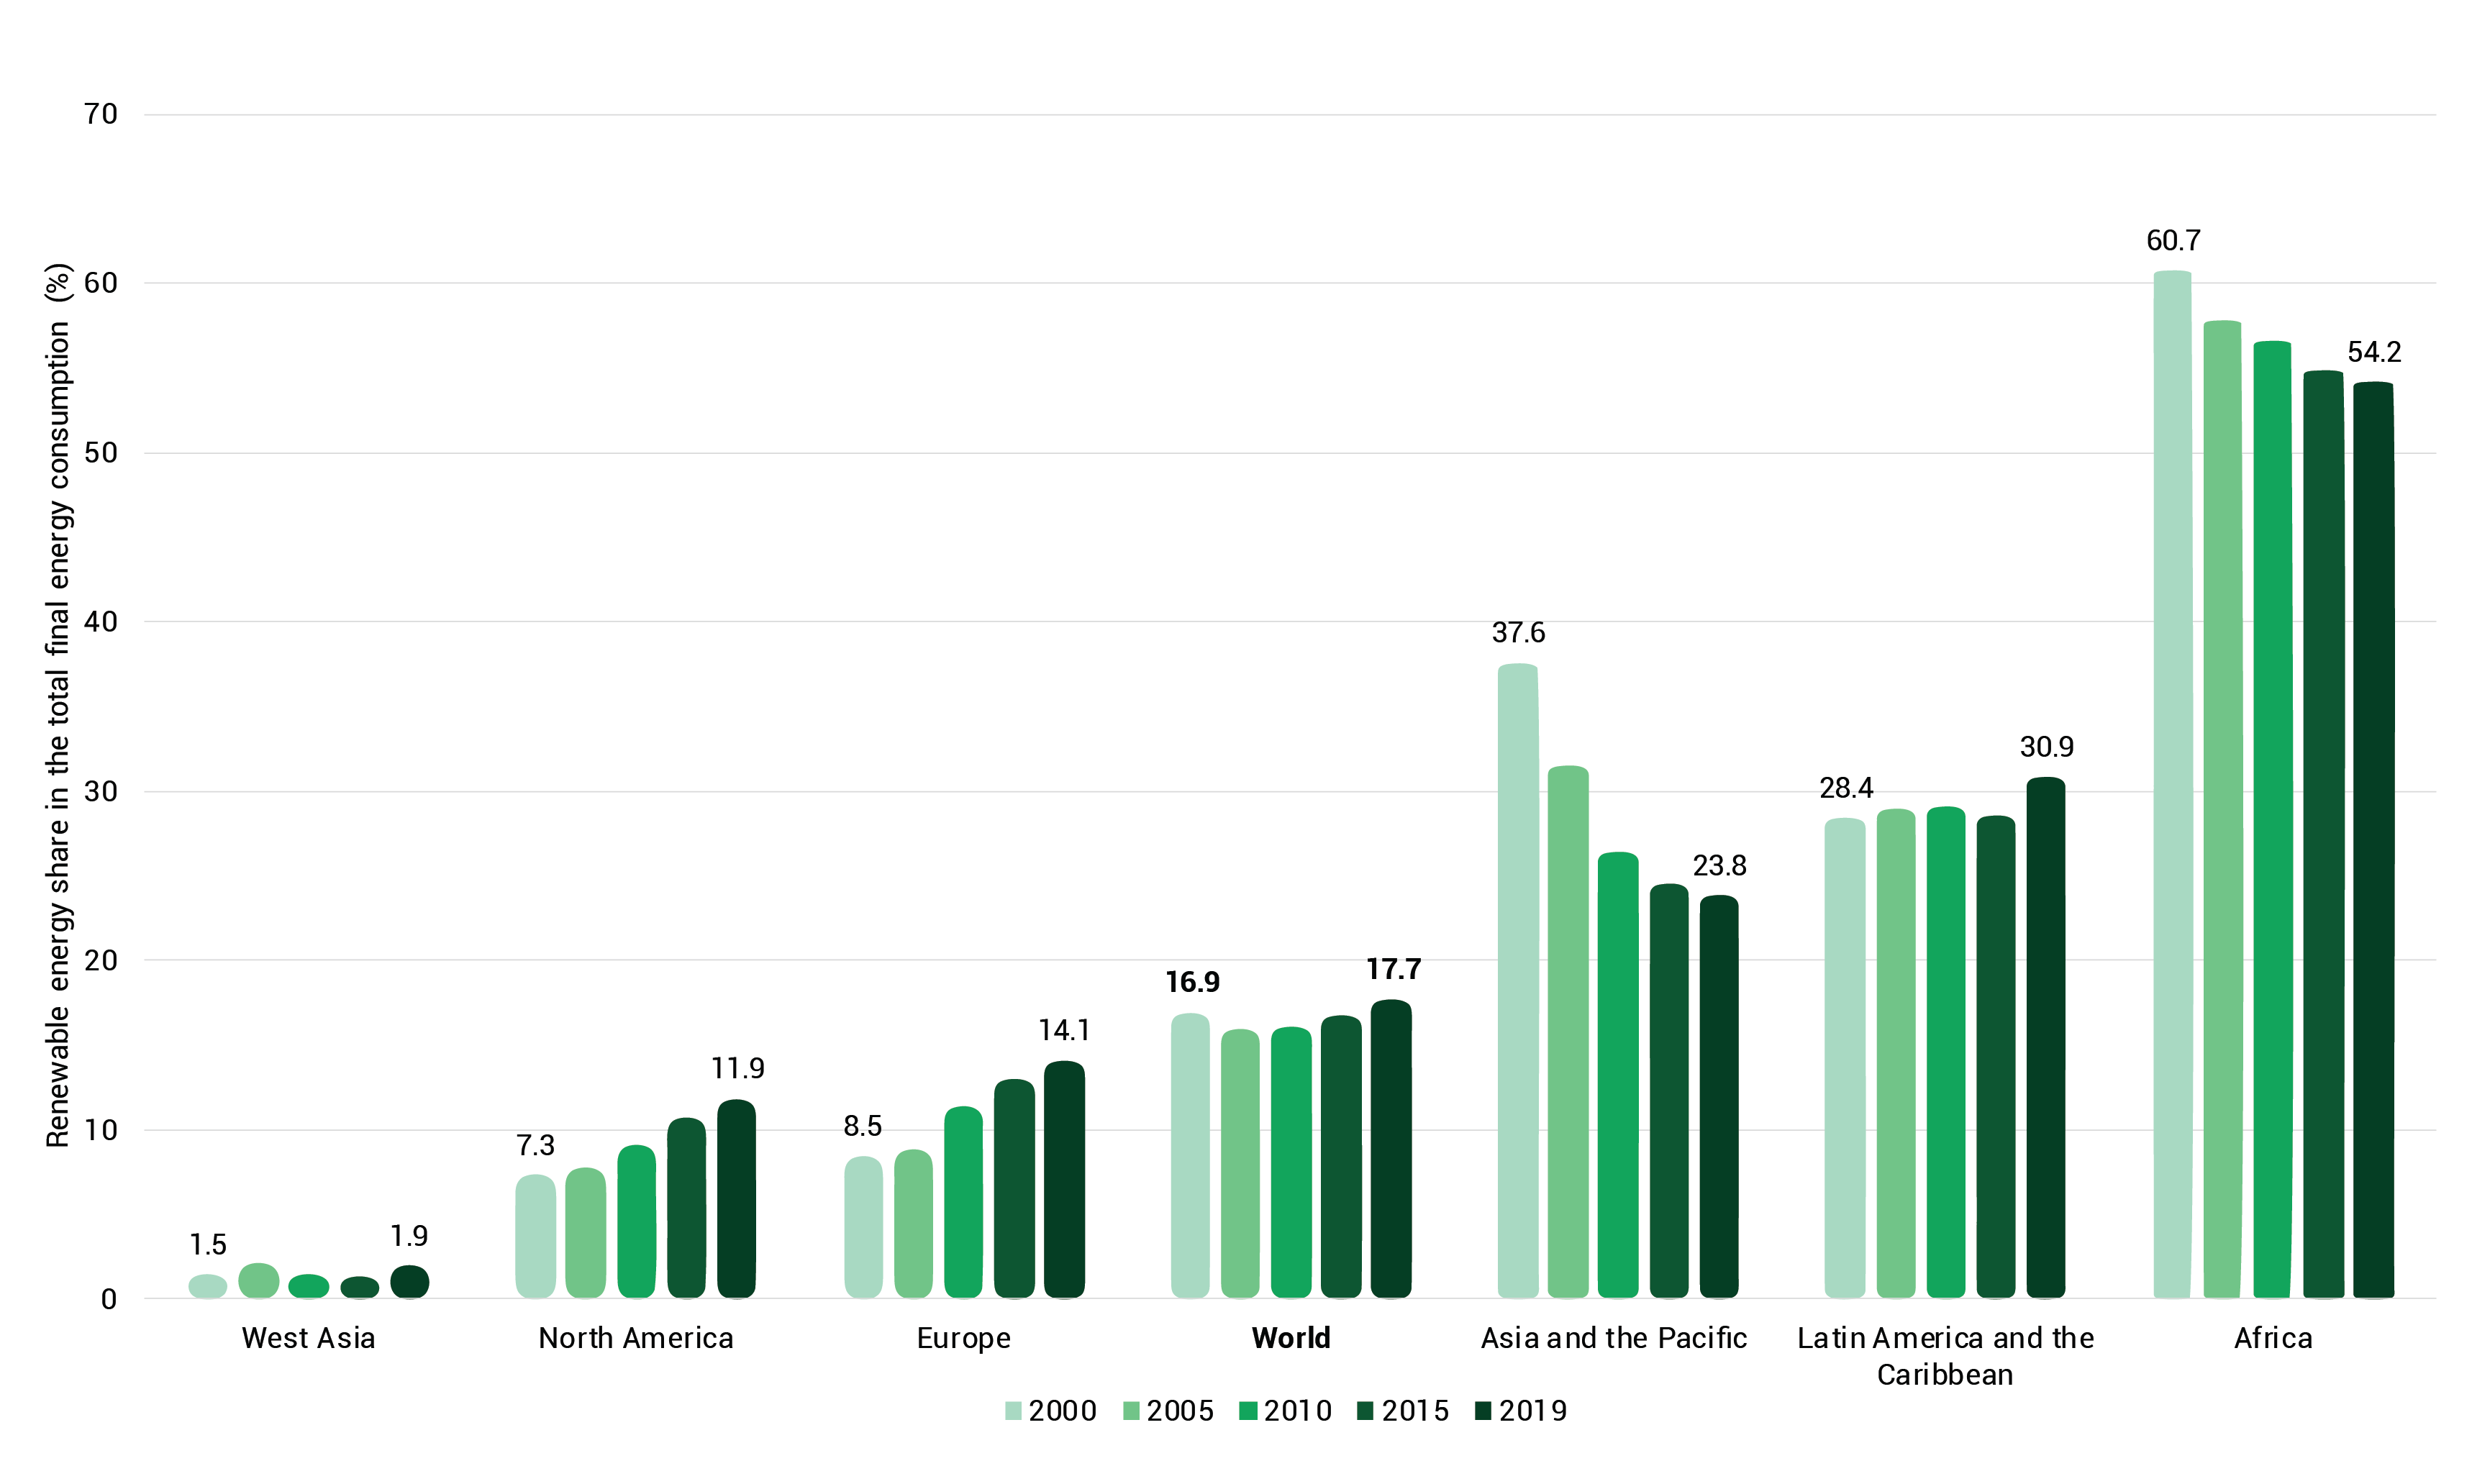
See detailed information▼ or Search the most up to date data
Indicator 7.2.1 is under Target 7.2: “By 2030, increase substantially the share of renewable energy in the global energy mix”, Goal 7: “Ensure access to affordable, reliable, sustainable and modern energy for all.”
Globally, the share of renewable energy in total final energy consumption increased from 16.9 to 17.7 per cent between 2000 and 2019. The trend analysis for this indicator is found in the air pollution indicators section.
Increasing deployment of renewable energy sources plays an important role in climate change mitigation and the transition towards a pollution-free planet (UNEP 2017a; International Energy Agency [IEA] 2023). However, the waste associated with renewable energy production must be addressed. Given the limited lifespan of many components, increasing volumes of this waste will need to be managed sustainably in the future (Bomgardner and Scott 2017; Heath et al. 2020; EEA 2021a, b; Phipps 2021). The materials used in wind turbines are an example (Tazi et al. 2019; Oliveira et al. 2021; Volard 2023).
Annual end-of-life photovoltaic (PV) panel waste has been projected to increase to more than 60-78 MT cumulatively by 2050 (International Renewable Energy Agency and International Energy Agency Photovoltaic Power Systems Programme 2016). Research is ongoing to develop a new generation of lighter, more flexible, and more efficient solar cell technologies suitable for practical use (Ghasemi et al. 2023; Shipman 2023).
Despite the need to address waste associated with renewable energy production, it is important not to lose sight of the adverse environmental and health impacts of the energy sources they are replacing (Smieja 2022). More renewable energy means less waste by the petrochemical industries, which are major sources of solid waste and sludges that contain vast amounts of hazardous substances, toxic organics and heavy metals. Discharges from these industries, releasing large quantities of pollutants, present major health environmental hazards (Israel et al. 2008; OSPAR Commission 2021; Ukhurebor et al. 2021).
Insufficient data for regional/global analysis.
See detailed information▼ or Search the most up to date data
Indicator 11.6.1 is under Goal 11: “Make cities and human settlements inclusive, safe, resilient and sustainable”, Target 11.6: “By 2030, reduce the adverse per capita environmental impact of cities, including by paying special attention to air quality and municipal and other waste management.” Owing to lack of data availability, an analysis of progress on indicator 11.6.1 is not possible.
Urban population growth leads to increasing amounts of solid waste that require appropriate management. Healthy, sanitary living conditions can be maintained through regular waste collection, recycling, and proper treatment and disposal. Many cities in the world face problems in managing their solid waste as challenges arise related to rapid urbanization and lack of technical and financial capacity (Kaza et al. 2018; Kaza, Shrikanth and Chaudhary 2021; Raab, Tolotti and Wagner 2021; Ouattara, Maiga and Quattara 2022; Waste Atlas n.d.). Another challenge for municipal solid waste (MSW) management is the amount of hazardous waste (including e-waste) disposed with household waste.
Many cities also have an active informal sector that focuses on recycling, reuse and repair. Opportunities exist for the formal and informal waste sectors to join forces to manage MSW (Hande 2019; Gutiérrez-Galicia et al. 2021; Kashyap, Malhorta and Gaurav 2022). Following waste collection, treatment facilities or landfill sites need to be operated in an environmentally sound manner (United Nations Human Settlements Programme [UN-Habitat] 2018, 2020, 2023). Open dumpsites are major sources of pollution, including GHG emissions, in both urban and rural settings (Srivastava et al. 2015; Abubakar et al. 2022; Guo et al. 2022). Open waste burning discharges a cocktail of air pollutants (Willmer 2021; Mebratu and Mbandi 2022).
When solid waste is generated at a rate that municipal authorities and natural environments cannot cope with, risks for human health and the environment, including air, water and soil ecosystems, are inevitable (Tan et al. 2015; Azevedo, Scavarda and Caiado 2019; UN-Habitat 2020b).
Insufficient data for regional/global analysis.
See detailed information▼ or Search the most up to date data
Indicator 12.4.2(b) is under SDG 12: “Ensure sustainable consumption and production patterns,” Target 12.4: ”By 2020, achieve the environmentally sound management of chemicals and all wastes throughout their life cycle, in accordance with agreed international frameworks, and significantly reduce their release to air, water and soil in order to minimize their adverse impacts on human health and the environment.” This 2020 target was not met (UNEP 2019a).
Available data do not allow regional aggregations. Twenty-nine countries reported quantities of hazardous waste treated as part of the United Nations Statistics Division (UNSD)/UNEP Questionnaire on Environment Statistics, waste section.
A variety of treatments are required to address the harmful effects of hazardous waste on human health and the environment. Some hazardous waste is discarded in the form of commercial products (e.g. cleaning products, pesticides) or as by-products of manufacturing processes. Some types require complex treatment, including e-waste (Salhofer 2017; Kiddee et al. 2018; Gabriel 2020). Hazardous waste treatment can entail recycling, incineration, incineration with energy recovery, and landfilling.
Environmentally sound management of hazardous waste requires specific technical capacity. This is one reason some countries export their waste to other countries for treatment and final disposal (UNEP 2020; OECD 2022c; United States Environmental Protection Agency [US EPA] 2022b, 2023; Basel Convention n.d.; EC n.d.a, b; UNEP n.d.d).
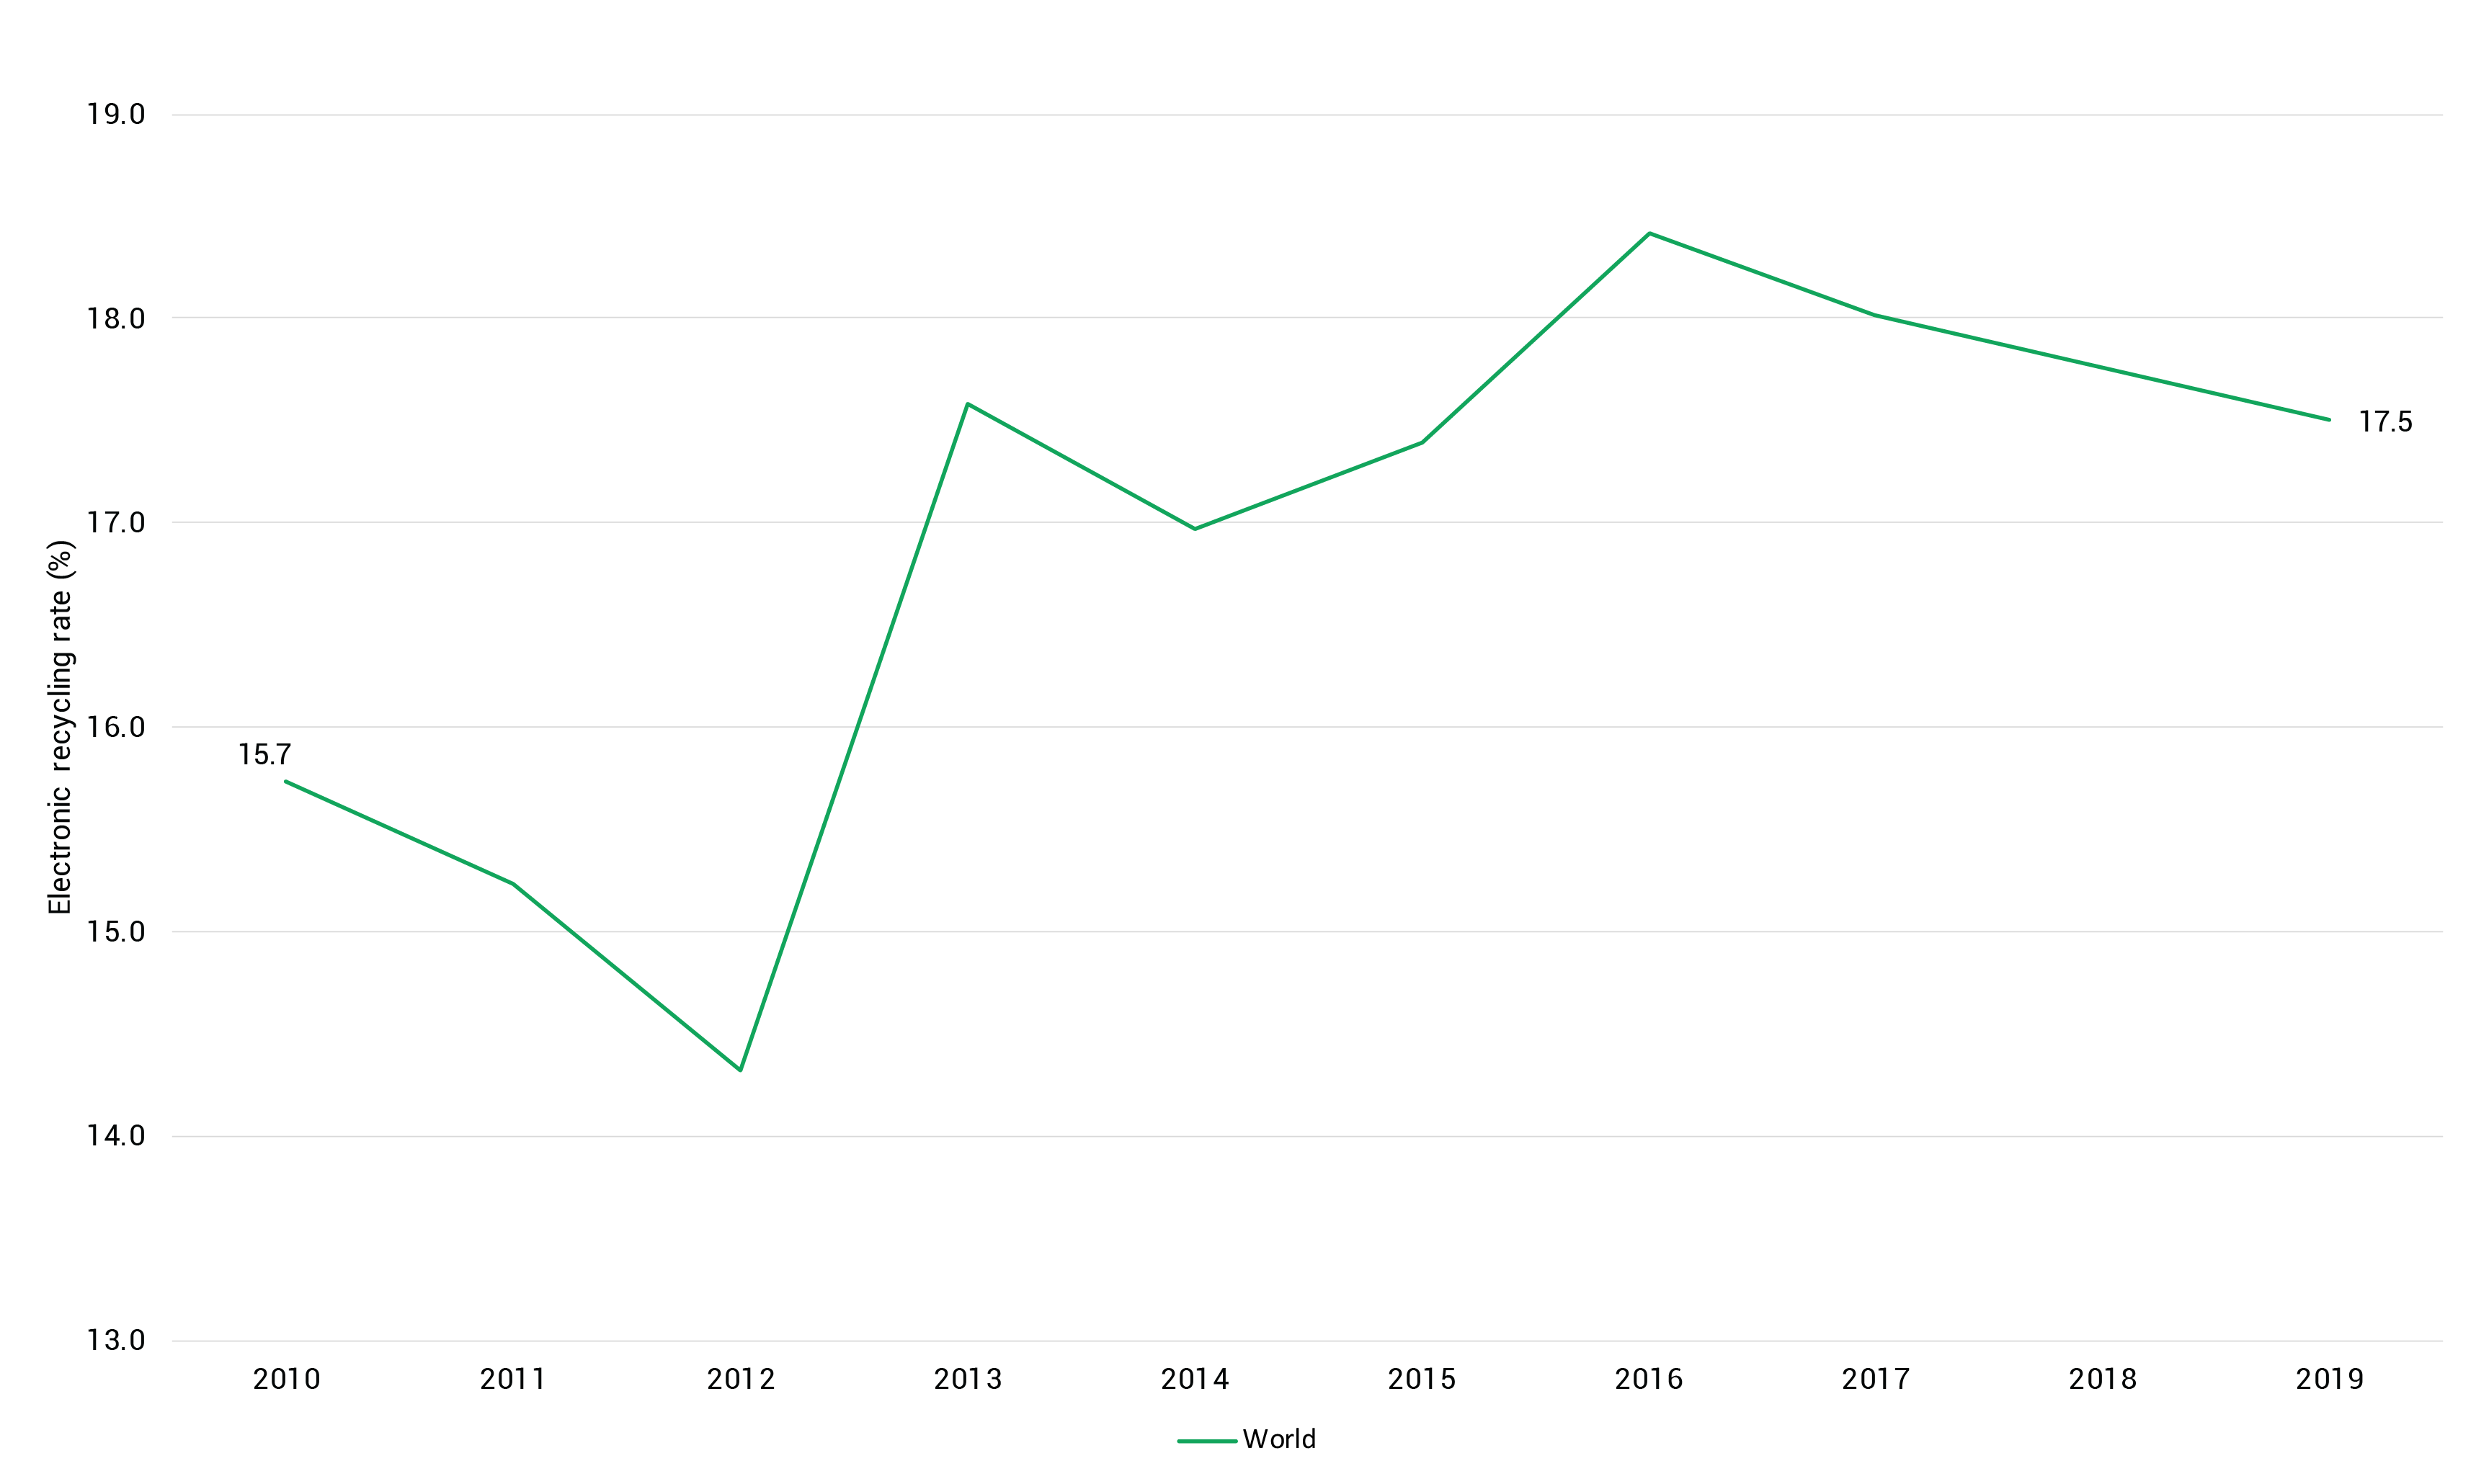
See detailed information▼ or Search the most up to date data
Indicator 12.5.1 is under SDG 12: “Ensure sustainable consumption and production patterns”, Target 12.5: “By 2030, substantially reduce waste generation through prevention, reduction, recycling and reuse.”
Globally, only around 18 per cent of e-waste per capita was recycled in 2019. The highest recycling rates were in Europe and North America, where almost one-third (32 per cent) of e-waste was recycled. Only slightly more than 1 per cent of e-waste per capita (1.2 per cent) was recycled in Latin America and the Caribbean. For the purposes of this indicator, electronic waste, or e-waste, refers to all items of electrical and electronic equipment (EEE) and its parts that have been discarded by its owner as waste without the intent of re-use (United Nations Statistics Division [UNSD] 2021).
The national recycling rate is defined as the quantity of material recycled in a country, plus the quantities exported for recycling, out of total waste generated in the country, minus material imported which was intended for recycling. Recycling also includes co-digestionnaerobic digestion and compostingerobic process, but not controlled combustion (incineration) or land application (UNSD 2021).
Dumpsites and landfills around the world are sources of complex mixtures of pollutants, including methane (Arasu 2022; Maasakkers et al. 2022), the numerous hazardous chemicals in e-waste (Parvez et al. 2021), and leachate containing heavy metals and other hazardous substances (Molla et al. 2021; Siddiqua, Hahladakis and Al-Attiya 2022). Eliminating waste and pollution, circulating products and materials (at their highest value), and regenerating nature are central concepts of the circular economy (Ellen Macarthur Foundation n.d.; UNEP n.d.c). E-waste is the fastest growing category of hazardous solid waste. Responding adequately to the global e-waste crisis requires a circular economy approach (Ellen Macarthur Foundation 2021; Suppipat and Hu 2022).
Kaza et al. (2018) estimated that 13.5 per cent of MSW was recycled globally in previous years: 29 per cent was recycled In high-income, 4 per cent in upper-middle income, 6 per cent in lower-middle and 3.7 per cent in low-income countries. They also reported that e-waste (like hazardous and medical waste) typically makes up only a fraction of MSW. If disposed of properly, it is generally treated in specialized facilities; e-waste generation is linked to economic development, with high-income countries generating five times as much e-waste as lower-middle-income countries (Kaza et al. 2018).
E-waste recycling rates differ among regions. Globally, only around 18 per cent of e-waste per capita was recycled in 2019. The highest recycling rates were in Europe and North America, where almost one- third (32 per cent) of e-waste was recycled (32 per cent). Only slightly more than 1 per cent of e-waste per capita (1.2 per cent) was recycled in Latin America and the Caribbean.
Human health may suffer from exposure to toxic heavy metals and other hazardous substances found in e-waste due to inadequate recycling. High concentrations of heavy metals in the atmosphere and terrestrial and aquatic ecosystems can exceed natural uptake capacities and environmental boundaries, resulting in severe deterioration of environmental quality (Wang, Hu and Cheng 2019). With the constant upgrading of electric and electronic equipment (EEE), the quantity of e-waste continues to increase dramatically, highlighting the need for sound recycling methods.
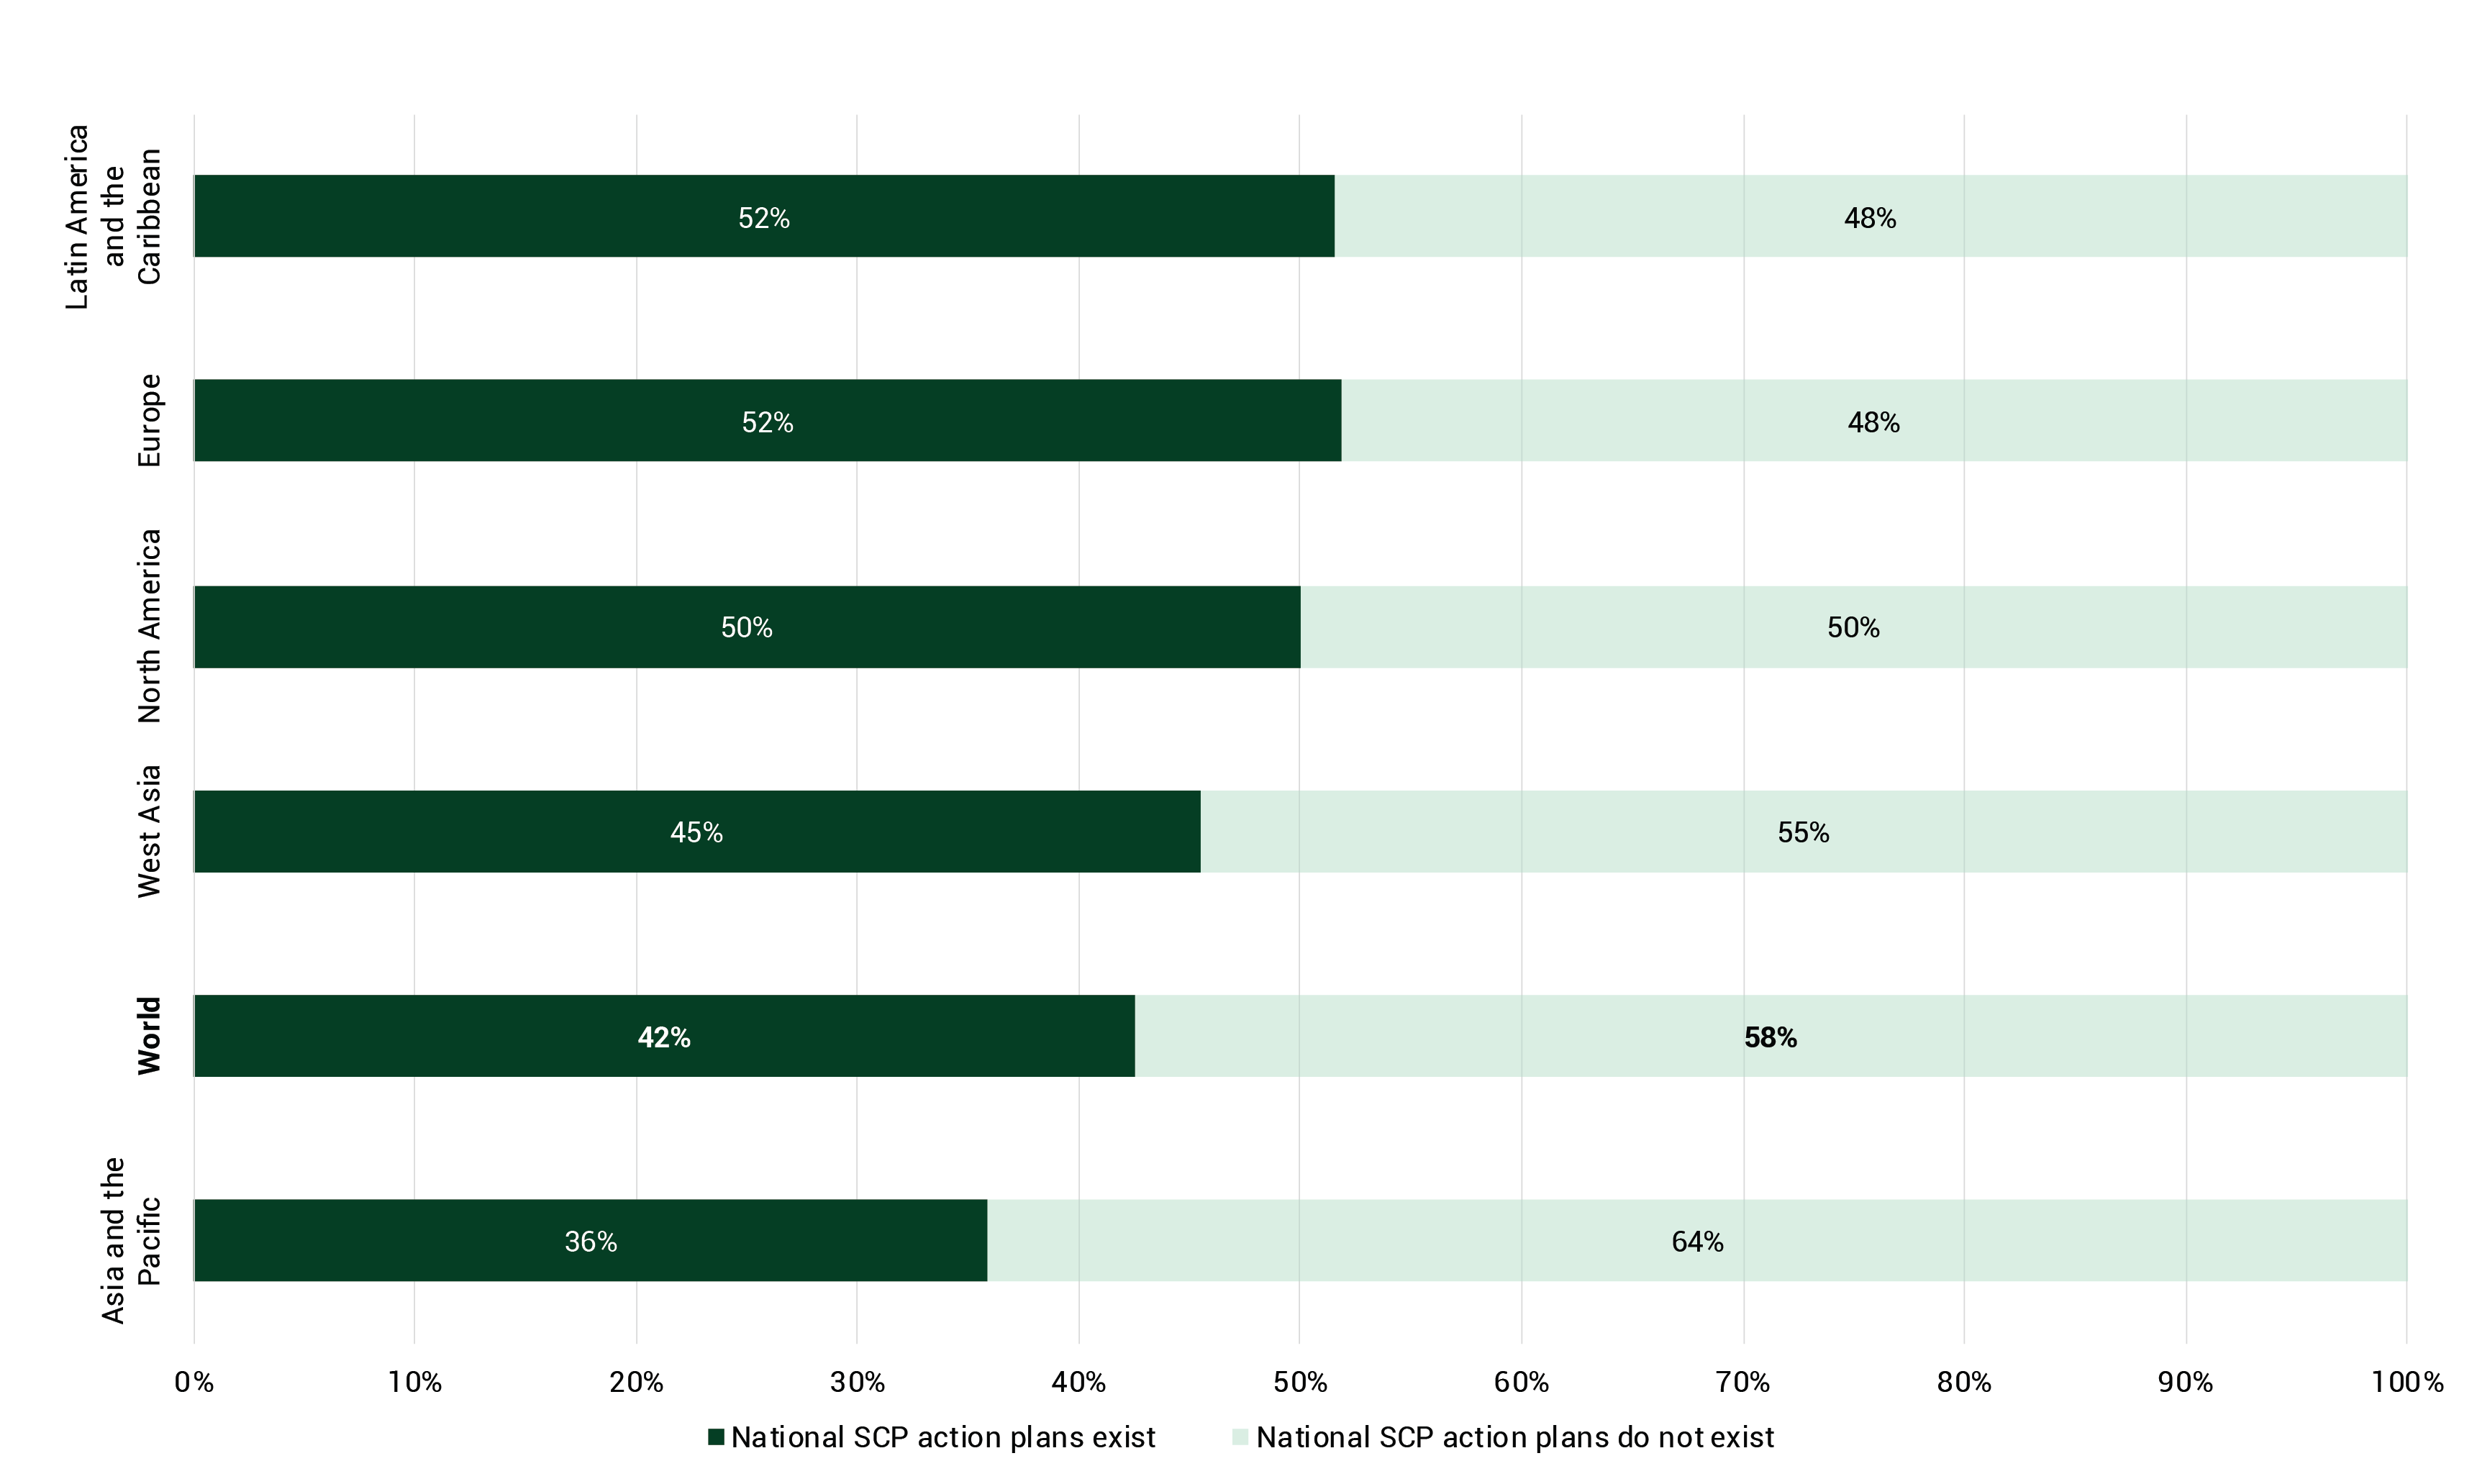
See detailed information▼ or search the most up to date data
Indicator 12.1.1 is under SDG 12: “Ensure sustainable consumption and production patterns,” Target 12.1: “Implement the 10-Year Framework of Programs on sustainable consumption and production (10YFP), all countries taking action, with developed countries taking the lead, taking into account the development and capabilities of developing countries”.
This indicator supports the evaluation of governments’ progress in developing and applying policies that promote sustainable consumption and production. Globally in 2020 around 42 per cent of countries had adopted sustainable consumption and production (SCP) national action plans (82 out of 194 countries). The highest rates were in Europe and Latin America and the Caribbean (both at 52 per cent). In West Asia, and Asia and the Pacific, 45 per cent and 36 per cent of countries had implemented these plans respectively. Available data do not allow an analysis of the extent to which countries are compliant with or are implementing these plans.
Sustainable consumption and production promotes more efficient and profitable production with the use of fewer raw materials and the generation of less pollution and waste (UNEP n.d.e). SDG indicator 12.1.1 helps assess the volume and geographical distribution of progress by governments in meeting SCP targets. Sustainable patterns of economic growth have the potential to reverse grave and irreversible environmental degradation by GHG emissions and other forms of pollution.
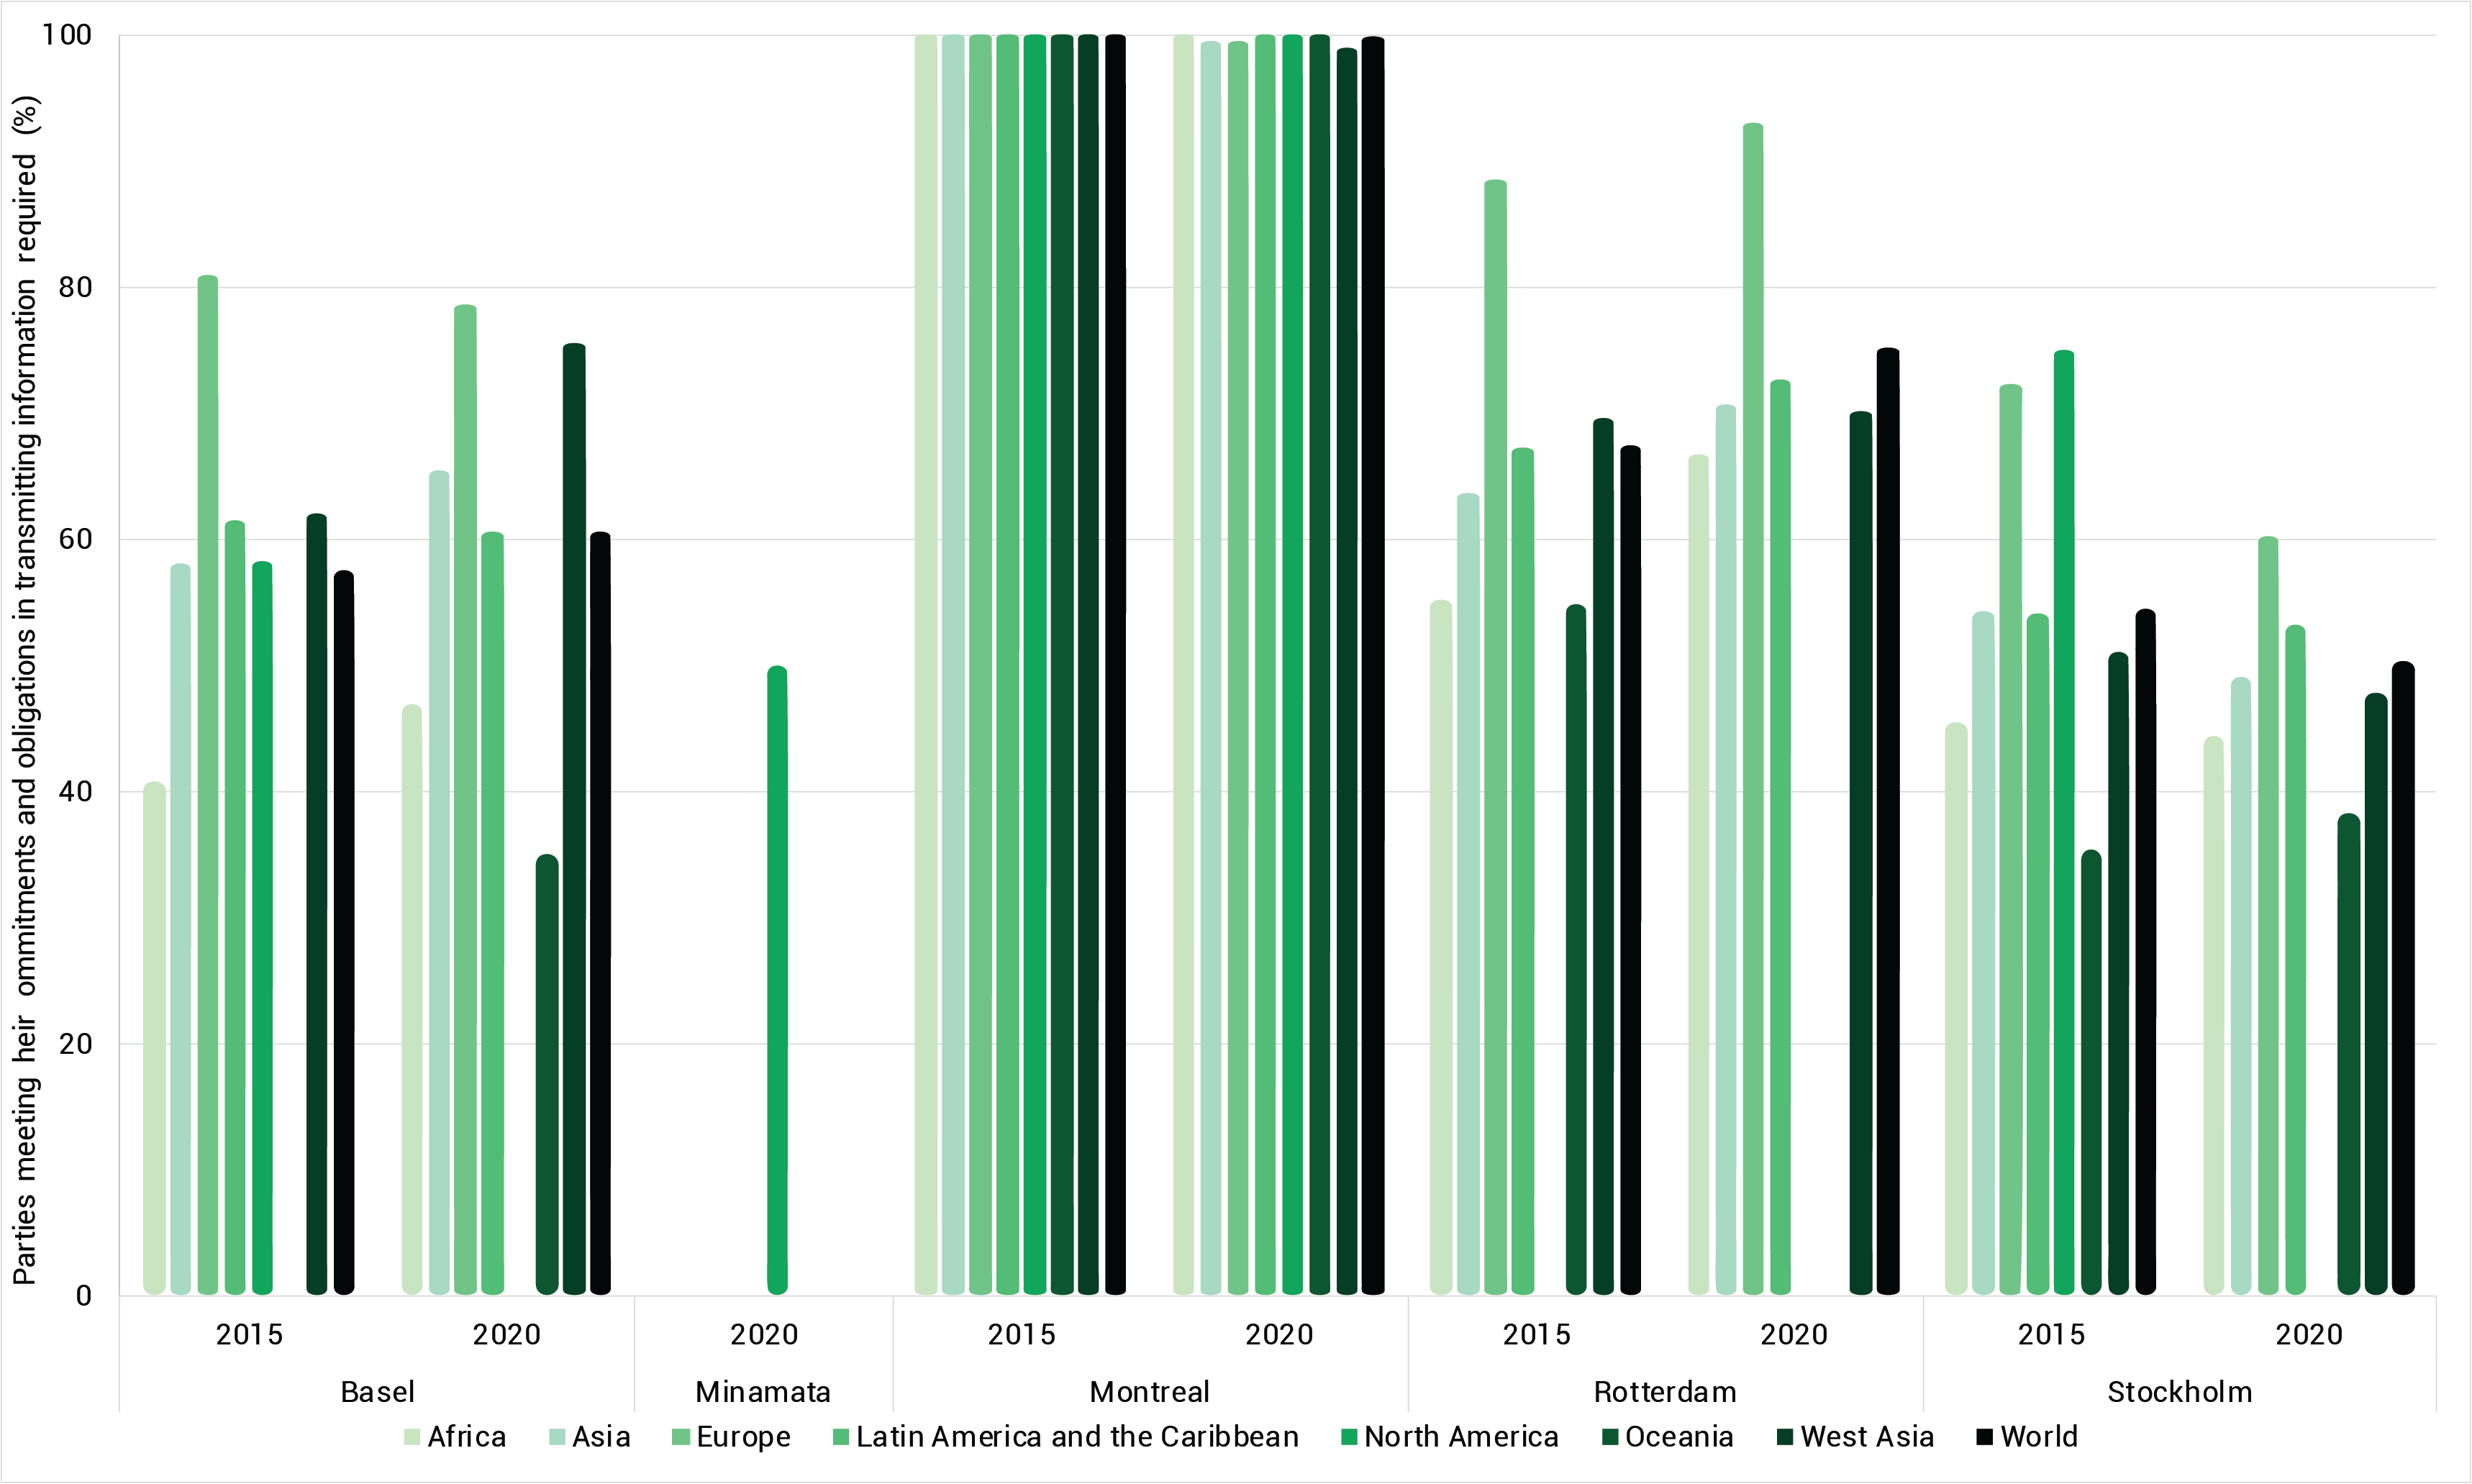
See detailed information▼ or Search the most up to date data
Indicator 12.4.1 is under SDG 12: “Ensure sustainable consumption and production patterns,” Target 12.4: ”By 2020, achieve the environmentally sound management of chemicals and all wastes throughout their life cycle, in accordance with agreed international frameworks, and significantly reduce their release to air, water and soil in order to minimize their adverse impacts on human health and the environment.” This 2020 target has not been met (UNEP 2019a).
The Basel, Rotterdam and Stockholm Conventions, the Montreal Protocol on Substances that Deplete the Ozone Layer, and the Minamata Convention on Mercury are multilateral environmental agreements (MEAs) to achieve the environmentally sound management of hazardous wastes, chemicals and persistent organic pollutants (POPs). Countries are requested to report data and information related to transboundary movements of hazardous wastes and their disposal, as well as the international trade of hazardous chemicals and pesticides, including POPs, mercury and ozone-depleting substances, on a regular basis (UNSD 2023). These conventions aim to control and restrict the trade of hazardous chemicals that pose major risks to human health and the environment around the world (Nunez-Rocha and Martínez-Zarzoso 2019). Data shared within them provide a monitoring and assessment framework that makes it possible for countries to know where they stand, and how far they have come, in regard to regulating and controlling hazardous chemicals and waste.
Conclusions
What does this indicator framework tell us about the global status of pollution?
-
There is no unique and comprehensive set of targets and indicators for pollution, chemicals and wastes globally. This makes tracking progress to reduce pollution globally challenging.▼
Prepared with the aim of providing a comprehensive overview of the situation of pollution globally, based on globally agreed targets and indicators, this framework reveals the lack of a built for purpose measurement system for pollution globally. While the range of Sustainable Development Goals, targets, and indicators offer a uniquely global perspective on the situation of pollution, they are insufficient to review progress towards a pollution-free planet. Despite the addition of complementary global indicators, external to the SDGs, overall, the monitoring framework, and the relevant data existing, is incomplete.
Pollution is a diverse and complex problem, and while there is a wide network of global and regional conventions and policy frameworks, partnerships and collaborative frameworks, the global panorama is fragmented and lacking a common set of targets and indicators. This is unlike the case of climate change and biodiversity, which can rely on a quantitative target for maximum temperature rise and on a set of global biodiversity targets as part of the Kunming-Montreal Global Biodiversity Framework. The set of targets and indicators established for the SDGs, although covering several pollution-related issues, is not comprehensive and only provides a partial picture. This problem is made worse by the limited availability of data at the global level, with great variability between regions and issues. While several indicators exist outside of the SDG framework that are used globally, they are not part of a commonly agreed framework, and they also face data availability issues.
In addition to the DPSIR framework, this report uses outcome targets and procedural or means of implementation targets that were adapted from the OECD paper on “An SDG-based results framework for development co-operation” (Engberg-Pedersen & Zwart, 2018; Results Team of the Development Co-operation Directorate, 2016). The main objective of using this results-based framework is to provide additional insight on the progress of Agenda 2030 and assess targets’ progress. It is however worth noting that the DPSIR framework is at the indicator level, while the results-based framework is at the target level, and this was differentiated in the analysis provided in the sections on Indicator-based global situation of pollution.
The “2020 goal” of producing and using chemicals in ways that lead to the minimization of significant effects on human health and the environment, which is the core of the Strategic Approach to International Chemicals Management (SAICM), may be seen as an exception and has been integrated into SDG Goal 12 target 12.4. However, this goal was not accompanied by quantitative targets and the indicator identified to measure progress (12.4.1) only relates to policy progress, i.e., the extent to which parties to relevant multilateral environmental agreements (MEAs) meet their reporting requirements.
The newly adopted Global Framework on Chemicals - For A Planet Free Of Harm From Chemicals And Waste contains a set of five strategic objective accompanied by 28 targets and a measurability structure to support taking stock of progress. Its measurability structure (provided in annex C) illustrates the different categories of indicators that may be used to track progress and impact of the framework including high level indicators to measure progress towards the vision of the framework, in relation to chemicals and waste impacts on human health and on the environment, headline indicators, when identified, to measure impact against the strategic objectives, and process indicators that measure actions taken and impact indicators that measure results achieved against the targets. All indicators in the measurability struct are either from a list of readily available existing indicators or new indicators, according to certain criteria.
-
Even when indicators exist, data are often missing or limited. This leads to difficulty in aggregating data at global or even regional levels and in seeing progress over time▼
Data availability and reporting is a serious issue; nearly one third (18/64) of the indicators reviewed do not have sufficient data to understand if the issue is improving or not. For these indicators, there is either no data, limited data that does not allow for regional or global aggregation, or data from only one year which does not allow for trend analysis over time. For example, of the 15 indicators used to assess the response to land and soil pollution issues,53% of them do not have sufficient data to provide an assessment of the trend for the data over time. More specifically, SDG data on plastic debris density in marine and coastal environments are scarce, indicating a gap in the measurement capacity. Data on average marine acidity are scarce and regional aggregations are only available for North America, and data on the percentage of countries using ecosystem based approaches to managing marine areas are limited. This is also the case for data on the water quality for groundwater bodies, which is very limited as compared to water quality for surface water. Additionally, there is a lack of gender disaggregated data, which prevents analysis of the gender differentiated impacts of pollution.
This gap in data availability, which varies across issues and regions, points to limited reporting capacities, resources and technology, including laboratory capacity, and in some cases complicated indicator methodologies.
-
The selected SDG indicators and complementary global indicators only address certain aspects of drivers and pressures, states and impacts and responses.▼
Clear gaps were identified in the coverage of the SDGs and other indicators across the DPSIR framework. Air pollution emissions, for instance, are not well covered by the SDG framework, which only measures emissions of CO2. Other data exist globally (EDGAR database) that measure some of these emissions, including sulphur dioxide, nitrogen oxides, carbon monoxide and black carbon emissions.
In terms of concentrations, only PM2.5 is measured, leaving out other key pollutants such as tropospheric ozone, heavy metals, persistent organic pollutants, toxic gases including carbon monoxide, volatile organic compounds, nitrogen dioxide (NO2) and sulphur dioxide (SO2).
The mortality rate due to air pollution exposure (3.9.1) is only a partial measurement of impacts, as it excludes other health impacts, and impacts on the environment, and social and economic dimensions. The SDGs do not include indicators which measure responses directly targeting air pollution, but only address drivers, pressures or responses to climate change.
In relation to soil pollution, health impacts are not measured, only a limited range of sources and contaminants are considered, with the absence of emerging pollutants, and contaminated sites are not covered. Most SDG indicators identified for land and soil pollution are only indirectly relevant: state and impact indicators primarily measure land use, forest management, land degradation, mountain green cover and soil pH, omitting other aspects of soil contamination and health impacts. Response indicators are primarily related to biodiversity measures, with no specific indicator aimed specifically at pollution prevention and control.
Emerging policy issues identified by SAICM, or issues of concern identified in the Global Chemicals Outlook II (GCOII), and referred to in UNEA resolution 5/7 (e.g., AMR, EDCs), are not well reflected in global indicators. While there are global mechanisms for monitoring pollutants in the environment in support of implementation of some MEAs (e.g., for POPs), there is a gap in the monitoring of many other pollutants, including in relation to emerging pollutants. Addressing this gap could include not only the development or strengthening of indicators, but also the establishment and strengthening of national biomonitoring and epidemiological surveillance systems to identify, assess, and monitor impacts and diseases attributable to pollution and regular surveillance in the environment. Specific recommendations have been provided in thematic reports, for instance in UNEP’s report on the environmental dimensions of antimicrobial resistance (UNEP 2023).
In general, the SDG indicator framework has limited ability to assess progress in terms of policy, regulatory and in particular, implementation action, which is key to assess sustainable progress, and only MEA-based reporting and ad-hoc efforts, such as those undertaken by UNEP in reviewing air quality action, provide detailed information on this, a gap that could be filled with more regular reporting and review, ideally as part of existing mechanisms, to reduce the reporting burden. A more complete assessment of existing agreements and initiatives and a more in-depth analysis of indicators and sub- indicators across various pollution themes is needed for a more complete overview. The Global Framework on Chemicals - For A Planet Free of Harm From Chemicals And Waste provides a comprehensive set of indicators to support taking stock of progress in support of the vision and implementation of the framework, however the focus of the framework is chemicals and waste, with limited reference made to pollution.
-
The review of the indicator data available provides a mixed picture of the global situation of pollution: challenges continue to be faced regionally, and in particular by developing countries, across all pollution themes.▼
The analysis of the selected pollution-related indicators for which data is available and allows for trend analysis, indicates that overall, more indicators are showing an improving environmental trend than a worsening environmental trend. A majority of the indicators that show an improving environmental trend are response indicators, while most of the indicators displaying a declining environmental trend are driver and pressure related indicators. A slight majority of state and impact indicators show an improving situation. Given that a significant proportion of the indicators in the framework used to assess pollution globally do not allow for trend analysis due to a lack of data, the trends observed may not be fully representative of the global situation; a more complete set of data may give a different picture in terms of improving or worsening trends.
The SDG framework does not provide a complete picture of all the key drivers, pressures, states and impacts and responses for all types of pollution. Nonetheless, the data are sufficient to show that while there is general increase in responses over time, drivers, pressures and states and impacts are worsening or not improving, which indicates that while momentum to address pollution issues globally has increased, this progress is not reflected by reduced drivers. Pressures of pollution or an improved situation for the environment.
Although SDG data provide a very partial image of the level of policy action targeted to pollution reduction, even with the limited data available, complemented with the findings of many global thematic reports reviewed for this report, it is clear that deployment of existing solutions to pollution is very uneven, pointing to lack of capacities, resources, access to technology and equipment.
Recommendations
- Establish an effective system for regular review of progress towards a pollution-free planet
- Improve existing indicators and methodologies and strengthen reporting capacities
- Strengthen efforts to identify sources and emissions of pollution and to monitor pollutants’ concentrations in the environment
- Strengthen the science-policy interface
- Strengthen regulatory approaches and implementation capacities
- Mobilize key players along value chains and enhance financial investments
- Mobilize the wider development and health sector, including the UN system
- Finance and incentivize pollution reduction efforts and infrastructure
- Raise public awareness and engage citizens