Introduction and progress
This report is part of the series entitled Measuring Progress published by UNEP. The report provides updates on the progress made on the environmental dimension of sustainable development. It also includes a statistical analysis to better understand interlinkages between the environmental, social and economic dimensions of sustainable development.
The current report is a special edition that focuses on proposing disaggregation for the 92 environment-related SDG indicators and their relevance to policymaking and impacts.
1.1 Introduction
The 2030 Agenda for sustainable development centres on leaving no one behind. The SDG statistical framework, adopted in 2015, ensures that all dimensions of sustainable development are considered and represented by a set of indicators. The coverage of these indicators varies according to the respective topics. While some indicators provide a specific perspective (e.g. SDG indicator 3.1.1 on maternal mortality ratio), others present a high-level perspective (e.g. SDG indicator 6.3.2 on the proportion of bodies of water with good ambient water quality). With the absence of more disaggregated data, the latter group lack the granularity to provide better guidance for science-based policies.
Disaggregation is defined as “the breakdown of observations, usually within a common branch of a hierarchy, to a more detailed level to that at which detailed observations are taken” (Expert Group on International Economic and Social Classifications 2018).
Resolution 71/313 by the United Nations Statistical Commission to disaggregate SDG indicators by multiple characteristics (income, sex, age, race, ethnicity, migratory status, disability or other characteristics, where applicable) according to the Fundamental Principles of Official Statistics was adopted by the General Assembly on 10 July 2017 (United Nations General Assembly [UNGA] 2017a).
In addition to the stated characteristics, environmental policies may require categories of disaggregation that are not common with social or economic dimensions. For instance, measuring the proportion of bodies of water with good ambient water quality (SDG indicator 6.3.2) or the changes over time in the extent of water-related ecosystems (SDG indicator 6.6.1). These require a disaggregation by type of water body and river basin respectively to assess the status and develop targeted policies to protect them.
Most environmental policies are developed at national and sub-national levels. This requires the availability of disaggregated data to develop evidence-based policies (United Nations Environment Programme [UNEP] 2023a). Halfway through the implementation period of the SDG framework, several indicators have disaggregated data, including environment-related SDG indicators.
This special edition focuses on disaggregation at the indicator level and its importance in developing targeted evidence-based policies at national and/or sub-national levels. Each indicator is examined separately to propose meaningful disaggregation that is, at present, mostly unavailable. In addition, potential impacts of proposed policies on society, the economy and the environment are also showcased. As the list of proposed disaggregation is extensive, countries are encouraged to focus on the disaggregation that is relevant to their national circumstances and their needs for policymakers.
1.2 Global progress on the environmental dimension of the SDGs;
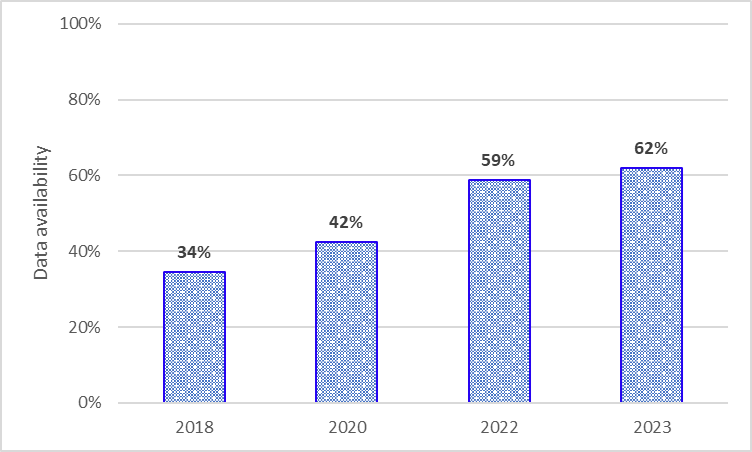
A global analysis shows positive and steady improvement in data availability. The environmental dimension of the SDGs was once the least data-populated, with only 34 per cent of indicators with sufficient data for analysis in 2018. This has increased to 62 per cent as of September 2023. This improvement in data availability has pinpointed indicators that are showing positive trends and those that are showing negative trends or little change.
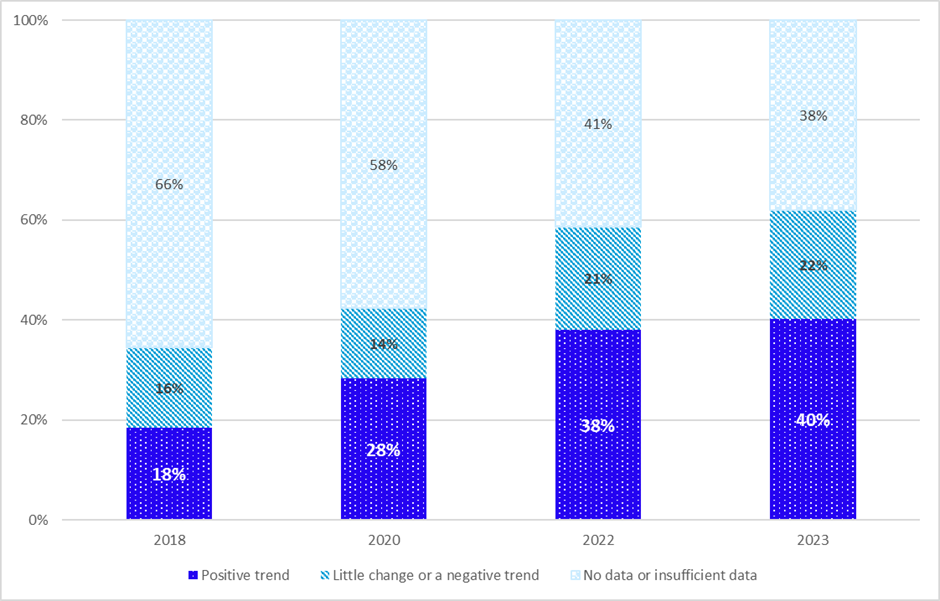
In comparison to analyses in previous years, Figure 2 below showcases the evolution in indicator trends over the past five years. In 2023, 40 per cent of the 92 environment-related SDG indicators showed a positive trend and 22 per cent indicated negative trends or little change. While 38 per cent of the indicators did not contain sufficient data for analysis or had no data.
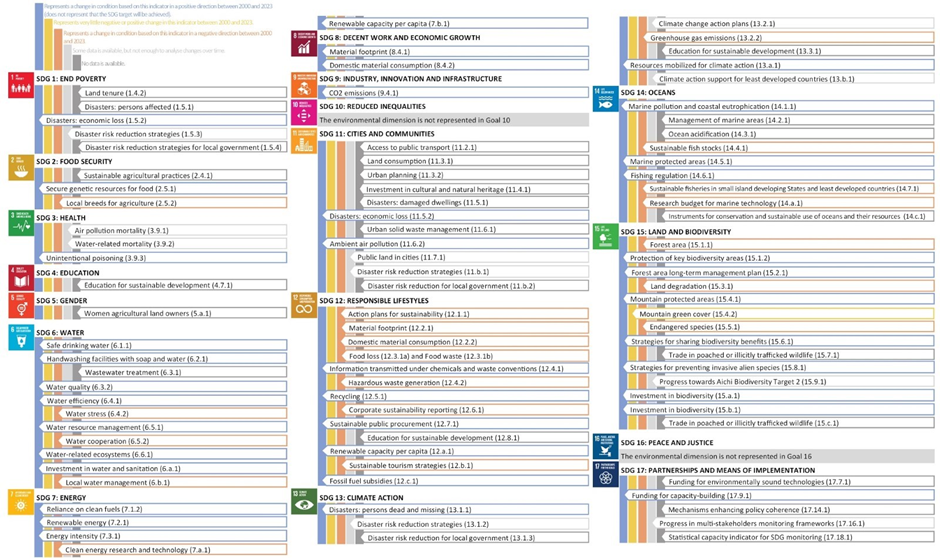
As more data becomes available, improved trend analysis can be done to understand whether the underlying data shows environmental improvement or degradation. For instance, material footprint per unit of GDP (GDP 8.4.1) and domestic material consumption per unit of GDP (SDG 8.4.2) both show a positive trend. Whereas the same indicators per capita (SDGs 12.2.1 and 12.2.2) show a negative trend. This reveals that the global efficiency of material use in the consumption of goods has improved but global material use through individual consumption has deteriorated. Examples such as these underline the importance of disaggregated data in the analysis of an environmental issue from different angles and to adapt policy-making to different contexts and circumstances.
While many indicators previously did not have sufficient data for analysis, many currently show a shift from no data to some data, or from some data to positive or negative trends. This is a welcome improvement. For instance, sustainable public procurement (SDG 12.7.1) and official development assistance for biodiversity by recipient countries (SDG 15.b.1) show a positive trend in 2023 despite there being no data to analyse in previous years. For corporate sustainability reporting (SDG 12.6.1), sustainable tourism strategies (SDG 12.b.1) and land degradation (SDG 15.3.1) there are negative trends, where previously these indicators did not possess sufficient data for analysis. While a negative trend is not beneficial for the protection of the environment, increased data availability enables policy-makers to make evidence-based decisions to address the underlying issues.
Halfway through the 2030 Agenda, there remains a set of indicators (totalling 20 environment-related SDG indicators) for which data was never available for a global analysis of trends. A deeper analysis shows that these 20 indicators represent 15 unique SDG indicators.
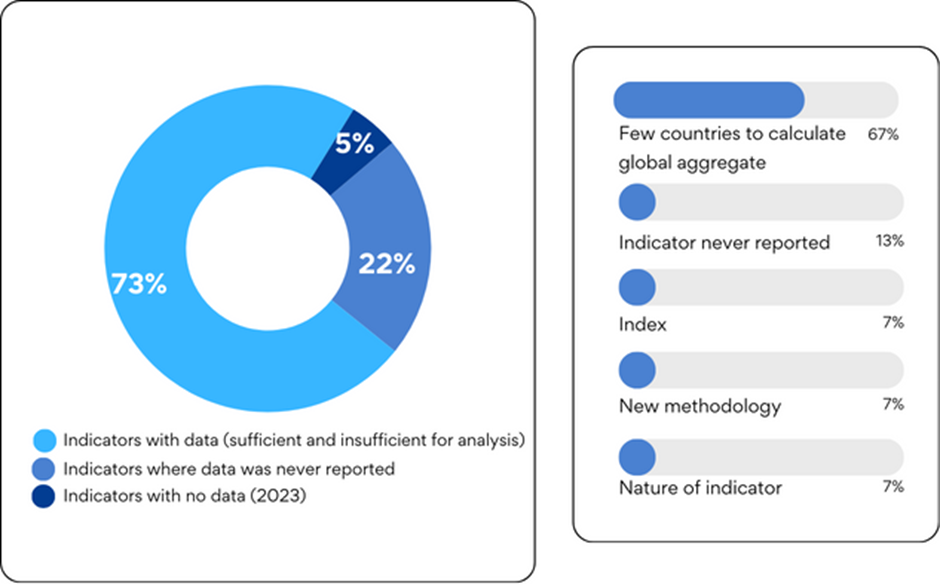
Out of the 15 unique SDG indicators, two-thirds contain data for analysis at national level. However, the limited number of countries that report these indicators is causing the lack of aggregated data at the global level. Thirteen per cent of indicators were never reported – at national or any aggregated level. While a further 7 per cent fall into the following categories:
- Indexes – where the indicator data is available at national level but no aggregate at global or regional level was computed by the custodian agency.
- New methodology – where the indicator data was only reported for the first time in December 2023.
- Nature of the indicator – where the indicator is designed to collect data at city level so national or aggregated level data is not possible.
This indicates that data exists for 80 per cent of the indicators and, with upcoming data updates, data at global level for 12 unique SDG indicators is on the trend of improvement.
