

2.b Interactions with the environment
2.b.1 Level of water stress: freshwater withdrawal as a proportion of available freshwater resources
General information
This indicator of circular economy corresponds to the SDG 6.4.2 Level of water stress: freshwater withdrawal as a proportion of available freshwater resources.
The presented methodology for this indicator is based on UNSD’s Metadata for 6.4.2 and UN-Water’s Step-by-step methodology for monitoring water stress (6.4.2) (2016).
SDG target 6.4 aims to substantially increase, by 2030, water-use efficiency across all sectors and ensure sustainable withdrawals and supply of freshwater to address water scarcity and substantially reduce the number of people suffering from water scarcity.
SDG indicator 6.4.2 on Level of water stress: freshwater withdrawal as a proportion of available freshwater resources has three indicators in total, one Level I, one Level II and one Level III (see Table 2. 13). Three levels of measurement are envisaged, recognizing that countries have different starting points in water stress monitoring. So the three levels approach allows countries to begin monitoring efforts at a level in line with their national capacity and available resources, and from there advance progressively.
| LEVEL I INDICATOR | |
| Level of water stress: freshwater withdrawal as a proportion of available freshwater resources | Estimations based on national data aggregated to the country level. |
| LEVEL II INDICATOR | |
| LEVEL III INDICATOR | |
| Level of water stress: freshwater withdrawal as a proportion of available freshwater resources | The nationally produced data have high spatial and temporal resolution and can be fully disaggregated by source and use. |
Indicator interpretation
The purpose of this indicator is to show the degree to which water resources are being exploited to meet the country’s water demand. It measures a country’s exerted pressure on its water resources and therefore the challenge on the sustainability of its water use. It tracks progress regarding withdrawals and supply of freshwater to address water scarcity.
The indicator shows to what extent water resources are already used, and signals the importance of effective supply and demand management policies. This indicator also provides an estimate of pressure by all sectors on the country’s renewable freshwater resources. It indicates the likelihood of increasing competition and conflict between different water uses and users in a situation of increasing water scarcity.
Increased water stress, shown by an increase in the value of the indicator, has potentially negative effects on the sustainability of the natural resources and on economic development. On one hand, a high level of water stress represents significant withdrawal of freshwater by all sectors out of the total renewable freshwater resources available yearly, with potentially larger impacts on the sustainability of the resources and potential situations of conflicts and competition between users.
On the other hand, low values of the indicators indicate that water does not represent a particular challenge for economic development and sustainability. A low level of water stress indicates a situation where the combined withdrawal by all sectors is marginal in relation to the resources and has therefore little potential impact on the sustainability of the resources or on the potential competition between users. However, extremely low values may indicate the inability of a country to use properly its water resources for the benefit of the population. In such cases, a moderate and controlled increase in the value of the indicator can be a sign of positive development.
In practical terms, the threshold of 25% has been identified as the upper limit for a full and unconditional safety of water stress. That means that values below 25% can be considered safe in any instance (no stress), while values above 25% should be regarded as potentially and increasingly problematic and should be qualified and/or reduced.
Above 25% of water stress, four classes have been identified to signal different levels of stress severity:
- NO STRESS <25%
- LOW 25% - 50%
- MEDIUM 50% - 75%
- HIGH 75-100%
- CRITICAL >100%
Data availability
All the data needed for the compilation of the indicator can be found in the AQUASTAT database of FAO26. Using AQUASTAT data would be probably the simplest way to compile the indicator in the short term. It is important to note that AQUASTAT data is based on national data, and extrapolated or forecasted for additional years in case countries do not report their national data. In some countries water resources are not inventoried or data are not kept up to date. In these cases, AQUASTAT database includes estimated data27.
As FAO is the custodian agency for this SDG indicator, data collection for SDG 6.4.2 is done through the AQUASTAT questionnaire on water and agriculture and FAO’s Global Information System on Water and Agriculture (AQUASTAT).
Data for this indicator are usually collected by national ministries and institutions having water-related issues in their mandate, such as national statistic offices, ministries of water resources, agriculture or environment. Official counterparts at country level are the national statistics office and/or the line ministry for water resources and irrigation. More specifically, FAO requests countries to nominate a National Correspondent to act as the focal point for the data collection and communication. As of August 2020, 150 countries have nominated national correspondents. Data are mainly published within national statistical yearbooks, national water resources and irrigation master plans and other reports (such as those from projects, international surveys or results and publications from national and international research centres).
Limitations in the use of the indicator
Freshwater withdrawal as a percentage of renewable freshwater resources is a good indicator of pressure on limited water resources, one of the most important natural resources.
However, it only partially addresses the issues related to sustainable water management. Supplementary indicators that capture the multiple dimensions of water management would combine data on water demand management, behavioural changes regarding water use and the availability of appropriate infrastructure, and measure progress in increasing the efficiency and sustainability of water use, in particular in relation to population and economic growth. They would also recognize the different climatic environments that affect water use in countries, especially in agriculture, which is the main user of water. Sustainability assessment is also linked to the critical thresholds fixed for this indicator. Although there is no universal consensus on such thresholds, a proposal is presented below.
Trends in freshwater withdrawal show relatively slow patterns of change. Usually, three-five years are a minimum frequency to be able to detect significant changes, as it is unlikely that the indicator would show meaningful variations from one year to the other.
Estimation of water withdrawal by sector may represent a limitation to the computation of the indicator. Few countries publish water withdrawal data on a regular basis by sector.
Other limitations that affect the interpretation of the water stress indicator include:
- Difficulty obtaining accurate, complete and up-to-date data;
- There is no universally agreed method for the computation of incoming freshwater flows originating outside of a county’s borders;
- Potentially large variation of sub-national data;
- Lack of historical account (e.g., due to climate change and population growth) and seasonal variations in water resources;
- Lack of consideration to the distribution among water uses;
- Lack of consideration of water quality and its suitability for use; and
- The value of the indicator can be higher than 100 percent when (a) water withdrawal is from non-renewable freshwater (fossil groundwater), (b) when annual groundwater withdrawal is higher than annual replenishment (over-abstraction), (c) when freshwater withdrawal includes part, or (d) all the water set aside is for environmental flow requirements.
Some of these issues can be solved through disaggregation of the indicator at the level of hydrological units and by distinguishing between different use sectors. However, due to the complexity of water flows, both within and between countries, care should be taken not to double-count.
Definitions
“Desalinated water produced is the volume of water produced annually by desalination of brackish or salt water. It is estimated annually on the basis of the total capacity of water desalination installations” (UN-Water’s Step-by-step methodology for monitoring water stress (6.4.2) (2016)).
“Direct use of agricultural drainage water: Agricultural drainage water is water withdrawn for agriculture but not consumed or returned. It can be recovered and reused and thus is considered to be a secondary source of water, contrary to primary water resources, which are the renewable freshwater resources. Like desalinated water and wastewater, it is also considered as a type of non-conventional water” (UN-Water’s Step-by-step methodology for monitoring water stress (6.4.2) (2016)).
“Direct use of treated municipal wastewater refers to treated municipal wastewater (primary, secondary, tertiary effluents) directly used, i.e. with no or little prior dilution with freshwater during most of the year” (UN-Water’s Step-by-step methodology for monitoring water stress (6.4.2) (2016)).
“Environmental flows requirements (EFR) are defined as the quantity and timing of freshwater flows and levels necessary to sustain aquatic ecosystems which, in turn, support human cultures, economies, sustainable livelihoods, and wellbeing. Water quality and also the resulting ecosystem services are excluded from this formulation which is confined to water volumes. This does not imply that quality and the support to societies which are dependent on environmental flows are not important and should not be taken care of. They are indeed taken into account by other targets and indicators, such as SDG 6.3.2, SDG 6.5.1 and SDG 6.6.1” (UN-Water’s Step-by-step methodology for monitoring water stress (6.4.2) (2016)).
“External renewable water resources refer to the flows of water entering the country, taking into consideration the quantity of flows reserved to upstream and downstream countries through agreements or treaties (and, where available, the reduction of flow due to upstream withdrawal)” (UN-Water’s Step-by-step methodology for monitoring water stress (6.4.2) (2016)).
External Renewable Water Resources (ERWR): The part of the country’s renewable water resources that is not generated within the country. The ERWR include inflows from upstream countries (groundwater and surface water), and part of the water of border lakes or rivers. It takes into consideration the quantity of flows reserved to upstream and downstream countries through agreements or treaties. (UN-Water’s Step-by-step methodology for monitoring water stress (6.4.2) (2016)).
“Freshwater refers to water occurring on the earth’s surface in glaciers, lakes and rivers (i.e. surface water), and underground in aquifers (i.e. groundwater). Its key factor is a low concentration of dissolved salts. The term excludes rainwater, water stored in the soil (soil moisture), untreated wastewater, seawater and brackish water” (UN-Water’s Step-by-step methodology for monitoring water stress (6.4.2) (2016)).
“Internal renewable water resources are defined as the long-term average annual flow of rivers and recharge of groundwater for a given country generated from endogenous precipitation” (UN-Water’s Step-by-step methodology for monitoring water stress (6.4.2) (2016)).
“Level of water stress is the ratio between total freshwater withdrawn by all major sectors and total renewable freshwater resources, after having taken into account environmental flow requirements. Main sectors, as defined by ISIC standards, can include for example, agriculture; forestry and fishing; manufacturing; electricity industry; and services” (UN-Water’s Step-by-step methodology for monitoring water stress (6.4.2) (2016)). This indicator is also known as water withdrawal intensity.
“Total freshwater withdrawal (TFWW) is the volume of freshwater extracted from its source (rivers, lakes, aquifers) for agriculture, industries and services. It is estimated at the country level for the following three main sectors: agriculture, services (including domestic water withdrawal) and industries (including cooling of thermoelectric plants). Freshwater withdrawal includes fossil groundwater. It does not include direct use of non-conventional water (i.e. direct use of treated wastewater, direct use of agricultural drainage water and desalinated water)” (UN-Water’s Step-by-step methodology for monitoring water stress (6.4.2) (2016)).
“Total renewable freshwater resources (TRWR) are expressed as the sum of (a) internal renewable water resources (IRWR) and (b) external renewable water resources (ERWR). The term “water resources” is understood here as freshwater resources” (UN-Water’s Step-by-step methodology for monitoring water stress (6.4.2) (2016)).
“Wastewater is water which is of no further immediate value to the purpose for which it was used or in the pursuit of which it was produced because of its quality, quantity or time of occurrence. However, wastewater from one user can be a potential supply to another user elsewhere. Cooling water is not considered to be wastewater” (UN-Water’s Step-by-step methodology for monitoring water stress (6.4.2) (2016)).
Calculations
Level I Indicator
The indicator can be populated with estimations based on national data aggregated to the country level. If needed, data can be retrieved from internationally available databases on water availability and withdrawals by different sectors. Inclusion of estimation of environmental flows requirements based on literature values.
Level II Indicator
The indicator can be populated with nationally produced data, which increasingly can be disaggregated to the sub-national basin unit level. Inclusion of estimation of environmental flows requirements based on literature values.
As data from different sectors and sources are needed for the computation of this indicator at level II and III, it is necessary that national coordination is in place to assure the timely and consistent collection of the data. The data for this indicator should be collected annually.
Data collection at sub-national level would be advisable wherever possible, as that would provide a kind of information much more useful for decision making and implementation of water management plans. The disaggregation of the information at sub-national level should be done by basin units, collecting the data at the relevant level and considering the possible artificial transfer of water between basins.
Level III Indicator
The nationally produced data have high spatial and temporal resolution (e.g. geo-referenced and based on metered volumes) and can be fully disaggregated by source (surface water/groundwater) and use (economic activity). Literature values of environmental flows requirements are refined by national estimations.
Sectoral disaggregated data are provided to show the respective contribution of the different sectors to the water stress level, and therefore the relative importance of actions needed to contain water demand in the different sectors (agriculture, services and industry). The contribution of the different sectors to the water stress level is calculated as the proportion of sectoral withdrawals over total freshwater withdrawals, after taking into account the EFR. Sectors are defined following the United Nations International Standard Industrial Classification of All Economic Activities ISIC 4 coding:
- Agriculture; forestry; fishing (ISIC A), hereinafter “agriculture”;
- Mining and quarrying; manufacturing; electricity, gas, steam and air conditioning supply; constructions (ISIC B, C, D and F), hereinafter “MIMEC”;
- All the service sectors (ISIC E and ISIC G-T), hereinafter “services”.
At national level, water resources and withdrawals are estimated or measured at the level of appropriate hydrological units (river basins, aquifers). It is therefore possible to obtain a geographical distribution of water stress by hydrological unit, thus allowing for more targeted response in terms of water demand management.
Information at sub-national level is especially important for larger countries or countries with marked climatic differences within their territory. The most advisable units to be used for this exercise are river basins, aggregated according to the circumstances of each country. A map of the country showing the administrative boundaries (provinces or districts) and basin boundaries should be prepared.
Compilation of the indicator
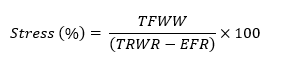
The indicator is computed as the total freshwater withdrawn (TFWW) divided by the difference between the total renewable freshwater resources (TRWR) and the environmental flow requirements (EFR), multiplied by 100. All variables are expressed in km3/year (109 m3/year).
The three components of the indicator are:
Total freshwater withdrawal (TFWW)
TFWW is in general calculated as being: [the sum of total water withdrawal by sector] minus [direct use of wastewater, direct use of agricultural drainage water and use of desalinated water]. In formula:

- Where:
- TFWW: Total freshwater withdrawal
- wws: Water withdrawal for sector “s”
- s: Agriculture, industry, energy, etc
- duu: Direct water use from source “u”
- u: Direct use of wastewater, direct use of agricultural drainage water and use of desalinated water
There are two tabs to be used to calculate the total freshwater withdrawal (see Figure 2. 59 and Figure 2. 60).
Agricultural water withdrawal (km3/yr)
Annual quantity of self-supplied water withdrawn for irrigation, livestock and aquaculture purposes. It includes water from over-abstraction of renewable groundwater or withdrawal of fossil groundwater, direct use of agricultural drainage water and (treated) wastewater, and desalinated water. This sector corresponds to the ISIC sector A (1-3).
Industrial water withdrawal (km3/yr)
Annual quantity of water withdrawn for industrial uses includes water from over-abstraction of renewable groundwater or withdrawal of fossil groundwater and potential use of desalinated water or direct use of (treated) wastewater. This sector refers to self-supplied industries not connected to the public distribution network. This sector corresponds to the ISIC sectors B [5-9]; C [10-33], D [35] and F [41-43].
Industrial water withdrawal does not include hydropower, but it is recommended to include in this sector the losses for evaporation from artificial lakes used for hydropower production28.
Services29 water withdrawal (km3/yr)
Annual quantity of water withdrawn primarily for the direct use by the population. It includes water from over-abstraction of renewable groundwater or withdrawal of fossil groundwater and the potential use of desalinated water or direct use of treated wastewater. It is usually computed as the total water withdrawn by the public distribution network. It can include that part of the industries, which is connected to the municipal distribution network. This sector corresponds to the ISIC sector E [36].
It is recommended to use the AQUASTAT questionnaires and the AQUASTAT water resources templates to collect the data required for the computation of the indicator. That will allow to upload directly the data into the AQUASTAT database, as appropriate since FAO is the custodian agency for the indicator. As an alternative, the tables presented in SEEA-Water can be used.

Once users fill in the direct water use and TFWW tabs, total direct water use and freshwater withdrawal (TFWW) will be calculated automatically.

Total renewable freshwater resources (TRWR) (km3/year)
Total Renewable Water Resources (TRWR) is the sum of internal and external renewable water resources.
TRWR (km³/year)= IRWR (km³/year)+ERWR (km³/year)
- Where:
- IRWR: Internal Renewable Water Resources
- ERWR: External Renewable Water Resources
- IM: Direct imports

Environmental flow requirements (EFR)
Methods of computation of EFR30 are extremely variable and range from global estimates to comprehensive assessments for river reaches. For the purpose of the SDG indicator, water volumes can be expressed in the same units as the TFWW, and then as percentages of the available water resources.
Although EFR varies among different ecosystems and climates, the International Water Management Institute (IWMI) estimates a worldwide average EFR of about 30%. When EFR is factored in the calculation of the indicator, in principle no environmental water scarcity should be considered up to a value of the indicator of 100%.
However, from the perspective of water usage for human needs, there are forms of water utilization, such as navigation or recreation, which do not imply withdrawal but still require a water flow beyond the EFR. Hence, we propose to consider serious water scarcity at 70% as indicator’s value.
In any case, the target for each country should be determined on a case-by-case basis, considering a variety of factors such as the level of development, the population density, the availability of non-conventional sources of water and the general climatic conditions.
Determination of the EFR can be done by application of various methods ranging from a simple hydrological approach to comprehensive holistic models. The approach should progressively consider the variability of flow regime during time and space, leading to the most recent Hydraulic/Habitat models (Parasiewicz, 2007).
FAO published the guidelines31 that provide a minimum standard method, principally based on the Global Environmental Flows Information System (GEFIS)32, and is the approach that will be used to generate the country EF data that will make up the global 6.4.2 report.
Users shall insert data about environmental flow requirements according to Figure 2. 62.

Level of water stress
The level of water stress tab of the workbook will then display the results based on the data input in the other worksheets. This is done automatically to facilitate the calculations of the indicator.

Note: When data are inserted in the Excel file tabs, some cells might turn red. This is to alert users to possible inconsistencies or errors that need to be verified.
26 AQUASTAT database is available at https://data.apps.fao.org/aquastat/?lang=en
27 AQUASTAT methodology is available at AQUASTAT - FAO's Global Information System on Water and Agriculture
28 Information can be found at http://www.fao.org/3/a-bc814e.pdf and http://www.fao.org/nr/water/aquastat/dams/index.stm#evaporation.
29 In AQUASTAT, Services water withdrawal is reported as municipal water withdrawal
30 FAO 2019. Incorporating environmental flows into “water stress” indicator 6.4.2 – Guidelines for a minimum standard method for global reporting
32 Accessible from http://eflows.iwmi.org