

SDG Indicator 11.6.1: Proportion of municipal solid waste collected and managed in controlled facilities out of total municipal waste generated, by cities
1. Key features and metadata
Definition: This indicator tracks the city's ability to responsibly collect and manage municipal solid waste.
| Sub-indicator | Disaggregated by |
|---|---|
|
EN_REF_WASCOL Municipal Solid Waste collection coverage, by cities (%) |
Cities |
Sources of information: Responses of countries (Ministry of Environment or equivalent national institution and National Statistical Offices) and cities/municipalities to the UNSD/UNEP Questionnaire on Environment Statistics or UN-Habitat’s Waste Wise Cities Tool.
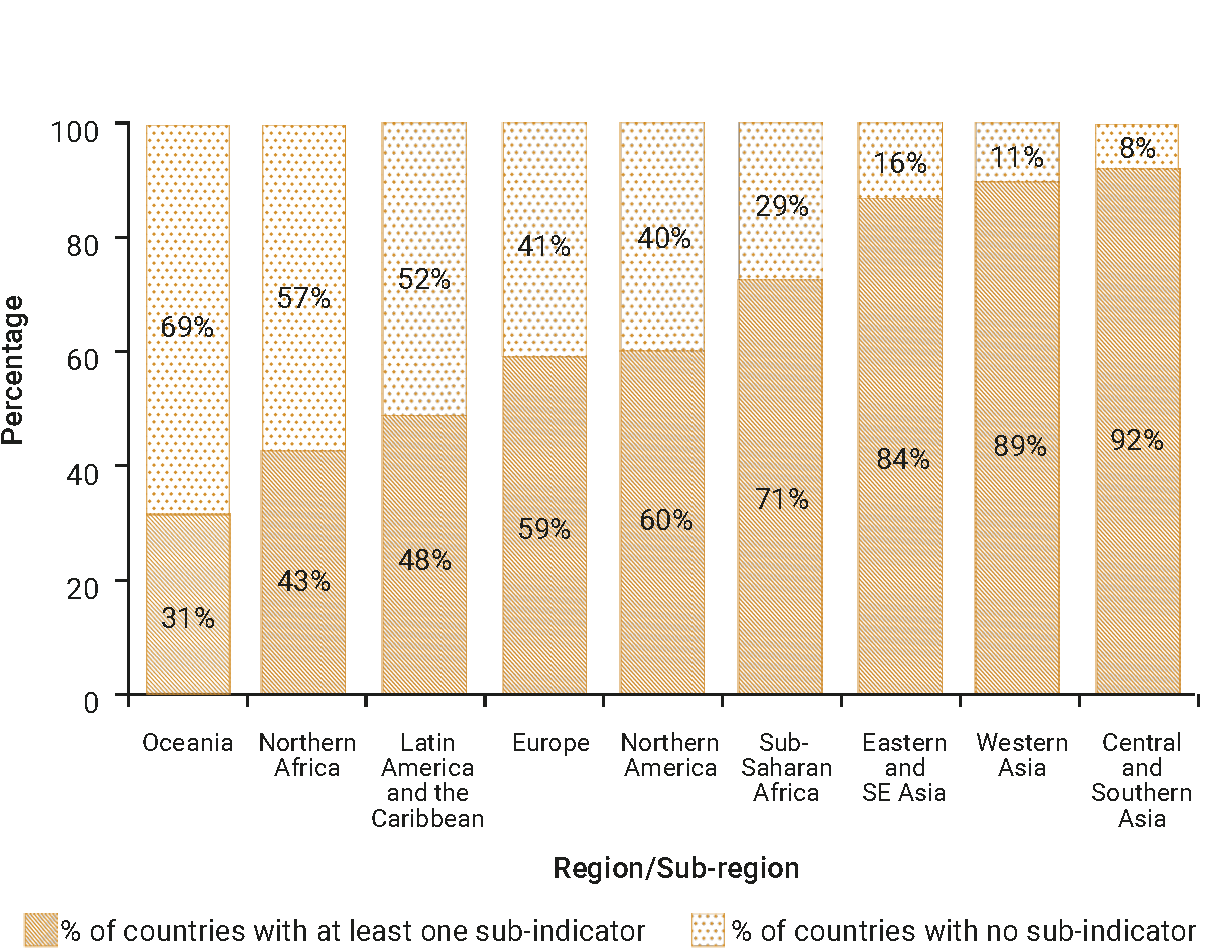
2. Data availability by region, SDG Global Database, as of 02 July 2025
3. Proposed disaggregation, links to policymaking and its impact
| Proposed disaggregation | Link to policymaking | Impact |
|---|---|---|
|
Disaggregation of municipal solid waste collection coverage, by type of waste (%) (UN-Habitat 2021):
Applies to:
|
The aim of this disaggregation is to provide detailed information on the composition of MSW collected by municipalities and its evolution over time (UN-Habitat 2021). Improving knowledge on the composition of MSW collection helps identify the most appropriate measures for minimizing waste generation at source. Where waste cannot be avoided, it also helps find the best options for the recovery of materials and energy from waste, their recycling into usable products, or their final disposal. Public authorities can also use this information to strengthen the waste management chain and support well-targeted investments in infrastructure, facilities and related services to the population. Information can be used to formulate further cost-effective waste management strategies for supporting the transition towards a circular economy. This disaggregation is consistent with the 10YFP (UN 2012; UNEP 2024c). |
Urban populations, especially in low- and middle-income countries, are exposed to major environmental and public health risks as a result of waste mismanagement (UNEP 2015). The development and, more importantly, implementation of targeted municipal waste collection and management policies contribute to the improvement of the health of the populations. They also contribute to reducing the impact of waste on the environment – especially when portions of collected municipal waste could be used as compost, recycled or reused (Kaza et al. 2018). |
|
Total and per capita MSW generated by source of waste (tonnes) (UNEP 2021e; UN-Habitat 2021):
|
This disaggregation provides information for policymakers to optimize waste collection and management systems (nationally, locally and by sector) – especially in cities where a large amount of MSW remains uncollected (UNEP 2021e; UN-Habitat 2021). This is key information for helping local authorities refine their strategies to reduce the overall cost of waste management and realize significant budgetary savings. This disaggregation is consistent with the 10YFP (UN 2012; UNEP 2024c). |
A growing number of municipalities are interested in having better knowledge about their city’s waste and origins. This information helps them plan waste management and reduces the potential environmental impact of uncollected and mismanaged waste. It also helps them take advantage of developing effective waste management strategies; related business opportunities and value chains; and new sources of employment, sustainable livelihoods and ways of accelerating the city’s shift towards a circular economy (Kaza et al. 2018; UNEP n.d.a). |