

SDG 14. Conserve and sustainably use the oceans, seas and marine resources for sustainable development |
SDG Indicator 14.1.1: (a) Index of coastal eutrophication; and (b) plastic debris density
1. Key features and metadata
Definition: This indicator monitors the status of marine and coastal ecosystems with a focus on two major marine pollution issues: eutrophication and plastic leakage. It is composed of the Index of Coastal Eutrophication (ICEP) (14.1.1a) and the Plastic Debris Density (14.1.1b).
| Sub-indicator | Disaggregated by |
|---|---|
|
EN_MAR_COEUPO Indicator for Coastal Eutrophication Potential (ICEP) |
Nutrient Loading (Silica, Phosphorus, Nitrogen) |
|
EN_MAR_BEALIT_BV Beach litter originating from national land-based sources that ends in the beach (tonnes) |
Counterpart |
|
EN_MAR_CHLANM Chlorophyll-a anomaly, remote sensing (%) |
Frequency of Chlorophyll-a concentration |
|
EN_MAR_CHLDEV Chlorophyll-a deviations, remote sensing (%) |
No current data disaggregation available.
|
|
EN_MAR_DSI Dissolved silica (DSi) (kilograms of silica from algae biomass per sq. km. of river basin area per day) |
|
|
EN_MAR_TP Total Phosphorus (TP) (kilograms of phosphorus from algae biomass per sq. km. of river basin area per day) |
|
|
EN_MAR_TN Total Nitrogen (TN) (kilograms of nitrogen from algae biomass per sq. km. of river basin area per day) |
|
|
EN_MAR_BEALITSQ Beach litter per square kilometer (Number) |
|
|
EN_MAR_PLASDD Floating plastic debris density (count per km2) |
|
|
EN_MAR_BEALIT_BP Beach litter originating from national land-based sources that ends in the beach (%) |
|
|
EN_MAR_BEALIT_OP Beach litter originating from national land-based sources that ends in the ocean (%) |
|
|
EN_MAR_BEALIT_OV Beach litter originating from national land-based sources that ends in the ocean (tonnes) |
|
|
EN_MAR_BEALIT_EXP Exported beach litter originating from national land-based sources (tonnes) |
Sources of information: Data provided by national governments to UNEP as part of the Regional Seas Programmes or directly. Plus, globally derived data (e.g. from satellites or models) computed by UNEP from various sources: NOAA, GEO Blue Planet, the Global Nutrient Management System (GNMS), and the Scientific Advisory Committee of the Ad hoc and Open-Ended Expert Group on Marine Litter.
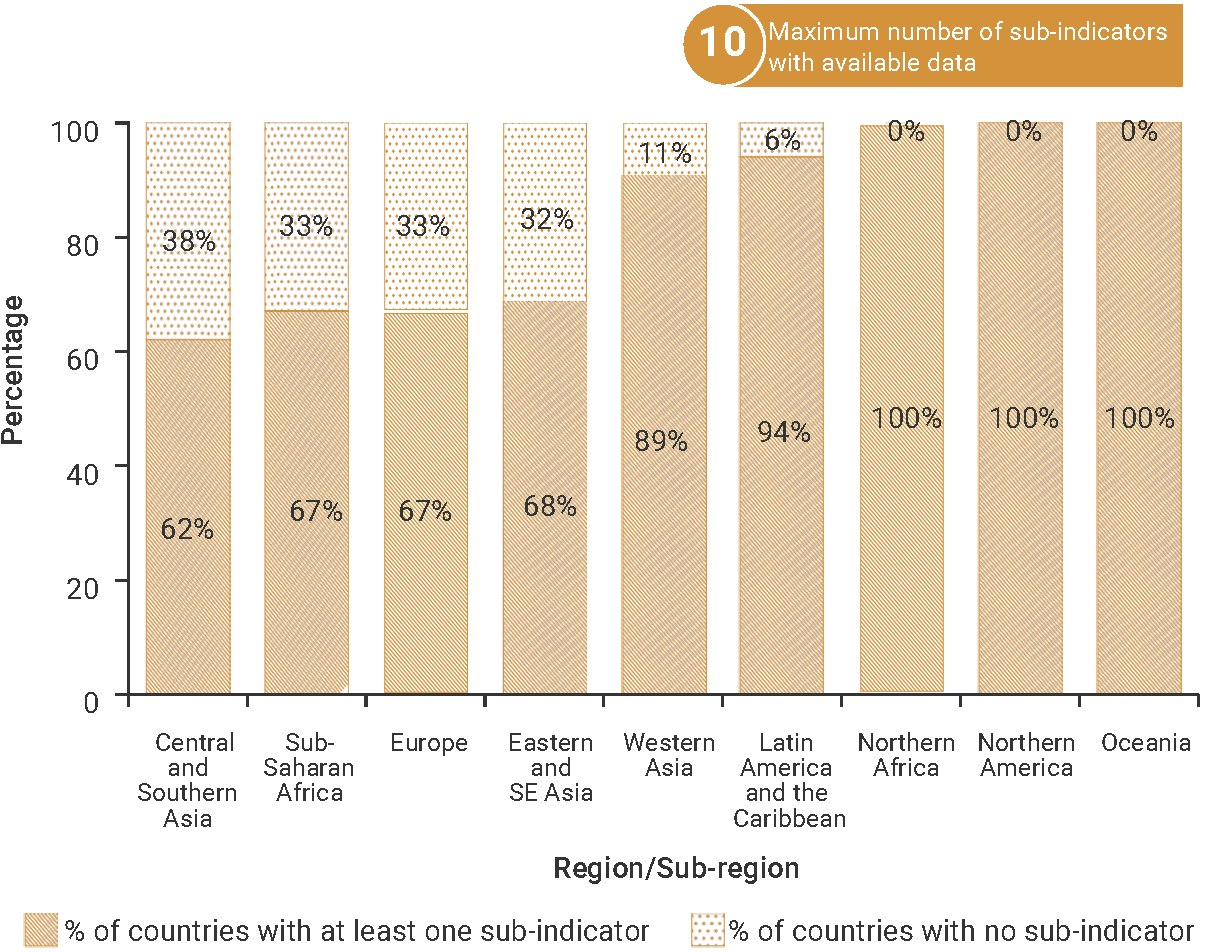
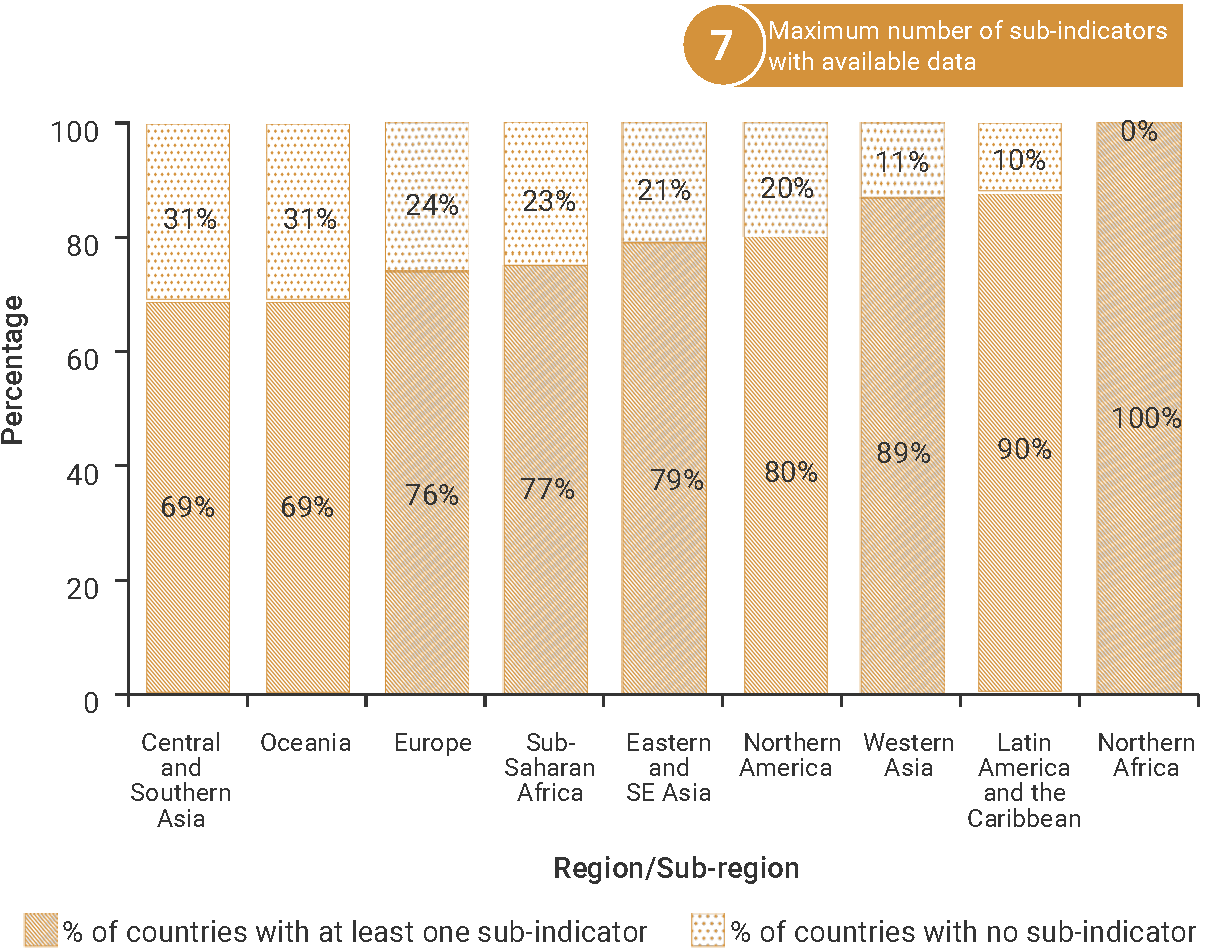
2. Data availability by region, SDG Global Database, as of 02 July 2025
3. Proposed disaggregation, links to policymaking and its impact
| Proposed disaggregation | Link to policymaking | Impact |
|---|---|---|
|
Index of Coastal Eutrophication Potential at river basin level Applies to:
|
This proposed disaggregation provides data at a very useful bio-geographic level for local decision-makers and coastal communities to monitor a broad range of relationships between the environment and human activities as well between land and sea (Spalding et al.2007; The Nature Conservancy [TNC] 2019). By identifying with greater precision the land-based and maritime sources of nutrient pollution (e.g. river exports, agriculture run-off, urban and industrial sewage, and transport), public authorities can take measures tailored to the specificity of each source. This will support a reduction in the amount of nutrient flows by river basin or by rivers reaching the ocean(s). For example, by reducing the use of fertilizers or improving the effectiveness of water sewage treatment, thus limiting the nutrient loads (United Nations Environment Programme World Conservation Monitoring Centre [UNEP–WCMC] 2023). In parallel, action can be taken to limit the impact of eutrophication on the coastal and marine environment due to toxic algal blooms and oxygen deficiency by restoring and rehabilitating eutrophication sensitive areas (e.g. preventing harmful algal proliferation or introducing buffer strips of vegetation). | This disaggregation can be used to restore polluted areas, to address the main causes of pollution and the human activities responsible and to inform concerned stakeholders on the development over time of marine water quality and its potential impact on human health and coastal and maritime activities (World Resources Institute [WRI] 2009). |
|
Index of Coastal Eutrophication Potential at the mouth of the river reaching the ocean Applies to:
|
||
|
Amounts of plastic (tonnes):
|
This disaggregation provides valuable insight into the pollution level and environmental status of the water column and the sea floor. A clearer picture of the state and pressures affecting the sea floor and the water column of the marine ecosystem helps in selecting relevant sets of measures and prioritizing these in a descending order. For example, the prevention and minimization of plastic use, reuse, recycling and other recovery and, when no other option is available, final disposal (UNEP 2021d). This disaggregation is relevant to the Kunming-Montreal Global Biodiversity Framework(GBF), Target 7: Reduce Pollution to Levels That Are Not Harmful to Biodiversity (CBD 2022), the Integrated Monitoring and Assessment Programme (United Nations Environment Programme Mediterranean Action Plan [UNEP-MAP] 2019) of the UNEP Mediterranean Action Plan (UNEP-MAP 2019), and the UNEA Resolution to end plastic pollution (UNEP 2022a). |
This disaggregated indicator helps understand the harmful impacts of the uncontrolled rise in plastic production and continued plastic leakage on the marine environment. These can include ecosystem processes disruption, entanglement of animals, ingestion by animals, damage to coral reefs, diffusion of pathogenic vectors, spread of invasive species, and detrimental effects on the benthic environment (UNEP 2021d). It also provides insights into the consequences for human health and the well-being of coastal communities as well as the associated high economic costs of plastic pollution. |