

SDG Indicator 14.3.1: Average marine acidity (pH) measured at agreed suite of representative sampling stations
1. Key features and metadata
Definition: This indicator measures the trends and variability of ocean acidification expressed as pH caused by an increase in the amount of dissolved atmospheric CO2 in the seawater.
| Sub-indicator | Disaggregated by |
|---|---|
|
ER_OAW_MNACD Average marine acidity (pH) measured at agreed suite of representative sampling stations |
Sampling stations |
Sources of information: Data is originated from different pathways: National Statistical Offices (NSOs), annual requests to the Intergovernmental Oceanographic Commission (IOC) national focal points, National Oceanographic Data Centres, international data centres, and directly with data providers via the Global Ocean Acidification – Observing Network (GOA-ON) data portal. The SDG 14.3.1 Data Portal is also a tool for the submission, collection, validation, storage, and sharing of ocean acidification data and metadata.
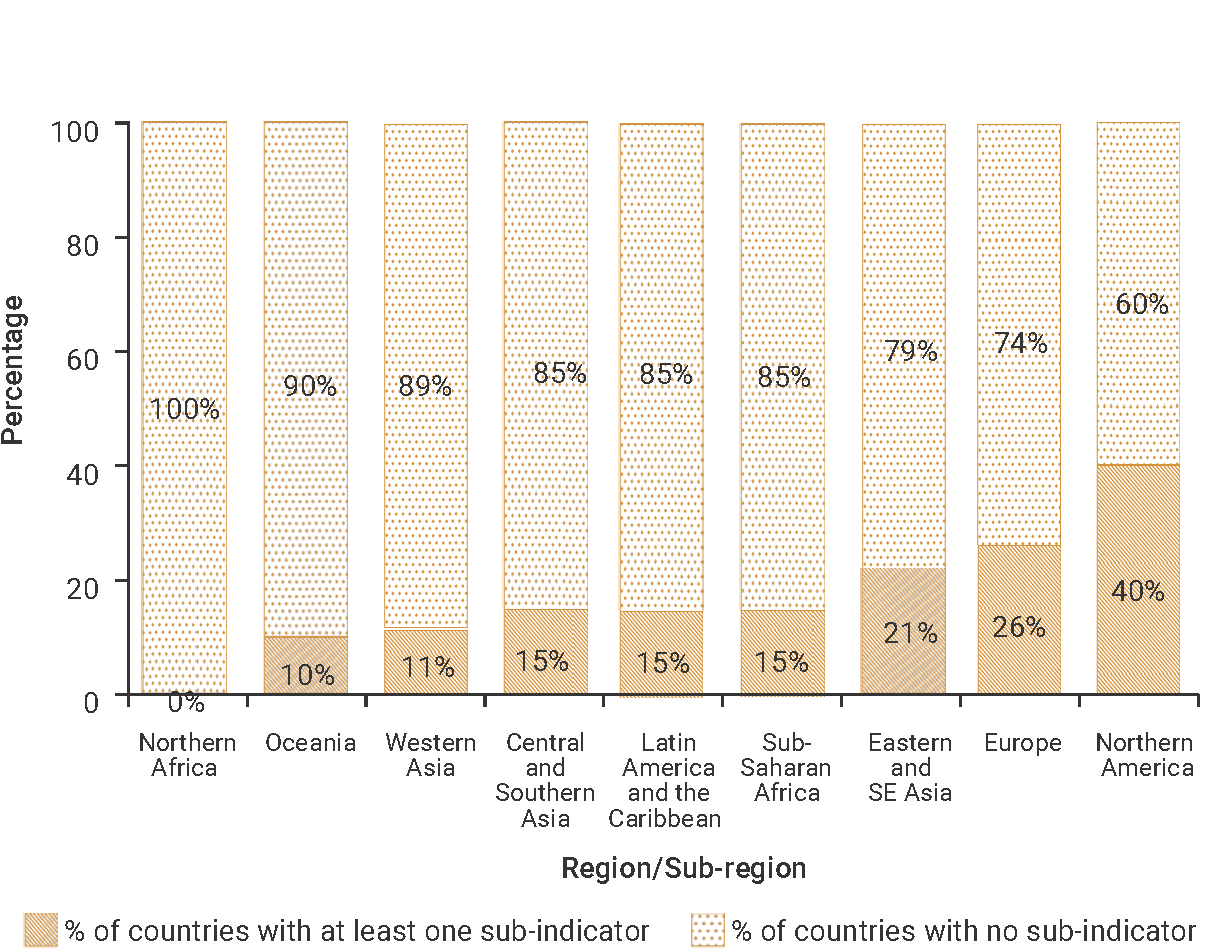
2. Data availability by region, SDG Global Database, as of 02 July 2025
3. Proposed disaggregation, links to policymaking and its impact
| Proposed disaggregation | Link to policymaking | Impact |
|---|---|---|
|
Minimum and maximum values of marine acidity (pH) |
This disaggregation provides valuable information on the variability of pH. This is more relevant for assessing the impacts of acidification on marine ecosystems. Nowadays, the ocean's average pH is 8.1, which is about 30% more acidic than in pre-industrial times. In total, 95% of open ocean surface water has become more acidic (International Atomic Energy Agency [IAEA] 2022). This indicator gives policymakers data on the changes (including temporal and spatial variability) in seawater acidification that can be used to define appropriate mitigation and adaptation measures to face the changing environmental conditions and to increase marine ecosystem health and resilience (Intergovernmental Panel on Climate Change [IPCC] 2021). It is directly linked to Ocean Acidification National Action Plans and informs the Kunming-Montreal Global Biodiversity Framework (GBF) (CBD 2022). |
Implementing targeted policies to halt ocean acidification and preserve marine life and ecosystems has a positive impact on the services these ecosystems provide. It also reduces the negative consequences on human activities such as fisheries and aquaculture, the food industry, tourism, and leisure. This alleviates the pressure on dependent communities (estimated at over three billion people) who rely on ocean resources for their livelihoods, income and diet. Furthermore, mitigating ocean acidification increases the ocean’s capacity to absorb CO2 from the atmosphere and thereby strengthens its role in moderating climate change (Intergovernmental Oceanographic Commission of the United Nations Educational, Scientific and Cultural Organization [IOC-UNESCO] 2022). The knowledge provided by this indicator can be used to improve management strategies and practices to reduce both ecosystem and economic vulnerability to ocean acidification by investing in ocean-based climate solutions (UN 2022b; IPCC 2023; UNESCO n.d.). |