

SDG Indicator 12.5.1: National recycling rate, tonnes of material recycled
1. Key features and metadata
Definition: This indicator measures the total amount and proportion of recycled material, including electronic waste.
| Sub-indicator | Disaggregated by |
|---|---|
|
EN_MWT_RCYV Municipal waste recycled (tonnes) |
No current data disaggregation available.
|
|
EN_MWT_RCYR Proportion of municipal waste recycled (%) |
|
|
EN_EWT_RCYV Electronic waste recycled (tonnes) |
|
|
EN_EWT_RCYR Proportion of electronic waste recycled (%) |
|
|
EN_EWT_RCYPCAP Electronic waste recycled, per capita (Kg) |
Sources of information: Data is provided by national governments, including National Statistical Offices (NSOs), Ministries of the Environment and other relevant organizations through the UNSD/UNEP Questionnaire on Environment Statistics (waste section).
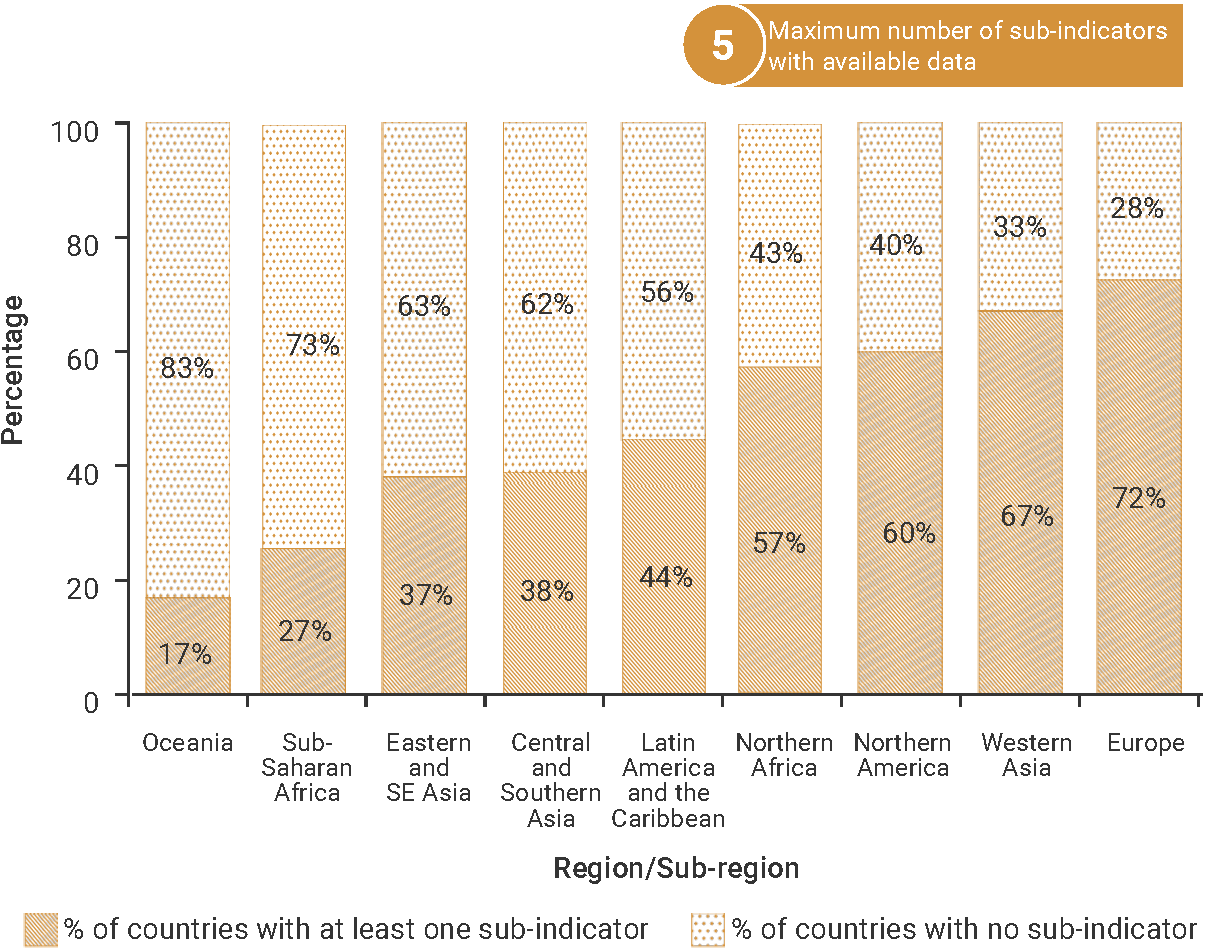
2. Data availability by region, SDG Global Database, as of 02 July 2025
3. Proposed disaggregation, links to policymaking and its impact
| Proposed disaggregation | Link to policymaking | Impact |
|---|---|---|
|
Proportion of recycled waste, by type of waste (%) (UNEP 2021e):
|
The aim of this disaggregation is to track the recycling rate for major groups of waste (i.e. e-waste, metals and packaging). Such information is critical for decision-makers to identify emerging trends and gaps, to decide upon what is to be done to address the waste stream and to devise policy measures adapted to the specificity of each group of waste, with a view to minimizing the production of waste and to maximizing their recycling. This disaggregation is consistent with objective vii of the 10YFP (UN 2012; UNEP 2024c). |
There is an urgent need to significantly increase knowledge on waste generation and recycling to monitor the development, adoption and implementation of policy instruments aimed at enhancing recycling performance and benefiting from the move towards greener economy (OPN n.d.). Such policies would benefit the environment because less waste would be disposed (i.e. via landfills or open dumps). Hence, reducing the deterioration of the environment. This would also benefit surrounding communities, as they would be less exposed to the impact of waste disposal (Baldé et al. 2022; OECD 2023c). |
|
Proportion of recycled waste, by recycling location (%) (UNEP 2021e):
|
This disaggregation provides information on the magnitude of waste managed in the country or exported material intended for recycling (UNEP 2021e; Baldé et al. 2022). Thereby, it can be used to redirect investment in partnership with concerned stakeholders (i.e. the private sector and urban authorities) to develop new national recycling capacity and take advantage of a better integrated circular economy. This disaggregation is consistent with objective vii of the 10YFP (UN 2012). |
As a result, national authorities making informed decisions will counteract the adverse social and economic consequences of international price fluctuations and support the strengthening of national recycling value chains – a central element of the long-term development of an effective circular economy (Kaza et al. 2018; UNEP 2021e). This also leads to job creation and a reduction in the quantities of waste that is disposed in the environment. |