

SDG Indicator 13.2.2: Total greenhouse gas emissions per year
1. Key features and metadata
Definition: This indicator measures the yearly total greenhouse gas emissions (GHG) of the Parties to the United Nations Framework Convention on Climate Change (UNFCCC).
| Sub-indicator | Disaggregated by |
|---|---|
|
EN_ATM_GHGT_AIP Total greenhouse gas emissions without Land Use, Land Use Change and Forestry (LULUCF) for Annex I Parties (Mt CO₂ equivalent) |
No current data disaggregation available.
|
|
EN_ATM_GHGT_NAIP Total greenhouse gas emissions without LULUCF for non-Annex I Parties (Mt CO₂ equivalent) |
Sources of information: Annual GHG inventory submissions from Annex I Parties. National communications (NC) and/or biennial update reports (BUR) from non-Annex I Parties.
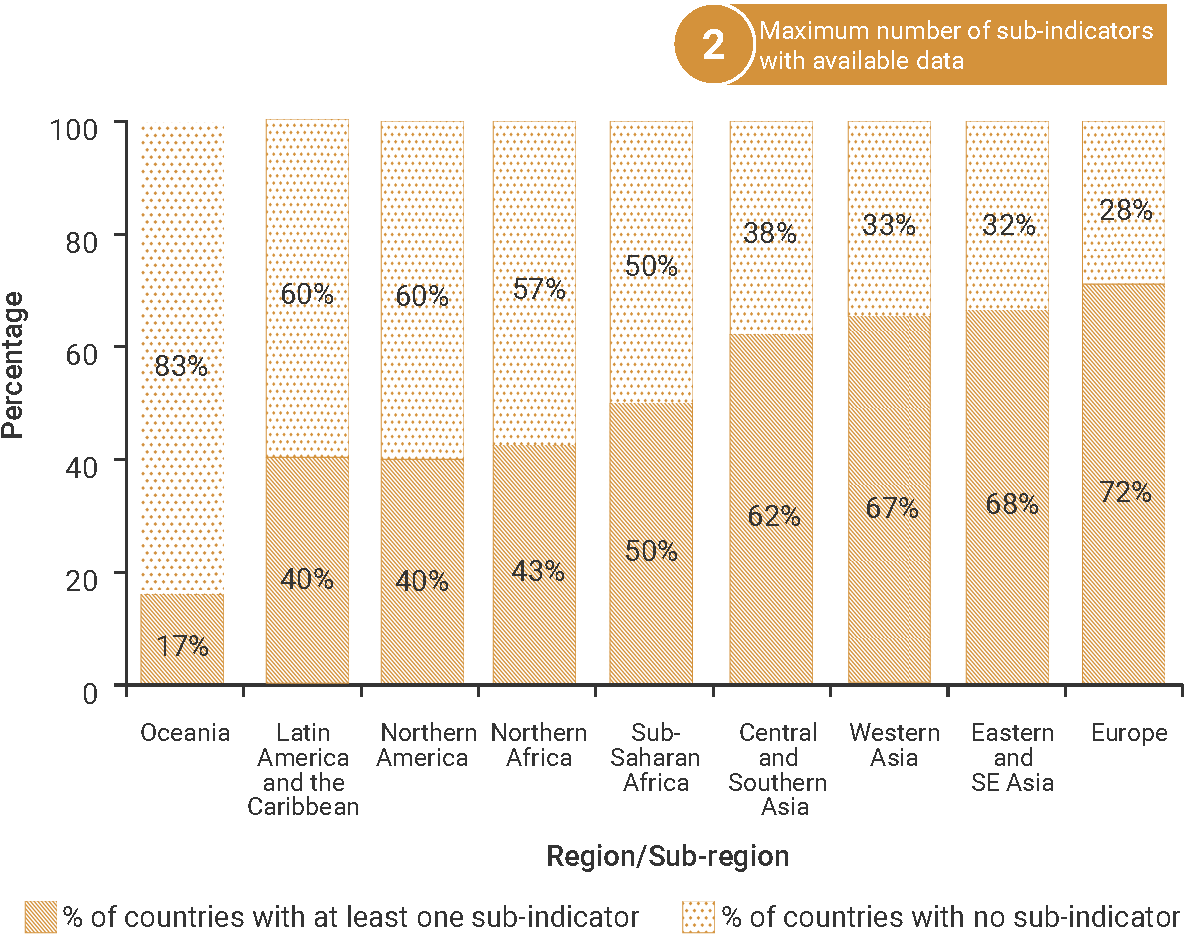
2. Data availability by region, SDG Global Database, as of 02 July 2025[1]
3. Proposed disaggregation, links to policymaking and its impact
| Proposed disaggregation | Link to policymaking | Impact |
|---|---|---|
|
Total greenhouse gas emissions, by category of emission (Mt CO₂ equivalent) (UNFCCC 2013):
Applies to:
|
The aim of this disaggregation is to differentiate the contribution of each GHG to the total yearly emissions of a country. This information is essential for developing policies and operational measures. For example, climate-resilient policies, accelerated adaptation and mitigation development plans, coordinated actions to facilitate SDG synergies, increased finance and capacity, international cooperation, and inclusive governance. These would target the reduction and eventual halt of activities that generate such GHGs. This disaggregation conforms to the obligations of Parties under the UNFCCC (UNFCCC 1992; UN 2015b). |
Each greenhouse gas produces a specific global warming effect. This is essential information for taking appropriate emissions reduction strategies and measures (UNEP 2022b). Carbon dioxide, methane and nitrous oxide have high global warming potential. Methane and nitrous oxide have respectively 28 and 265 times more global warming potential than CO₂ (IPCC 2014). The reduction in GHG emissions improves human health (through lower air pollution), especially with the transition to clean energy economy and transport (WHO 2023d; UN n.d.c). It also reduces the heating effect of the planet by the sun’s heat being trapped in the atmosphere by minimizing the rise in average temperatures and major impacts on extreme climate episodes (European Parliament [EP] 2023). |
|
Total greenhouse gas emissions, by sub-national administrative unit (Mt CO₂ equivalent) (administrative unit to be determined by countries) Applies to:
|
The monitoring of GHG emissions by relevant sub-national administrative units is useful for highlighting the differentiated contribution of territories to overall national GHG emissions. It allows policymakers, where appropriate, to set varying targets at sub-national administrative levels and their economic sectors (i.e. energy production, transport, housing, or agriculture) in accordance with their responsibilities for overall GHG emissions and their potential of reduction. Any national policy needs to address the wide diversity of local conditions, capacity of regions and their ability to deliver on climate change and SDG targets. It conforms to the obligations of Parties under the UNFCCC (UNFCCC 1992; UN 2015b). |
While mitigation policies are generally decided at the national level, they need to be implemented concretely at the local level. Local authorities, concerned economic sectors and stakeholders can act in several ways to reduce GHG emission. For example in the energy sector (investing in renewable energy resources), housing (building renovation or building energy efficiency), infrastructure and transport (public transportation, green mobility, clean fuels or electric vehicles) (OECD 2020). Citizens can also change their behaviour and consumption habits by adopting less polluting lifestyles. This can be encouraged through targeted incentives. In addition to a positive impact on the climate and the environment, local policies, programmes and individual actions to reduce GHG emissions foster technological evolution, which can improve the living conditions of the population and can provide new jobs by enabling the development of new ‘green’ economic activities. |
|
Total greenhouse gas emissions, by economic sector (Mt CO₂ equivalent) (UNFCCC 2013):
Applies to:
|
The monitoring of GHG emissions by relevant economic sector is most valuable for highlighting the differentiated contribution of each sector to overall national GHG emissions. It allows policymakers, where appropriate, to set varying targets tailored to each economic sector in accordance with their responsibilities for overall GHG emissions and their potential of reduction. The wide diversity of national economic activities, their importance in terms of economic output and employment, as well as their ability to deliver on climate change and SDG targets should be addressed. The disaggregation conforms to the obligations of Parties under the UNFCCC (UNFCCC 1992; UN 2015b). |
In 2020, sectors with the highest emissions were energy supply (37%), industry (26%), agriculture, forestry, and other land use (AFOLU) (18%), and transport (14%) (UNEP 2022b). Methane emissions are mostly generated by livestock rearing, landfill sites, and oil, gas and coal supply chains. The climate transition therefore requires substantial transformations in all productive sectors. For example, in the energy and transport systems, a shift from fossil fuels to clean renewable energies. In food chains, a less meaty diet. In the design of goods and services, promoting greater durability. In human settlements, more compact cities. And in the water industry, reduced methane from water treatment plants. It also requires major changes in the consumption patterns and behaviours of citizen-consumers to improve global energy and material use efficiency. This also leads to improved and healthier living conditions. The environment will benefit from less GHG emissions and is also part of the solution through the development of nature-based options like wind energy and natural carbon sequestration (UNEP 2022b; IPCC 2023). |
[1] A third sub-indicator’s data is available, representing the sum of total greenhouse gas emissions without LULUCF for Annex I and non-Annex I Parties.