

SDG Indicator 3.9.2: Mortality rate attributed to unsafe water, unsafe sanitation and lack of hygiene (exposure to unsafe Water, Sanitation and Hygiene for All (WASH) services)
1. Key features and metadata
Definition: This indicator monitors the mortality rate attributed to unsafe water, unsafe sanitation and lack of hygiene, defined as the number of deaths from unsafe water, unsafe sanitation and lack of hygiene in a year per 100,000 population.
| Sub-indicator | Disaggregated by |
|---|---|
|
SH_STA_WASHARI Mortality rate attributed to unsafe water, unsafe sanitation and lack of hygiene from diarrhea, intestinal nematode infections, malnutrition and acute respiratory infections (deaths per 100,000 population) |
No current data disaggregation available.
|
Sources of information: National Statistics Offices, various line ministries and databases covering civil registration with complete coverage and medical certification of cause of death.
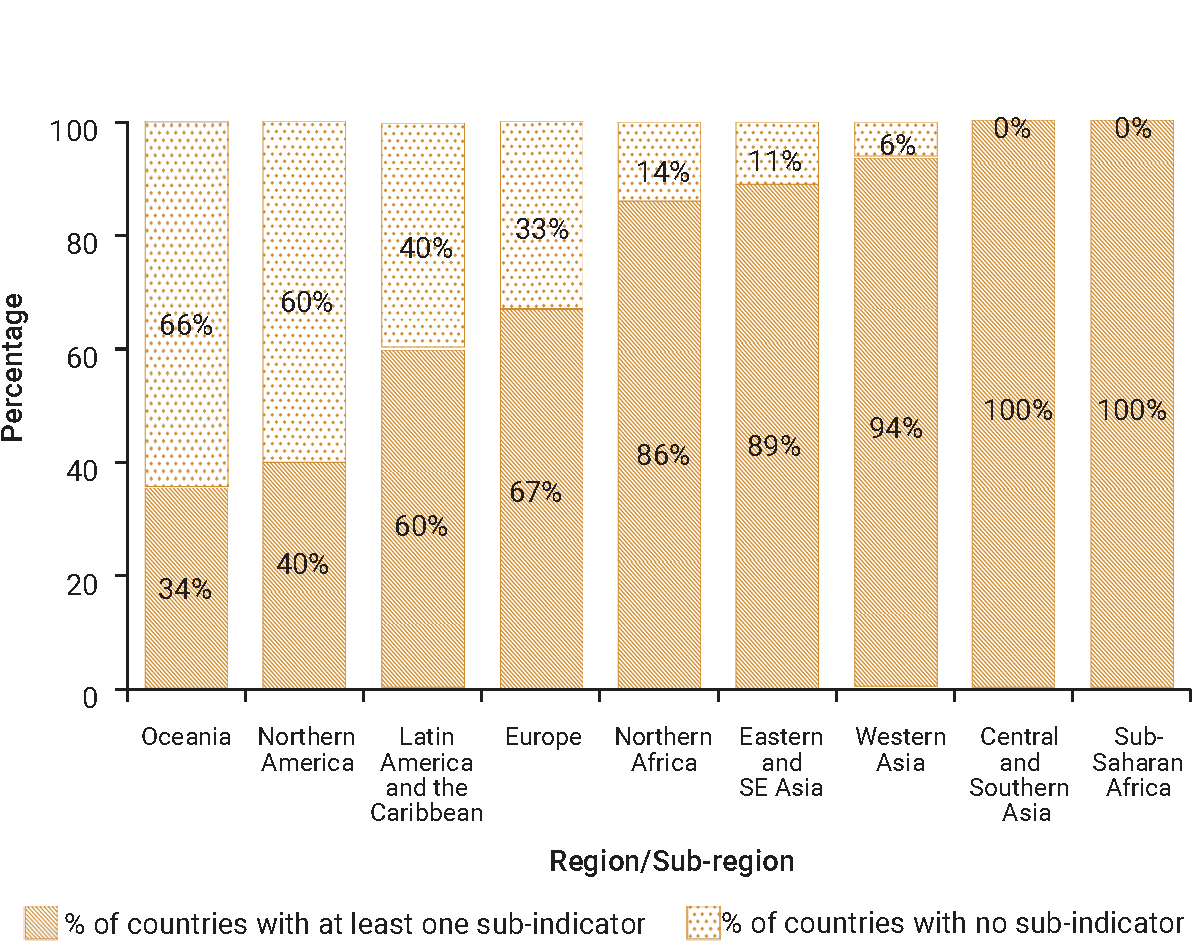
2. Data availability by region, SDG Global Database, as of 02 July 2025
3. Proposed disaggregation, links to policymaking and its impact
| Proposed disaggregation | Link to policymaking | Impact |
|---|---|---|
|
Mortality rate attributed to unsafe water, unsafe sanitation and lack of hygiene, by age (deaths per 100,000 population) (WHO 2023b):
Applies to:
|
This disaggregation provides useful indications for decision-makers on the impacts of unsafe WASH services on population health according to their age. It also helps in identifying the most appropriate remedial measures for preventing and reducing related illnesses and risks. More specifically, for children who are particularly affected. For example, supporting a national programme to extend handwashing facilities with soap and water at home (WHO 2017; WHO 2023b). |
The estimated disease burden attributable to unsafe WASH is significant. Of the four health outcomes included in the estimates, diarrheal disease and acute respiratory infections (ARIs) contribute to most of the burden. The true disease burden associated with unsafe WASH is likely to be much higher because of limited epidemiological evidence and lack of data. Not to mention the compounding impacts of climate change on WASH-related diseases, which need to be better captured. Among children under the age of five, the WASH attributable disease burden represented 7.6% of all deaths in 2019. National figures on access to WASH services often hide wide disparities within countries. Hence, access to WASH services is generally lower among rural populations, marginalized communities and women. The WASH-attributable disease burden disproportionately affects the poorest and most disadvantaged populations, who are underserved. For example, small water supply systems as well as small-scale sanitation services are more vulnerable to failures and contamination than are larger systems. The lack of safe handwashing facilities and proper sanitation services negatively impacts adolescent girls and women, who are usually responsible for child-care and domestic activities in many countries, and limits their ability to safely manage their menstrual hygiene. Evidence confirms the importance of improving access to safe WASH services in limiting the deaths and illnesses toll and achieving greater health gains. This calls for additional and continuous efforts by governments to accelerate investment in WASH systems, with a focus on the poorest and most disadvantaged and the prioritization of extending basic services to the unserved population. Likewise, proactive risk assessment and management in WASH policies, regulations and programming is essential for promoting safer WASH services (UN 2023c). Governments should also be able to adapt national and local monitoring systems to better track population exposure to contamination from unsafe WASH (UNICEF and WHO 2020; WHO and UNICEF 2021b; WHO, UNICEF and WB 2022; WHO 2023b). |
|
Mortality rate attributed to unsafe water, unsafe sanitation and lack of hygiene, by sex (deaths per 100,000 population) (WHO 2022b; WHO 2023b):
Applies to:
|
This disaggregation provides useful indications for decision-makers on the impacts of unsafe WASH services on population health according to sex. It also helps in identifying the most appropriate remedial measures for preventing and reducing related illnesses and risks. More specifically, for women who are particularly affected. For example, using improved sanitation facilities that are not shared with other households or providing schools with water and latrines, and promoting hygiene education in the classroom (WHO 2023b). | |
|
Mortality rate attributed to unsafe water, unsafe sanitation and lack of hygiene, by risk factor (deaths per 100,000 population) (WHO 2023b):
Applies to:
|
This disaggregation provides useful indications for decision-makers on the impacts of unsafe WASH services on the population according to their origin. It also helps in identifying the most appropriate remedial measures for preventing and reducing those impacts. For example, supporting a shift to safely managed services (WHO and UNICEF 2023; WHO 2023b). |
|
|
Mortality rate attributed to unsafe water, unsafe sanitation and lack of hygiene, by type of disease (deaths per 100,000 population) (WHO 2023b; WHO 2024):
Applies to:
|
This disaggregation provides useful indications for decision-makers on the impacts of unsafe WASH services on the population health according to the type of illness contracted. It also helps in identifying the most appropriate remedial measures for preventing and reducing those impacts. |