

SDG Indicator 15.4.2: (a) Mountain Green Cover Index and (b) Proportion of degraded mountain land
1. Key features and metadata
Definition: This indicator monitors progress towards the conservation of mountain ecosystems and is composed of two sub-indicators: (a) the Mountain Green Cover Index (MGCI) and (b) the Proportion of degraded mountain land. MGCI is defined as the percentage of green cover over the total surface of the mountain area. The proportion of degraded mountain land is designed to monitor the extent of degraded mountain land as a result of land cover change.
| Sub-indicator | Disaggregated by |
|---|---|
|
ER_MTN_GRNCVI Mountain Green Cover Index |
Bioclimatic belt Land cover |
|
ER_MTN_GRNCOV Mountain green cover area (square kilometres) |
|
|
ER_MTN_DGRDP Proportion of degraded mountain land (%) |
Bioclimatic belt
|
|
ER_MTN_TOTL Mountain area (square kilometres) |
|
|
ER_MTN_DGRDA Area of degraded mountain land (square kilometres) |
Sources of information: National Statistics Offices (NSOs) as well as global estimates computed by theFood and Agriculture Organization of the United Nations (FAO) using the most suitable global land cover dataset (the ESA CCI Land cover (ESA 2017) at the time of writing) when national official data does not exist or is incomplete.
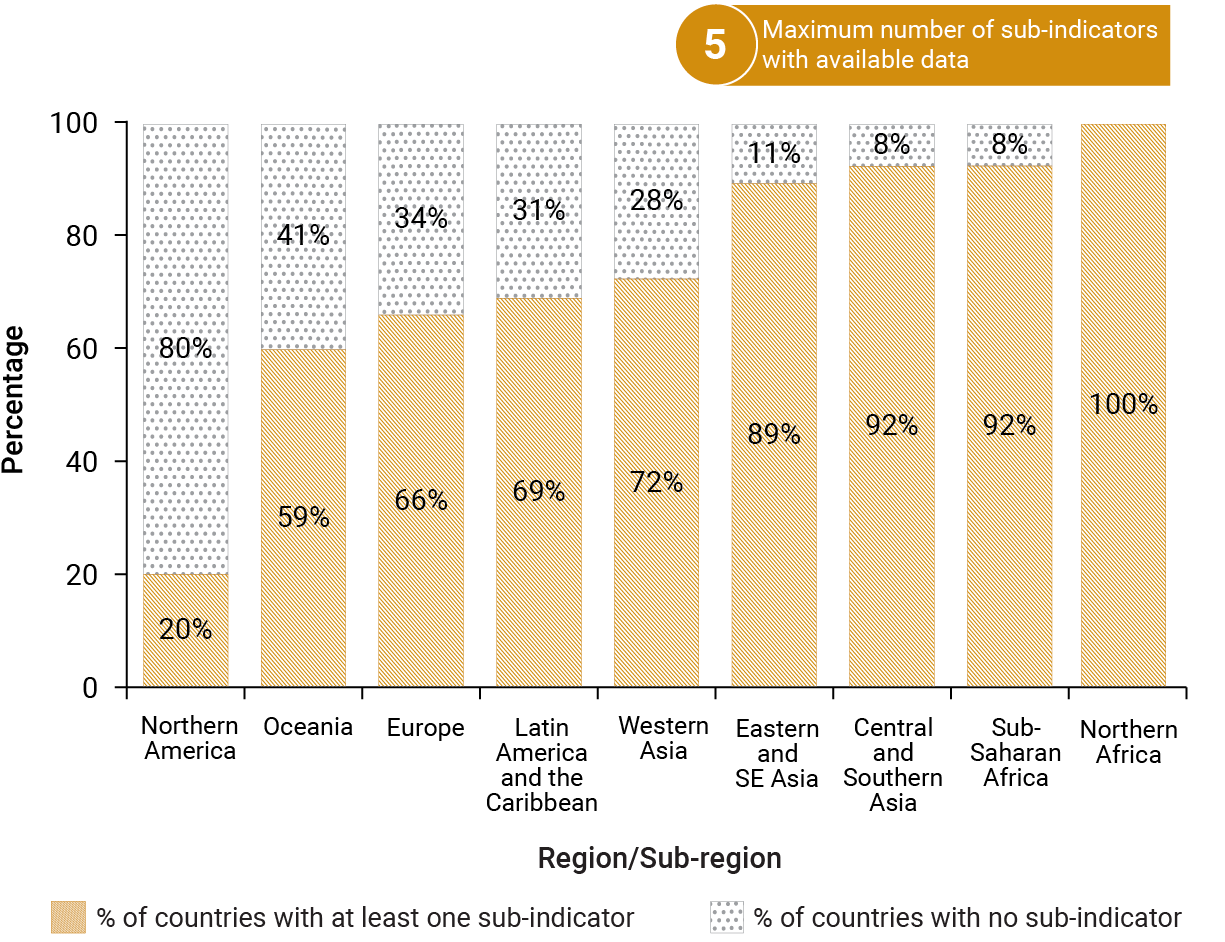
2. Data availability by region, SDG Global Database, as of 02 July 2025
3. Proposed disaggregation, links to policymaking and its impact
| Proposed disaggregation | Link to policymaking | Impact |
|---|---|---|
|
By mountain bioclimatic belts (square kilometers/%) (Körner, Paulsen and Spehn 2011):
Applies to:
|
The disaggregation for all sub-indicators by mountain bioclimatic belts provides a more detailed description of the extent of, and changes in, land cover in mountain areas by disaggregating the indicator’s values into climatically similar mountain classes (Körner, Paulsen and Spehn 2011). This facilitates better informed decision-making. For instance, increases in green cover could be considered negative in nival and alpine belts, as they may indicate glacier and permanent snow retreat processes, but positive in other mountain belts. In addition, disaggregation by bioclimatic belts allows for a more ecologically consistent global comparison given that environmental conditions in mountains vary not only with altitude but also with latitude. |
Assessing changes in land cover differentiated by bioclimatic belts is important in understanding the role that environmental factors (e.g. climate and/or altitude) play in explaining the variations of mountain green cover and the possible impact of mountain land degradation across regions. It shows in which mountain belts adverse changes in land cover are occurring. It highlights where there is the potential loss of mountain biodiversity and ecosystems goods and services on which the population depends for their livelihood. It also shows where relevant interventions are needed to reverse the trends (e.g. restoration of land or halting artificial changes) and, conversely, where successful policy actions have been implemented (FAO 2015). |
|
By SEEA Land Cover classes (square kilometers/%) (UN 2014a):
Applies to:
|
This disaggregation helps to better interpret the MGCI as it allows the measurement of changes from more natural to more anthropogenic land cover types. This makes it possible to capture land use processes within green and non-green land cover classes, such as cropland expansion, which are considered major drivers of biodiversity loss, thus increasing the indicator’s policy relevance (UN 2014a). |
This disaggregation is useful for identifying areas where changes in land cover categories (land cover transitions) may indicate a decline or loss of biodiversity, mountain ecosystem functions or services. It also highlights where there has been a recovery of vegetation that otherwise would not be captured by MGCI alone given that it does not capture changes within green cover and non-green cover classes (Körner, Paulsen and Spehn 2011; De Simone et al. 2021). |