


2.a.2 Material footprint, or raw material consumption
General information
This indicator of circular economy corresponds to the SDG 8.4.1/12.2.1 Material footprint, material footprint per capita, and material footprint per GDP.
The presented methodology for this indicator is based on the UNSD’s Metadata for 8.4.1/12.2.1, UNEP’s The use of natural resources in the economy: A Global Manual on Economy Wide Material Flow Accounting (2021),and UNEP’s Economy-Wide Material Flow Accounting Step-by-step guide to the compiler (2024). SDG target 8.4 aims to improve progressively the global resource efficiency in consumption and production and decouple economic growth from environmental degradation and SDG target 12.2 aims to achieve sustainable management and efficient use of natural resources.
Additional disaggregation
The Material Footprint (MF) indicator is disaggregated into four main categories (biomass, fossil fuels, metal ores and non-metallic minerals). More information about the definition of each category is provided in the following section entitled “Definitions”.
Indicator interpretation
Currently, supply chains are very diverse. For instance, a country’s produced material might be used outside of its national territory while in other instances, part of its national consumption might have been produced outside its national boundaries. In this sense, production and consumption are not always taking place in the same country, thus creating a disconnect between the location of production and final consumption. Various local environmental and social impacts in countries, which extract and process raw materials or manufactured products, and therefore often related to final demand in other countries. Production-oriented indicators cannot account for the totality of the actual environmental consequences induced by the consumption of certain products, as they do not include those impacts located in other geographical regions.
The indicator Material Footprint or Raw Material Consumption responds to this need to better understand these “teleconnections” between distant places of production and consumption. The material footprint indicator is calculated by transforming the weights of direct import and export flows into their respective weights of Raw Material Extraction (RME). RME refers to the supply chain-wide primary material extractions required to produce a certain imported or exported product. For example, if a country imports a certain amount of beef, the respective RMEs refer, among other aspects, to the fodder plants that were required to feed the cattle. Or if a country imports cars, the RMEs comprise all primary raw material extractions that were required to produce the car (e.g. crude iron or copper ore to produce steel or copper wires; crude oil to produce plastic parts).
The MF indicator thus corrects the national material balance for international trade, accounting for both domestic and foreign material extraction with the same system boundaries.
This indicator is proposed to monitor material use and productivity of a country in a global context which informs circular economy policymaking.
Material footprint of consumption reports the amounts of primary materials required to serve final demand of a country and can be interpreted as an indicator of the material standard of living/level of capitalization of an economy. Per-capita MF describes the average material use for final demand.
Domestic Material Consumption (DMC) and MF need to be looked at in combination, as they cover the two aspects of the economy, production and consumption. The DMC reports the actual amount of material in an economy, MF the virtual amount required across the whole supply chain to service final demand. A country can, for instance, have a very high DMC because it has a large primary production sector for export or a very low DMC because it has outsourced most of the material intensive industrial process to other countries. The material footprint corrects for both phenomena.
Using DMC, dislocating material-intensive production from the domestic territory away to other geographical regions, while keeping final demand for products and services constant, will result in better apparent performance. In contrast, using RMC, net-importers cannot improve their performance just by outsourcing. At the same time, for net-exporting countries with small domestic final demand, RMC figures will be lower compared to the results of DMC.
It is also important to note that MF do not account for unused material extraction, such as overburden from metal or coal mining or harvest residues in agriculture. However, these unused material flows cause various environmental pressures, such as water pollution and landscape changes.
Data availability
The dataset presented in the SDG database covers data for about 160 countries (either globally estimated or country data) from 2000 and onwards. The International Resource Panel’s (IRP) website presents the estimated data series between 1970-20193.
Limitations in the use of the indicator
No global reference method for calculating material footprints exists yet. Because of the global characteristics of supply chains and the differences in industry structure among countries, no national statistical office can run their own demand-based accounts reliably.
As previously mentioned, MF do not account for unused material extraction neither its environmental pressures. Finally, MF cannot be disaggregated to economic sectors which limits its use and comparison with the System of National Accounts (SNA).
Definitions
“Biomass is material of vegetable origin extracted by humans and their livestock – crops, used crop residues, fodder crops, grazed biomass, wood, capture of wild fish, and the biomass of hunted animals” (UNEP, 2024, Economy-Wide Material Flow. Step-by-step guide to the compiler).
“Fossil fuels Includes coal and peat, crude oil, natural gas and natural gas liquids, and oil shale and tar sands” (UNEP, 2024, Economy-Wide Material Flow. Step-by-step guide to the compiler).
“Material Footprint (MF) is the attribution of global material extraction to domestic final demand of a country. The total material footprint is the sum of the material footprint for biomass, fossil fuels, metal ores and non-metallic minerals” (United Nations, SDGs metadata).
“Metal ores can best be thought of as those deposits of metal compounds in the Earth’s crust which can be processed to produce desired metals at an economically viable cost. Ore deposits will generally be rock, but in certain important cases can be special soils or sand deposits. Only the portion of the excavated rock which is to be processed in some way to obtain the desired metals is included in the accounts. Data is compiled in three ore categories: iron, aluminum, and other metal ores” (UNEP, 2024, Economy-Wide Material Flow. Step-by-step guide to the compiler).
“Non-metallic minerals are defined by the System of National Accounts 1993 as stone quarries and clay and sand pits; chemical and fertilizer mineral deposits; salt deposits; deposits of quartz, gypsum, natural gem stones, asphalt and bitumen, peat and other non-metallic minerals other than coal and petroleum” (UNEP, 2024, Economy-Wide Material Flow. Step-by-step guide to the compiler).
Calculations
Three types of methods for the calculation of material footprint indicators are generally distinguished (Lutter, Giljum & Bruckner, 2016, A review and comparative assessment of existing approaches to calculate material footprints):
-
Top-down approach: input-output analysis
Top-down approaches build on input-output analysis (IOA) which focuses on the economic structure of a country in the form of matrices that depict inter-industry flows, i.e. input-output table can be interpreted as an inventory of production inputs. Environmental data on material use linked as extensions to an IO table can be considered an inventory of environmental inputs as raw materials.
In general, two main types are distinguished – single-region and MRIO models. Single-region IO models assume that imported products are produced with the same technology as domestic products. In MRIO models, country IO tables are linked together via bilateral trade data, considering different technologies applied in each country.
MRIO analysis allows product value chains and related material use to be tracked along the various life cycle stages of all products and services from material extraction to final demand, considering specific material intensities across countries.
IOA has several key advantages, in particular in its multi-regional form. The main advantage is that it allows the calculation of material footprints for all products and industries, including those with very complex global supply chains. By following a top-down approach, input-output analysis also avoids double counting. A specific material input can only be allocated once to final demand, as the supply and use chains are completely represented. As a result, the global system is always consistent, i.e. the sum of all material footprints equals the sum of global material extraction.
A major disadvantage of IOA is the limited number of commodities and regions distinguished, which is determined by the sectoral / industrial and regional disaggregation of an IO model. Further, inaccurate results are produced by the assumption of homogeneous environmental characteristics of all products within a product group. Another disadvantage is that most MRIO-based approaches utilize the monetary use structures of industries and products to allocate material extraction to final demand, assuming proportionality between monetary and physical flows, which should not be assumed, e.g. price differences between different industries may occur.
Today, various global MRIO databases exist that can be extended with data on global material extraction, to track the flow of embodied materials along international supply chains to final demand (Lutter, Giljum & Bruckner, 2016, A review and comparative assessment of existing approaches to calculate material footprints).
-
Bottom-up approach: material intensity coefficients
Botton-up approaches comprise detailed data on bilaterial trade and domestic production expressed in quantities (e.g. tonnes or units), and “apparent consumption” of a country is derived by calculating production plus imports minus exports. The quantities of each product consumed in a country are multiplied with coefficients reflecting the related upstream resource use. These coefficients, primarily obtained from Life Cycle Assessments, quantify the material required along a product’s supply chain (Wiesen & Wirges, 2017, Energy, Sustainability and Society).
The most important advantage of coefficient-based bottom-up methods in comparison to top-down approaches is the high level of detail which can be applied. The coefficient approach does not face restrictions on the definition of sectors / industries or product groups and thus allows very specific comparisons of material footprints to be performed, down to the level of single products or materials.
One key disadvantage of coefficient approaches is the high level of effort to construct solid coefficients for many processed products, so the availability of coefficients for finished products is therefore limited. Further, double counting is possible, especially in cases where products are passing more than one border along processing stages, as these products are accounted for each time they pass a border.
With regard to data availability for material coefficients, the Wuppertal Institute in Germany maintains a database for more than 200 products, with most coefficients being provided for one specific (mainly European) country or the world average (Wuppertal Institute, 2014 , https://wupperinst.org/uploads/tx_wupperinst/MIT_2014.pdf). The European Statistical Office also provides information about RME coefficients for imports and exports and has recently published the Manual and tool to facilitate this calculation to European countries (Eurostat, 2024, Handbook for estimating raw material equivalents of imports and exports of RME-based indicators on the country level-based on Eurostat’s EU RME model).
-
Hybrid approaches: complementing input-output analysis with coefficients
Hybrid approaches aim to exploit the advantages from IOA in combination with physical trade accounts and process-based coefficients. Depending on the processing stage, as well as the data quality and availability, a differentiated approach for the calculation of footprint indicators for different products is applied. Typically, material coefficients are used for raw materials and products with a low level of processing. Processed commodities and finished goods with more complex production chains are measured using IOA, which allows consideration of all indirect effects and thus all upstream material requirements.
Hybrid models are increasingly applied in all areas of resource flow accounting, acknowledging their respective strengths and capabilities. The combination of top-down and bottom-up methods is achieved in various ways. Hybrid approaches for the calculation of consumption-based materials flow indicators integrate detailed statistics in mass units into monetary input-output tables, creating mixed-unit IO tables.
Hybrid calculation models have been set up for a range of European countries (see, for example, Kovanda and Weinzettel, 2013, The importance of raw material equivalents in economy-wide material flow accounting and its policy dimension; Schaffartzik et al., 2014, Consumption-based material flow accounting). Also the European Statistical Office has developed a Hybrid calculation method to assess the material footprint of the EU-28 (Eurostat, 2024, Documentation of the EU RME model).
A. Material Footprint per raw material and total or raw material consumption
Material footprint by type of raw material (tonnes) or Raw Material consumption (RMC) is calculated as:
MF = RMC= DE + RMEIM - RMEX
- Where:
- MF: Material Footprint
- RMC: Raw Material Consumption
- DE: Domestic Extraction of Materials
- 𝑅𝑀𝐸𝐼𝑀: Raw Material equivalent of Imports
- 𝑅𝑀𝐸𝐸𝑋: Raw Material equivalents of Exports
The Material Footprint indicator is disaggregated into four main categories (biomass, fossil fuels, metal ores and non-metallic minerals).
There is one tab that can be used to calculate the material footprint. The Material Footprint tab compiles information of the four categories and calculates the material footprint for each category and the national material footprint.

B. Material Footprint per capita
Material footprint per capita, by type of raw material (tonnes), is calculated as:
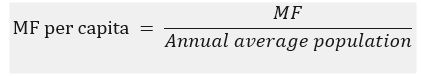
Users will insert the annual average population in the MF per capita tab, and material footprint per capita will be automatically calculated for each raw material (when data on raw material has been previously inserted) and the total MF per capita.

C. Material Footprint per GDP or raw material intensity
Material footprint per unit of GDP, by type of raw material (kilograms per constant 2015 United States dollar) or raw material intensity (RMI), is calculated as:
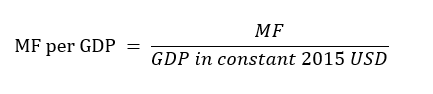
Once the users fill the MF per capita tab, entering data on GDP in constant 2015 United States Dollars Users, material footprint per GDP will be automatically calculated for each raw material (when data on raw material has been previously inserted) and the total MF per GDP.

Note: when data is inserted, some cells might turn red. When cells turn red, it is because some inserted data is not correct.
Raw material productivity
Raw material productivity (RMP), by type of raw material (Constant 2015 United States dollar per kilograms), is calculated as:
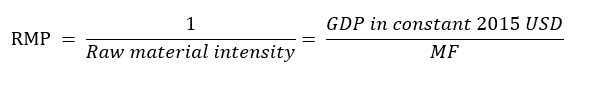
Raw material productivity by raw material and total will be automatically calculated in RMP tab, based on data already entered by users.
