

2.a.7 Hazardous waste generated by type, including e-waste
General information
This indicator of circular economy corresponds to the SDG 12.4.2 (a) Hazardous waste generated per capita.
The presented methodology for this indicator is based on UNSD’s Metadata for 12.4.2, UNEP’s Step-by-step guide: SDG Indicator 12.4.2: Hazardous Waste Generation (2023), UNEP’s Global Chemicals and Waste Indicator Review Document (2021).
SDG target 12.4 aims to achieve the environmentally sound management of chemicals and all wastes throughout their life cycle, in accordance with agreed international frameworks, and significantly reduce their release to air, water and soil to minimize their adverse impact on human health and the environment. Indicator 12.4.2 (a) Hazardous waste generated per capita entails levels II and III indicators (see Table 2. 9). Level II corresponds to national data collected from countries and level III to additional information.
| LEVEL II INDICATOR | |
| Hazardous waste generated (in tonnes, per km sq. of land area and per capita) | Hazardous waste collected + hazardous waste given by generator to treatment or disposal facilities + estimation of unaccounted for hazardous waste |
| Hazardous waste generated by type, including e-waste | A breakdown of hazardous waste generated by key type of waste, including e-waste |
| Hazardous waste intensity of production | Hazardous waste collected + hazardous waste given by generator to treatment or disposal facilities + estimation of unaccounted for hazardous waste |
| LEVEL III INDICATORS | |
| Hazardous waste intensity of production | Quantity of hazardous waste generated during the reporting year / DMC in the reporting year |
Additional disaggregation
Indicators described above can be further disaggregated depending on the country’s policy information needs. For instance:
- Disaggregation at sector level by ISIC codes. Information on the generation of hazardous waste could be collected from industry or municipal level.
- Disaggregation by territorial division. Information on the hazardous waste generated can significantly vary throughout the territory of a country as there might be hotspots of hazardous waste generation, concentrated around industry intensive areas.
Indicator interpretation
Chemicals are part of everyday life. There are over 140,000 different substances used in all economic sectors globally. Their benefits are many and so too are their potential to adversely impact human health and the environment if not properly managed.
Nowadays, there is a rapid increase in the generation of hazardous waste. Where most of the conventional hazardous wastes are produced in industrial and manufacturing operations, significant amounts are generated in non-industrial sectors, including sludge from the healthcare sector; waste-water treatment plants, waste oils, and waste batteries. There is also an increase in the complexity of products and unidentified hazardous components like coatings. As such, action is needed to support the sustainable use of chemicals and minimize their generation.
Data availability
Hazardous generation is highly dependent on national factors, so indicators should be calculated based on country data. In case of lack of robust country data based on measurements, gap fillers should be used (such as sector-based estimations of quantities based on industry standards, data extrapolation, use of values from internationally accepted publications or databases, etc.). Whenever using gap fillers, the employed method for calculating/estimating should be indicated. It is important to note that there is no possibility to report data on hazardous waste using only gap fillers, as hazardous waste generation is extremely country-specific and depends on several factors, such as the type of economic activities performed in the country, level of industry development, and others. There are no known international benchmarks for general hazardous waste generation rate. Therefore, the employed method for indicators calculation/estimation should always strive towards using country specific data.
At the global level, UNSD collects data from all countries (except those covered by the OECD/Eurostat Joint Questionnaire on Environment Statistics) through the UNSD/UNEP Questionnaire on Environment Statistics (waste section). UNSD carries out extensive data validation procedures that include built-in automated procedures, manual checks and cross-references to national sources of data. Communication is carried out with countries for clarification and validation of data. Only data that are considered accurate or those confirmed by countries during the validation process are included in UNSD’s environment statistics database and disseminated on UNSD’s website12. Data on hazardous waste generated per capita and e-waste generated are disseminated on UNSD’s website.
On a national level, data and information regarding hazardous waste can be derived from hazardous waste generators and local/regional and national environmental protection agencies. Depending on national obligations for record keeping and reporting, the extent of the data available might vary at country level as well as at sector level.
Data on the generation of hazardous waste should ultimately be reported by generators to environmental authorities. The actual form and frequency of which depends on legal requirements and the maturity and/or complexity of the environmental regulation system within the country, which can differ significantly across the world.
At a minimum, information on possible generators of hazardous waste can be derived from environmental authorities based on the environmental permits issued for industrial activities. Industrial activities are likely to fall under environmental permitting requirements, as they are likely to generate hazardous waste. In case reporting on hazardous waste generation is not a legal requirement, industry specific hazardous waste generation rates could be applied as a gap filler to production data, to estimate the quantity of hazardous waste generated by the specific industry.
Data collection on hazardous waste generation is usually done by the competent authorities designated under the Basel Convention (submission of annual reports in fulfilment of the Convention’s obligations) or by national statistics offices in terms of data aggregation, as an overarching organism which links to national/regional authorities, be it environmental agencies, environmental ministry, commerce and trade authorities, etc.
Hazardous waste generation statistics involve a large number of national and sub-national stakeholders which may create discrepancies. To address these possible discrepancies, inter-institutional stakeholder collaboration is always encouraged.
Information on exported hazardous waste is generally available through the customs office. As compelled by the Basel Convention, this type of information is generated through the designated authorities, as they are responsible for receiving notifications of transboundary movements and any related information and for responding to such notifications.
Limitations in the use of the indicator
Data on hazardous waste generation may be scarce in some countries, due to a series of factors, such as: lack of, or insufficient, policies and regulations on reporting; limited human, financial and technical resources within government agencies, lack of clear disclosure and reporting rules and requirements, and unwillingness of generators and public officials in certain countries to disclose the quantities of hazardous waste generated. Some countries may have the data and monitoring systems needed to report, while for others there is a need for training and capacity development to enhance data collection, validation and reporting capacity.
A general challenge in hazardous waste statistics is the sensitive public opinion on the hazardous properties of chemicals and hazardous waste. These concerns may disincentivize private operators from disclosing data on their hazardous waste generation unless compelled to do so by a robust environmental regulator with proven legislative and institutional backing, which in many countries is lacking.
Another challenge is linking data on the use of chemicals and the generation of hazardous waste. Efforts are underway at the EU to correlate the classification and labelling of chemical substances with hazardous waste codes, but it is an ongoing process, and the EU Waste Framework Directive has not yet been revised to include this correlation 13,14.
The Basel Convention gives the choice to link hazardous waste either to the sector generating the waste or based on waste constituents (Annex I). By correlating specific waste to its constituent chemicals, there can be a clear connection made between the production data and its resulting waste.
However, other challenges might also be considered, such as the numerous transformations chemicals may be subjected to through their use cycle, which may change their classification to hazardous or non-hazardous, time lag from chemical production to it becoming waste, as well as the mixture of chemicals in hazardous waste generated by a single sector.
Limitations in terms of usable data for calculating the indicator(s) may arise due to misunderstanding of the terminology used in the indicator or discrepancies between these definitions and the definitions included in national legislation. This can lead to inconsistencies in reported values and difficulties in cross-checking reported data. For example, through national legislation, countries may define additional types of waste to be considered hazardous beyond the waste streams defined in the Basel Convention. By having inconsistent grouping of types of waste, creating comparable data between states becomes incredibly challenging.
As reporting data on the generation of hazardous and other waste is becoming optional under Basel Convention with the new reporting format adopted by the COP in 2013 for the year 2016, having accurate data on generated hazardous waste may become a challenge.
While hazardous waste generation per capita might be misleading when all sources of hazardous waste are taken into consideration, for some sectors of the economy it can be a suitable indicator of the level of development of the country and its waste management practices. This can be the case, for example, for the hazardous fraction of municipal solid waste, as well as for hazardous waste resulting from healthcare facilities.
Hazardous waste which is unaccounted for as well as hazardous waste which results from treatment of waste considered otherwise non-hazardous (for example hazardous waste resulting from the treatment of municipal solid waste, or through contamination of non-hazardous waste after it enters the waste treatment cycle) is likely to introduce inconsistencies in reported figures.
Inconsistencies in reporting figures may also arise from the way data is reported and then aggregated. In some cases, hazardous waste is reported by volume, with no indication of density. As a result, estimations and assumptions must be made to convert the units. These estimations and assumptions must consider a series of factors which can affect the actual weight of waste, such as moisture content variation with season, degree of pre-processing (crushing/compacting), etc.
Statistical data on imports and exports and production statistics use different classification (for international trade statistics Combined Nomenclature (CN) codes are subject to annual changes, but the Harmonized System (HS Nomenclature) is renewed every five years). Statistical code systems for material flows (CN codes, CPA) and for waste (EWC-Stat codes) are not always comparable. For improved information on the relationship between the inflow of materials and the materials reaching waste management, the method needs to be improved. When semi-manufactured and finished products are to be aggregated into material flow categories, a definition of the materials incorporated has to be provided. To what extent can this information be taken from the CN codes is not always clear.
Definitions
“E-waste or electronic waste refers to all items of electrical and electronic equipment (EEE) and its parts that have been discarded by its owner as waste without the intent of re-use” (United Nations, SDGs metadata).
“Domestic Material Consumption (DMC) is a standard material flow accounting (MFA) indicator and reports the apparent consumption of materials in a national economy. DMC measures the total amount of material (biomass, fossil fuels, metal ores and non-metallic minerals) directly used in an economy and based on accounts of direct material flows, i.e., domestic material extraction and physical imports and exports” (United Nations, SDGs metadata).
“Hazardous waste is waste with properties capable of having a harmful effect on human health or the environment and is regulated and controlled by law. Hazardous waste may come in many forms, including liquids, solids, gases and sludge” (United Nations, SDGs metadata). Waste listed in Annex VIII of the Basel Convention is presumed to be hazardous, while waste listed in Annex IX is presumed not to be hazardous. For the purpose of this indicator, due to comparability reasons, additional waste considered hazardous as per national definitions, as provided by the Basel Convention under Article 1, paragraph 1(b), are excluded.
“Hazardous waste generated refers to the quantity of hazardous waste generated within the country during the reported year, prior to any activity such as collection, preparation for reuse, treatment, recovery, including recycling, or export, no matter the destination of this waste. Hazardous waste is generated from many sources, ranging from industrial manufacturing process waste to domestic items such as batteries” (United Nations, SDGs metadata).
“Hazardous waste generated by type, including e-waste is a breakdown of hazardous waste generated by key type of waste, including e-waste” (United Nations, SDGs metadata).
“Municipal waste or municipal solid waste (MSW) includes waste originating from households, commerce and trade, small businesses, office buildings and institutions (schools, hospitals, government buildings). It also includes bulky waste (e.g., old furniture, mattresses) and waste from selected municipal services, e.g. waste from parks and gardens maintenance, waste from street cleaning services (street sweepings, litter containers content, market cleansing waste), if managed as waste” (United Nations, SDGs metadata).
Calculations
Level II – Hazardous waste generated
The Hazardous Waste Generated is the quantity of hazardous waste generated within the country during the reported year, prior to any activity such as collection, preparation for reuse, treatment, recovery, including recycling, or export, no matter the destination of this waste.
For the purpose of this indicator, hazardous waste generated should include collected hazardous waste (either by specialized companies or by municipal services), hazardous waste which is given by the generator directly to the treatment or disposal facility, as well as an estimation of the hazardous waste which is unaccounted for. Generated hazardous waste includes exported hazardous waste and excludes imports of hazardous waste.
Total waste generated is presented in tonnes and as rates per km sq. of land area and per capita.
The hazardous waste generated would be calculated as follows:
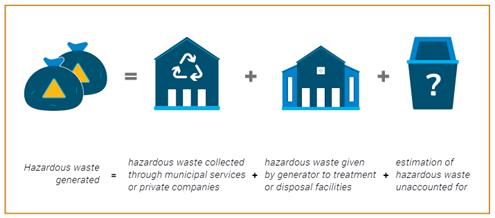
Hazardous waste generated = hazardous waste collected through municipal services or private companies + hazardous waste given by generator to treatment or disposal facilities + estimation ofunaccounted for hazardous waste
Parties to the Basel Convention must provide information on the final disposal and recovery options operated within their national jurisdiction (see the Basel Convention Dashboard Tables 2 and 3), and they have the possibility to report information on the total amount of hazardous wastes and other wastes generated. See Table 6 in the Dashboard or the Country files from the UNSD/UNEP data collection on environment statistics (Table R2) for previously reported data on waste (Figure 2. 41). These include data on hazardous waste that have been submitted previously. Check with the submitting unit for any updated information.

If no data have been reported to the Basel Convention or UNSD, the national authority responsible for industry or the environment may have such information. It may also be that a national waste inventory does not exist. In that case, one will need to be developed. This would assist Parties in better managing their waste and meet their obligations under the Basel Convention.
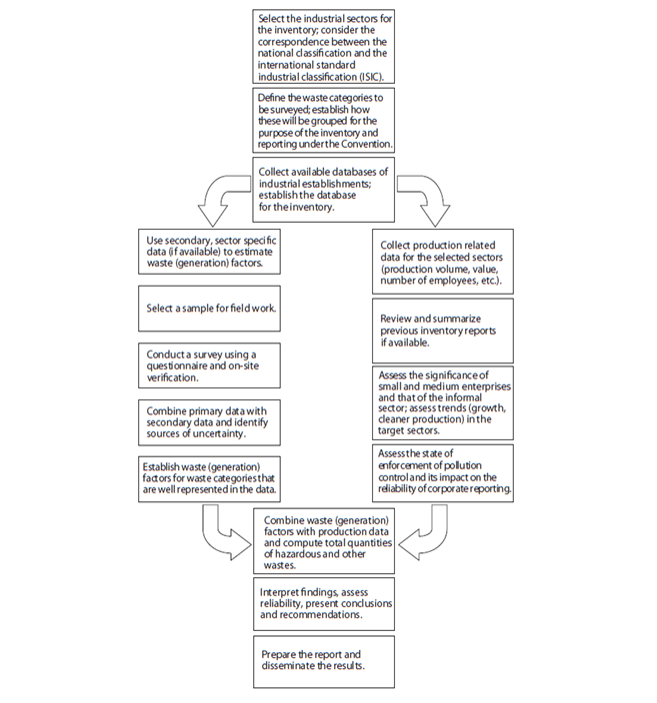
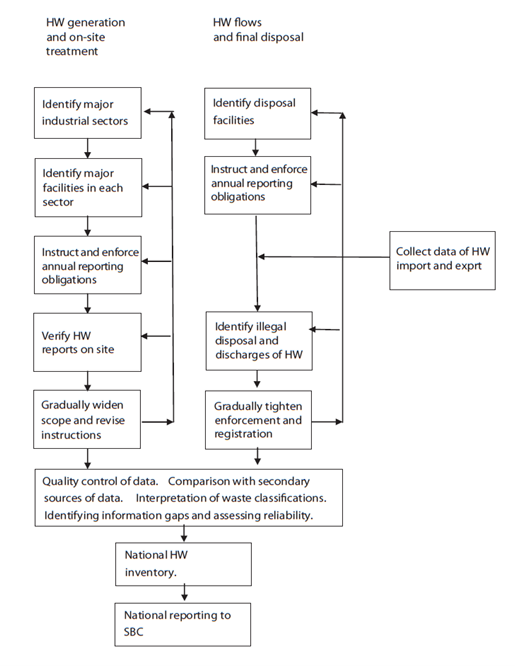
The Methodological guide for the development of inventories of hazardous wastes and other wastes under the Basel Convention, 2016, outlines a two stage-process to build a hazardous waste inventory (see Figure 2. 42 and Figure 2. 43). The generators and managers of waste are in the best position to provide the necessary data that can then be compiled to obtain a national overview. Refer to the Methodological guide for more details.
If data have not been submitted previously, it may be possible to make estimates using per capita generation rates (see Annex III). The most recently reported hazardous waste generation rates come from the World Bank (2018) publication What a waste 2.0 A Global Snapshot of Solid Waste Management to 2050. These are used as global waste generation rates as data was insufficient and the situation across regions and income levels is heterogeneous, which did not allow a more specific breakdown. Nevertheless, these can be used as a start for establishing specific gap-fillers for a country. The industrial waste generation rates per income level are presented as an aid for thinking about adjusting hazardous waste generation based on the income level in the country.
In addition, the World Bank “What a Waste Global Database” includes data on hazardous waste for selected countries. A country with similar income level and macro-economic profile from the same region could be chosen from the database for establishing a proxy that may be comparable to the situation of the country. The generic global generation rate should be adjusted to better fit the specificities of the country.
The estimation of hazardous waste unaccounted for is the most difficult aspect of this methodology as it requires local-level knowledge and estimation. This aspect of the indicator is particularly important as hazardous waste that is unaccounted for is typically also untreated and has a high potential to impact the environment.
|
Estimation of unaccounted hazardous waste Hazardous waste which is unaccounted for may come from, inter alia, households, small businesses and farms. Due to the small quantities of hazardous waste generated per entity, and a lack of or difficulty to access hazardous waste collection services, weak or weakly enforced environmental protection regulations, hazardous waste may be mixed with municipal waste and/ or disposed of in an uncontrolled manner (e.g. illegal dumping, open burning). In the case of some lower-income countries, due to insufficient environmental protection regulations or monitoring of implementation, hazardous waste dumping or open burning instead of treatment can occur even in the case of producers of significant quantities, further increasing the amount of hazardous waste which is unaccounted for. A significant amount of unaccounted hazardous waste may also be diverted into the informal sector, prior or after it enters the collection system. Although there is no agreed methodology on the estimation of unaccounted hazardous waste, countries should employ the often-used methodology of following the mass balance principle, using the Material Flow Analysis (MFA). Input-output analysis is increasingly applied to estimate and represent material flows, MFA is a general system approach that can be used to explore various interfaces between flows and stocks. For a comprehensive picture of the material flows, it is vital to have data on the accumulation and stock of materials in the economy. There is a direct relationship between the use of certain products and the amount of hazardous waste that is created as a result of their production (e.g. fluorescent lamps, batteries, e-waste, etc.). Looking at production processes, sampling different industry sectors to determine the hazardous waste generation rate over the amount of input materials and then using the ratio to estimate the total across all industry sectors is one of the methods that can be employed for estimating the country specific hazardous waste generation. Significant information and guidance on various methods of data collection, including surveys and sampling, as well as their shortcomings, are available in the Eurostat Manual on waste statistics, Chapter 3 (see European Commission (2013), Eurostat Manual on Waste Statistics). |
Once hazardous waste generation data is available or estimated, users should enter data on hazardous waste generated in tonnes for each year in the hazardous waste generated tab (Figure 2. 44). If applicable, on the cell to the right, enter the reference to any explanatory note and enter the note at the bottom of the table.
The tab also calculates automatically the hazardous waste generation per capita and Km2, once users enter data on population and country’s surface area.

Note: when data is inserted, some cells might turn red. When cells turn red, it is because some inserted data is not correct.
Level II - Hazardous waste generated by type, including e-waste
Hazardous waste generated by type, including e-waste is a breakdown of hazardous waste generated by key type of waste, including e-waste.
Countries are encouraged to provide data on the most important national waste streams. Annex I to the Basel Convention identifies the following waste streams:
| Y1 | Clinical wastes from medical care in hospitals, medical centres and clinics |
| Y2 | Wastes from the production and preparation of pharmaceutical products |
| Y3 | Waste pharmaceuticals, drugs and medicines |
| Y4 | Wastes from the production. formulation and use of biocides and phytopharmaceuticals |
| Y5 | Wastes from the manufacture, formulation and use of wood preserving chemicals |
| Y6 | Wastes from the production, formulation and use of organic solvent |
| Y7 | Wastes from heat treatment and tempering operations containing cyanides |
| Y8 | Waste mineral oils unfit for their originally intended use |
| Y9 | Waste oils/water, hydrocarbons/water mixtures, emulsions |
| Y10 | Waste substances containing or contaminated with PCBs, PCTs, and/or PBBs |
| Y11 | Waste tarry residues from refining, distillation and any pyrolytic treatment |
| Y12 | Wastes from production, formulation and use of inks, dyes, pigments, paints, lacquers, varnish |
| Y13 | Wastes from production formulation and use of resins, latex, plasticizers, glues/adhesives |
| Y14 | Waste chemical substances arising from research and development or teaching activities which are not identified and/or are new and whose effects on man and/or the environment are not known |
| Y15 | Wastes of an explosive nature not subject to other legislation |
| Y16 | Wastes from production, formulation and use of photographic chemicals and processing materials |
| Y17 | Wastes resulting from surface treatment of metals and plastics |
| Y18 | Residues arising from industrial waste disposal operations |
| Y46 | Wastes collected from households |
| E-W | E-waste |
| NEC | Wastes not elsewhere classified |
The waste categories applicable for EU countries is available in the Annex IV (Commission Regulation EU Nº 849/2010).
The hazardous waste by type tab can be used to compile this indicator (Figure 2. 45). Note that there is a separate tab for reporting e-waste.
The compiler includes a row for wastes not elsewhere classified where the amount of hazardous wastes generated that do not all into the categories specified above can be added.
Note that data on waste are also used for the indicator SDG 12.5.1 National Recycling rate, so care should be taken to ensure consistency in the data use for these indicators.
Waste streams can also be grouped according to ISIC industrial sectors as found in the UNSD/UNEP questionnaire (Figure 2. 45):
- Agriculture, forestry and fishing (International Standard Classification ISIC codes 01-03)
- Mining and quarrying (ISIC 05-09)
- Manufacturing (ISIC 10-33)
- Electricity, gas, steam and air conditioning supply (ISIC 35)
- Construction (ISIC 41-43)
- Other economic activities excluding ISIC 38, and
- Households

In terms of estimating hazardous waste generation by type of waste from households, small businesses, offices and institutions, direct sampling of waste generation is one of the methods which can be employed.
|
Estimation of hazardous waste by type for households For household target group, estimating hazardous waste produced by type of waste requires to determine characterization of a consumption system, which should include the following: products consumed, frequency of consumption, levels of consumption, consumption patterns (social context closely linked to household location and income class), consumption preferences (highlight production and marketing opportunities). Different consumption patterns of households of various socio-economic status are needed for sampling to be able to create a representative average. Additionally, consumption patterns typically change across seasons, therefore it is also necessary to sample waste generation amount across the year. It is more challenging to estimate the hazardous fraction in the total waste generation from households using the previously-mentioned methodology (i.e. sampling from households) because the pattern of the generation of household hazardous waste is much more irregular than in the case of industry. Some hazardous waste is generated infrequently, such as paint, lamps and electric and electronic waste, other waste such as household appliances have a long useful life which mean they take many years until they are no longer productive and become waste. As a result, other methods of estimation for hazardous fraction in household waste can result in more accurate figures than sampling. Statistical data on imports and exports, combined with data on local production allows estimates to be made on the sale of certain products and an estimation of the waste generated, after its use or lifespan. This can be performed following the steps below:
|
These data collection exercises can be laborious, but once a generation pattern is established, the rate can be used to estimate waste generation for future years, or until there is a dramatic change in consumption behaviours and/or production processes of any product or sector. It is recommended that a designated research institution is tasked with this work in a country to gradually obtain data on waste generation pattern using the previously mentioned methods.
Specific methodologies for developing inventories on different types of hazardous waste are included in The Methodological guide for the development of inventories of hazardous waste and other waste under the Basel Convention (UNEP, Basel Convention, Methodological Guide for the Development of Inventories of Hazardous Wastes and Other Wastes under the Basel Convention). The document aims to provide guidance to the Basel Convention compliant authorities and other stakeholders on the methods of developing national inventories for the development of annual reports.
Hazardous waste generation rates for selected waste streams and waste types, selected from the Guidance document mentioned above, are provided in Table 2. 10 below. In case of lack of more accurate country specific data sources based on measurements or calculations/estimations based on the above-mentioned methodologies, values such as the ones below and/or values from international databases can be used as gap fillers, until more accurate data is produced.
| Number | Hazardous waste stream/type | Waste generation rate | Comments |
|---|---|---|---|
| 1 | E-waste generated15 |
20 Kg/capita/year out of which:
|
Data valid for EU countries, year 201616 |
| 1 | E-waste generated from households17 |
15 Kg/capita/year out of which:
|
Data valid for EU countries, year 2009 |
| 1 | E-waste generation rate |
|
What a waste 2.0, generation rates per income level |
| 2 | Waste engine oils |
Data in liters/year/vehicle
|
Inventory from Turkey, year 2006 |
| 3 | Hazardous household waste | 3-5 Kg/capita/year | Usually estimated based on the quantities of waste collected at designated collection points. |
| 4 | Healthcare waste |
10-25% of generated healthcare waste is hazardous. High income countries18: Total waste generated 0.9-10.7 Kg/occupied bed/day. Out of which infectious waste 0.038-2.79 Kg/occupied bed/day |
Estimation of World Health Organization Depends on type of healthcare facility WHO reference includes additional estimates for low-income countries. |
Use the e-waste management tab to enter data on e-waste. E-waste includes waste in the following categories:
- Large equipment
- Screens, monitors, and equipment containing screens
- Temperature exchange equipment (cooling and freezing equipment) and Small E-waste:
- lamps
- small equipment
- small IT and telecommunication equipment
The average weight of electric and electronic equipment for EU-28 is available in Annex V.
| The E-waste calculation tool19 made available by the European Commission, calculates the quantity of E-waste generated in each EU Member State based on the quantity of electrical and electronic equipment (EEE) placed on the market. The average lifespan of each type of EEE is taken into consideration in the calculation of E-waste quantities. This tool is based on an elaborate research study that was established for 54 homogeneous electric or electronic equipment product types and linking the over 600 products to these keys. The keys were developed by the United Nations University (UNU) and are called UNU keys20. The EU commissioned a study to establish typical life-span of e-waste and collection rates across the EU building on the 54 UNU key categories21. The two studies together generated sufficient information to develop the e-waste estimation tool. In practice, there are 28 e-waste calculation tools, which are developed on the basis of the same methodology but are filled in with the data of each Member State. This tool comes with a user manual22 and can be used to generate better estimated E-waste quantities based on quantities put on the market, life span estimations based on the UNU key categories and estimations regarding collection rates. |
Users will insert data in the e-waste generated and e-waste collected categories of the e-waste generated and e-waste collected tabs (Figure 2. 46).
Note that data on e-waste are also used for SDG indicator 12.5.1. Care should be taken to ensure consistency in the data used for these indicators.

Note: When data are inserted in the Excel file tabs, some cells might turn red. This is to alert users to possible inconsistencies or errors that need to be verified. For instance, if e-waste collected is larger than e-waste generated, the cells will turn red to alert users to double check the data.
Level III – Hazardous waste intensity of production
Information on hazardous waste generation can be used for the characterization of countries’ clean production practices, when linking it with the Domestic Material Consumption (DMC), as an increase in the generation of waste is one of the environmental implications related to increased material consumption23.
Thus, countries which have lower quantities of hazardous waste generated but the same amounts of resources in consumption will have a lower hazardous intensity of production and hence rank higher according to this indicator. However, this indicator has its limitations; as often there is a significant gap in time between the use of materials in production and the moment the materials become waste. The hazardous intensity of production indicator would be calculated as shown in Figure 2. 47.
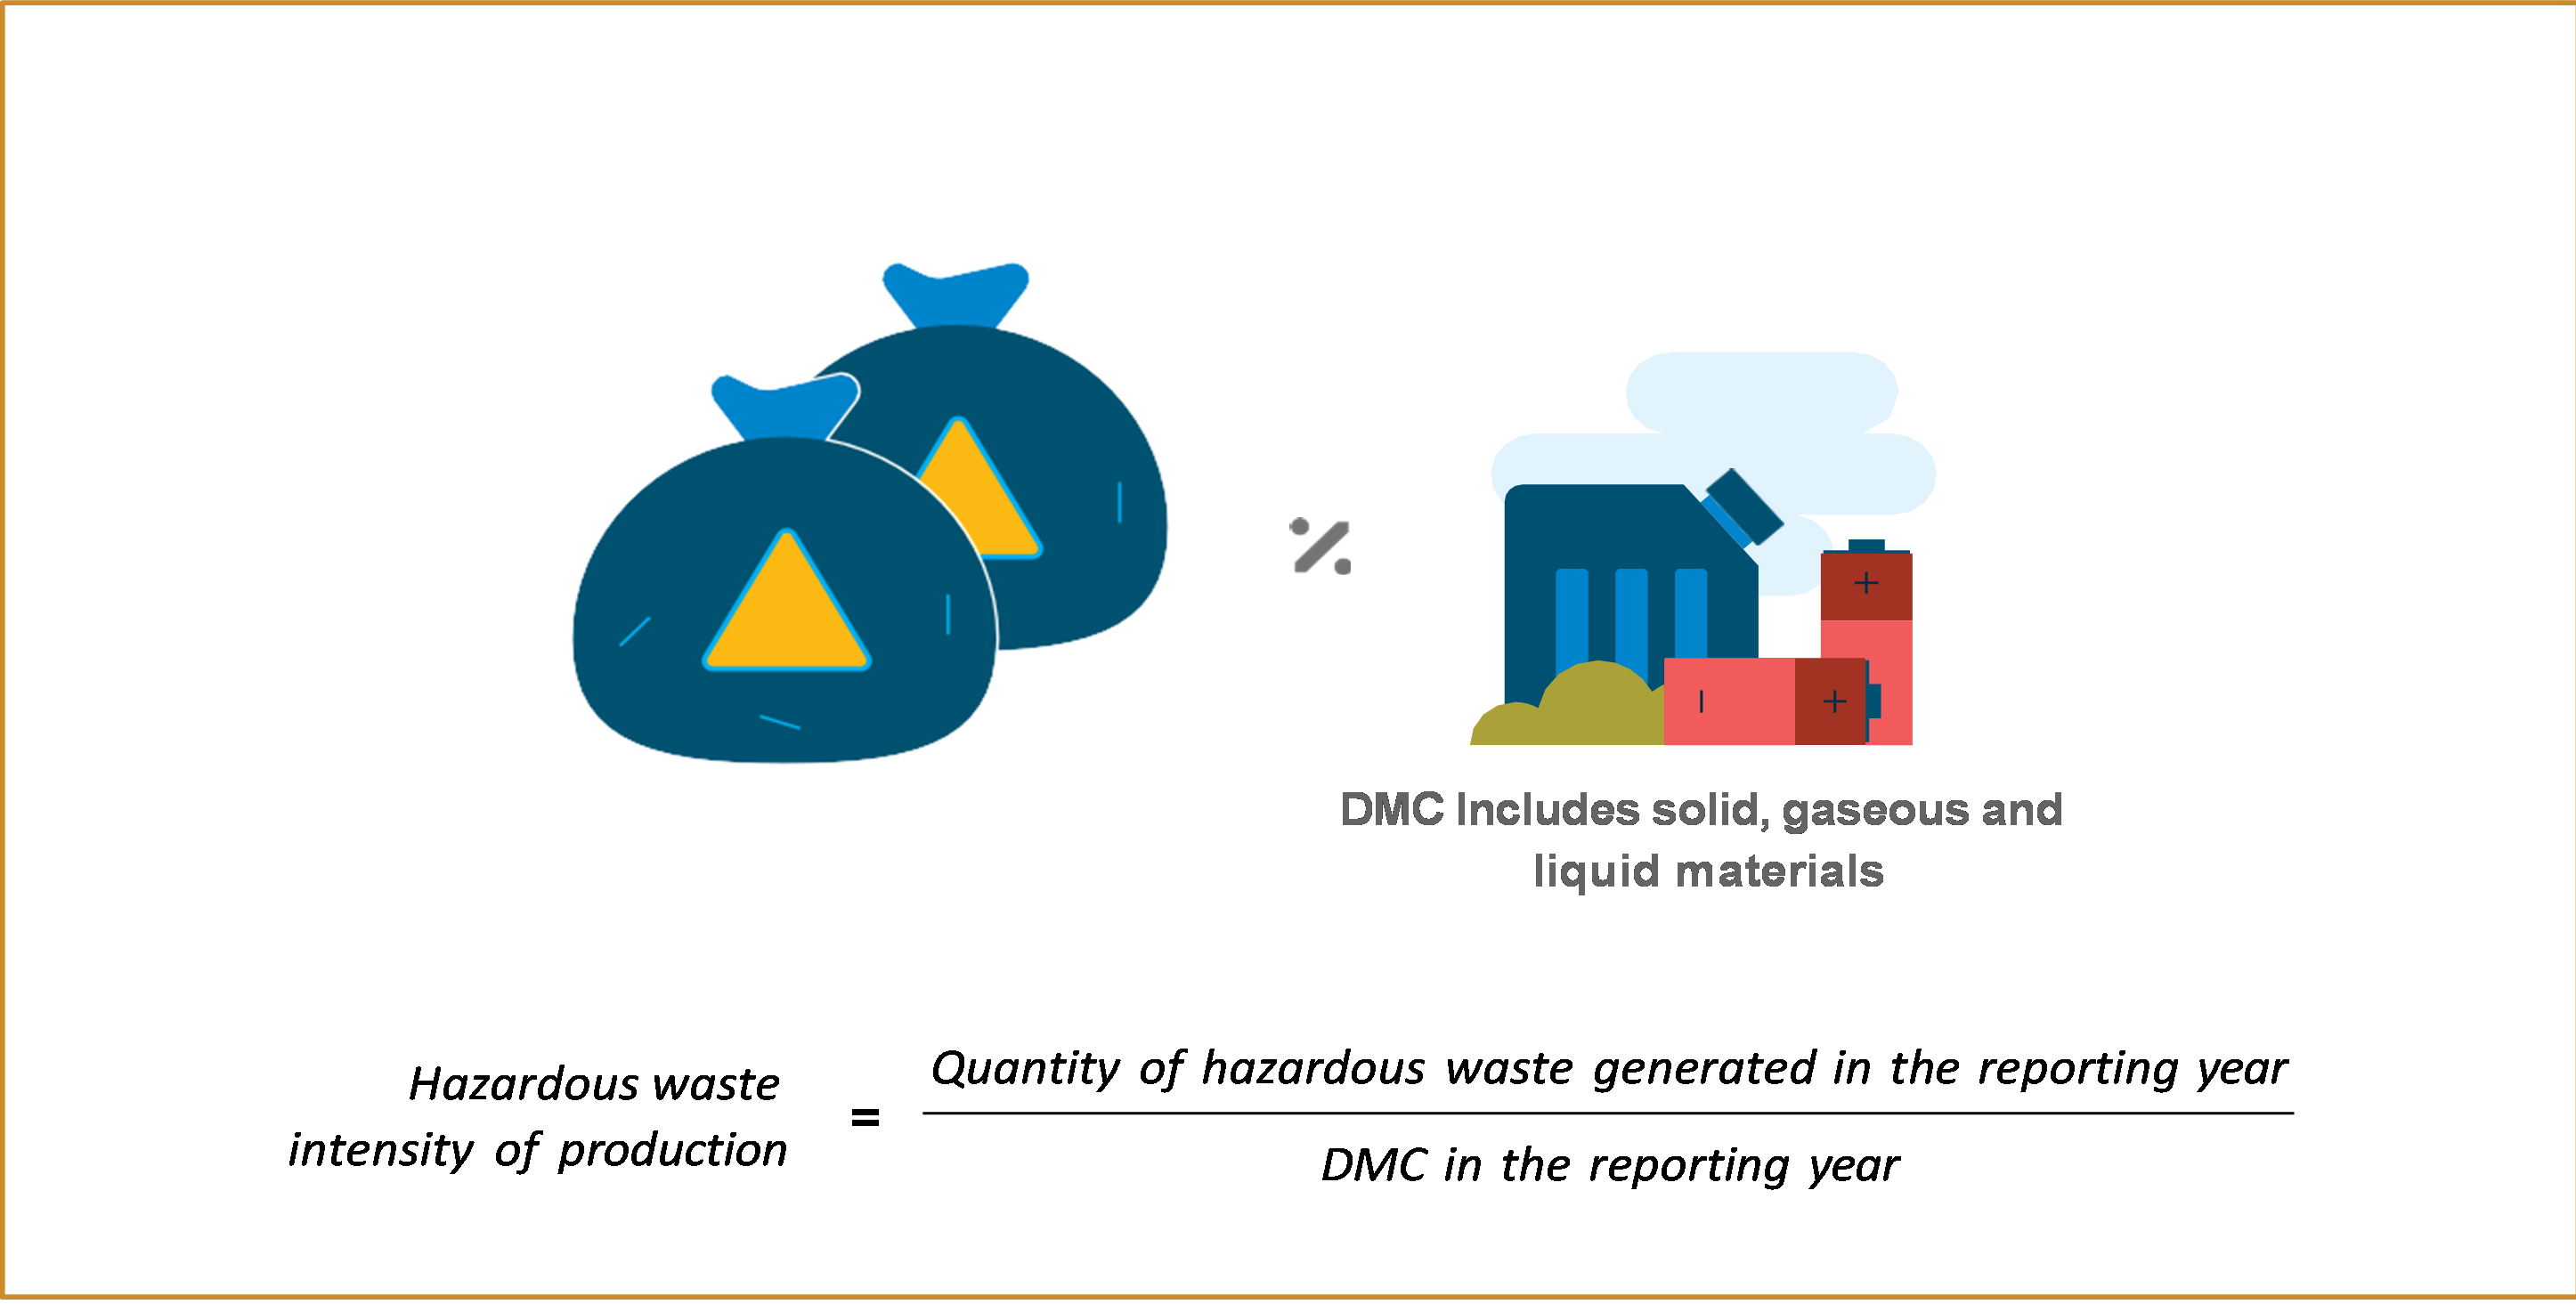
The DMC is obtained from economy-wide material flow accounts (EW-MFA). You can use the UNEP compiler to develop MFA. Enter the DMC value into the worksheet to calculate the hazardous waste intensity of production (Figure 2. 48).

Note: When data are inserted in the Excel file tabs, some cells might turn red. This is to alert users to possible inconsistencies or errors that need to be verified.
13 Waste Framework Directive and European List of Waste, information available at http://ec.europa.eu/environment/waste/framework/list.htm (accessed December 2024)
14 Review of the European List of Waste, Final Report by Ökopol GmbH, November 2008, available at http://ec.europa.eu/environment/waste/pdf/low_review_oekopol.pdf (accessed December 2024)
15 Although e-waste can be either hazardous or non-hazardous, depending on the content of hazardous substances within the specific EEE, based on the precautionary principle we decided to include e-waste in the 12.4.2 indicator on hazardous waste. In the case of reliable data on separately collected/treated/disposed of e-waste without hazardous substances content, these quantities can be excepted from the calculation of the indicator.
16 Baldé, C.P., Forti V., Gray V., Kuehr, R., Stegmann, P.: The Global E-waste Monitor – 2017, United Nations University (UNU). International Telecommunication Union (ITU) & International Solid Waste Association (ISWA), Bonn/Geneva/Vienna.
18 WHO, Safe management of wastes from health-care activities, 2nd edition, 2014, Available online at http://apps.who.int/iris/
19 E-waste calculation tool, available online http://ec-europa.eu/environment/waste/weee/data_en.htm
20 Baldé, C.P. et al., The global e-waste monitor 2017. Quantities Flows and Resources. United Nations University.
21 Magalini, F. Study on collection rates on Waste Electrical and Electronic Equipment (WEEE), European Commission, 2015.
22 Manual for the use of the WEEE calculation tool. European Commission 2017. Available online http://ec.europa.eu/environment/waste/weee/pdf/WEEE%20calculation%20too…
23 Stefan Giljum, Monika Dittrich, Mirko Lieber and Stephan Lutter, Global Patterns of Material Flows and their Socio-Economic and Environmental Implications: A MFA Study on All Countries World-Wide form 1980 to 2009, Resources 2014, 3, 319-339; doi:10.3390/resources3010319