

2.a.4 Food loss index
General information
This indicator of circular economy corresponds to the SDG 12.3.1 (a) Food loss index. The presented methodology for this indicator is based on the UNSD’s Metadata for 12.3.1a and the Food Loss+Waste Protocol (2016) Food Loss and Waste Accounting and Reporting Standard.
SDG target 12.3 aims to halve per capita global food waste at the retail and consumer levels and reduce food losses along production and supply chains, including post-harvest losses. Indicator 12.3.1 comprises two sub-indicators: 12.3.1a Food loss index and 12.3.1b Food waste index. The two sub-indicators cover discrete food value chain stages, but some overlap is possible at the interface of the manufacturing and retail stages (see Figure 2.14). Indicator 12.3.1a Food loss index has two sub-indicators, (a) Food loss index and (b) Food loss percentage.

Additional disaggregation
Countries will likely gain the most value from the disaggregated Food Loss Percentage at the sub-national level by geographic area or agro-ecological zone, points of the value chain (farm, transport, markets, processers), and economic sectors (small-holders or traditional sector versus large and commercial farms/firms).
Indicator interpretation
A significant share of food grown for human consumption is never eaten. This inefficiency has significant economic, social and environmental impacts and is related to food insecurity.
The Food Loss Index monitors progress on the supply side of food chains, as it measures if the share of agriculture production that does not reach the retail stage has increased or decreased with respect to the base period and by how much. The numerator of the indicator indicates the level of losses and informs on the magnitude of the problem.
A greater efficiency of the food supply chain also has implications for all producers whether looking at efficiency in large-scale or small-scale producers for export or in small-scale production units relevant for poverty and food insecurity reduction goals.
The Food Loss Index measures the changes in food loss over time, covering five food groups along the supply chain. This indicator complements the indicator Food Waste as both indicators look to divide the food value chain and measure the efficiency of the food system.
The scope of the Food Loss Index starts on the production site with post/harvest/slaughter/catch operations up to but not including the retail level, in line with the Food Balance Sheets conceptual framework. Pre-harvest losses are out of scope and harvest losses can be included in the index at the country level only (Figure 2 .15).

Data availability
Food losses data collection occurs through FAO’s annual Agriculture Production Questionnaire in May every year. Loss data is released in FAOSTAT in December every year.
At national level, the main data providers are the National Statistical Offices (NSO) and the statistical units of the Ministry of Agriculture/Livestock. Data sources for agricultural production and on-farm losses are mainly annual national agricultural surveys, and in the absence of direct measurements, data are interview-based. Agricultural census, which FAO recommends conducting every ten years, may be the only available source of loss estimates in a number of countries that do not carry out annual surveys. Off-farm loss data along the value chain may be obtained through specialized surveys (supplemented by research) through the national agri-food industry system.
Utilizations of interest here are those quantities destined for, among others, animal feed, for industrial uses (e.g. biofuel production), for national/enterprise/farm stocks, for seed (sowing for the successive agricultural cycle) – to be able to infer on quality and economic losses, that are not covered by the definition and data collection, and to assess the overall data consistency in the validation phase.
Limitations in the use of the indicator
Food losses are an extremely complex phenomenon to measure because they are multi-dimensional and data collection is costly, that is the reason why the major limitation in its use is due to data unavailability.
This indicator is particularly challenging because it requires data along the whole supply chain. The most appropriate data sources would be an ensemble of surveys, however, most countries lack the capacity and resources to carry out this exercise. A suite of statistical and modelling tools combined where possible with administrative records will have to be used.
Regarding indicator’s scope, the index scope was reduced for international comparability purposes to exclude harvest losses, which are critical at the production stage. Moreover, the index covers only two commodities in each food group, because requesting regular loss data for a larger number of products would be a difficult and unsustainable exercise for most countries. The index monitors only quantitative losses. Qualitative and economic losses that are also very relevant but not measurable in a consistent manner are out of the scope of the indicator.
Definitions
“Completely exit the production/supply chain means one of the following end destinations: landfill, controlled combustion, sewer, litter/discards/refuse, co/anaerobic digestion, compost/aerobic digestion or land application” (United Nations, SDGs metadata).
“Food is any substance – whether processed, semi-processed, or raw – that is intended for human consumption. Food includes drink, any substance that has been used in the manufacture, preparation, or treatment of food. Food also includes material that has spoiled and is therefore no longer fit for human consumption. It does not include cosmetics, tobacco, or substances used only as drugs”. (United Nations, SDGs metadata).
“Food loss is defined as all the crop and livestock human-edible commodity quantities that, directly or indirectly, completely exit the post-harvest/slaughter production/supply chain by being discarded, incinerated or otherwise, and do not reenter in any other utilization (such as animal feed, industrial use, etc.), up to, and excluding, the retail level. Losses that occur during storage, transport and processing, also of imported quantities, are therefore all included. Losses include the commodity as a whole with its non-edible parts decrease in edible mass at the production, post-harvest and processing stages of the food chain” (Food and Agriculture Organisation of the United Nations 2022).
“Harvest/slaughter/catch refers to the act of separating the food material form the site of immediate growth or production” (United Nations, SDGs metadata).
“Pre-harvest constitutes the time frame between maturity and harvesting” (United Nations, SDGs metadata).
Calculations
The indicator Food Loss Index (FLI) is a fixed-based index, computed as a ration of Food Loss Percentages in the current year and the Food Loss Percentages in the base year according to the following formula:
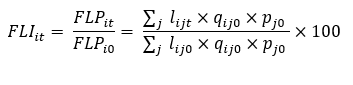
- Where:
- FLPit is the average food loss percentage of the country in the current year,
- FLPio is the average food loss percentage of the country in the base year,
- i: country,
- j: Commodity,
- t: year, 0 is the base year
- lijt is the loss percentage (estimated or observed) of commodity j in country i in year t,
- qijo are the production quantities of commodity j in country i in the base period,
- pjo is the average international price of commodity j (at international $) in the base period
For the FLI and FLP, the weights are the value of production at international dollar prices. The weight is fixed in the reference year.
Commodity Coverage
The index covers five food groups and two commodities within each group (10 key commodities set) by country. The five food groups correspond, according to the Central Product Classification (CPC) 2.1 to:
- Cereals & Pulses
- Fruits & Vegetables
- Roots & Tubers and Oil-bearing crops
- Animal products
- Fish and fish products
Cross-country comparisons are possible at the group level, while the key commodities within groups can differ across countries. This is to ensure that the index is relevant to the countries while providing some degree of international comparability.
The default selection criterion for the commodities is to rank them by their value of production within each country and commodity group. The default process is to:
- Compile value of production for every commodity
- Sort the commodities by group and rank them
- Select the top 2 in each group
The default selection process is based on value of the commodity in international dollar prices in the base period. At national level, countries can use their own set of values, quantities, or prices, or use different policy-based criteria, as long as the main headings are covered.
Data collection methods
A range of data collection methods can be used to collect data on food losses. It is recommended to use sample surveys to ensure statistically representative, accurate, and comparable estimates especially when the sector is characterized by a large number of small actors (for example, smallholders). Countries that already have a farm survey can add a post-harvest loss (PHL) module for the purpose of cost-efficiency.
Food loss data collection can be interview-based (subjective approach) or measurement-based (objective approach), the former method is less costly but leads to under-estimation.
It is recommended to carry out loss surveys every three to five years, with smaller in purpose surveys in between based on declarations, as loss ratios tend to be stable, from one year to the next under normal conditions. The recommendation is also to add a loss module to existing surveys. The data collection calendar will therefore follow the calendar of the main survey.
To establish the baseline, it is recommended to carry out two or three consecutive comprehensive PHL surveys to establish a first solid set of preliminary estimates. This is because estimates limited to a single year have a higher risk of being biased because of the occurrence of specific events (e.g., that are weather-related), as compared to estimates based on two- or three-year averages.
Food loss percentage
The FLI covers losses at the national level from production to the retail stage. Using the index notation, the percentage losses of each commodity are the lijt where:
lijt is the loss percentage (estimated or observed) of commodity j in country i year t
When loss estimates are available separately for the various stages of the value chain, they need to be aggregated into an overall percentage with the following simplified and standardized supply chain:
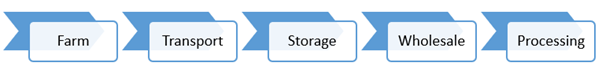
It is expected that the losses at each stage of the value chain are nationally representative.
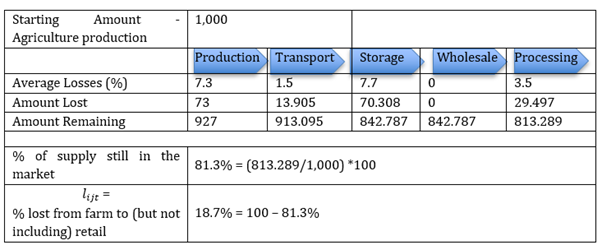
The overall percentage of production that does not reach the retail stage (lijt) can be obtained with the simplified process below, illustrated in Table 2. 3:
- Set a Starting Amount of product, 1,000 tonnes in the example
- Compile the Amount Lost at each stage by multiplying the Average Losses (%) of that stage to the reference quantity. The reference quantity is 1,000 at the Production stage; in the other stages the reference quantity is the Amount Remaining from the previous stage.
- Compile the Amount Remaining at each stage by subtracting the Amount Lost from the Amount Remaining of the previous stage.
- Compile the percentage of supply still in the market at the end of the chain as the ratio of the last Amount Remaining and the Starting Amount.
- Compile the loss percentage of the commodity lijt as the difference between the 100 and the % of supply still in the market.
Additional information about quantification methods is available at Food Loss+Waste Protocol (2016) Food Loss and Waste Accounting and Reporting Standard and Food Loss+Waste Protocol (2016) Guidance on FLW Quantification Methods. Two online tools have also been developed in 2016 by the Food Loss+Waste Protocol and are available here Sample Reporting Template for FLW Standard and FLW Quantification Method Ranking Tool.
Food loss index
There are three tabs that have to be used to calculate the Food Loss Index. The loss percentage by commodity tab of the workbook needs to be populated with the name of the chosen commodities for each group and the estimated loss percentage as previously described.

Next, in the production quantities by commodity tab, users will enter data on production quantities for each commodity for 2005 (base year fixed by the FAO). The name of each commodity will automatically appear.

Finally, users will insert data in the price of commodities tab. The price for 2005 (base year fixed by the FAO) can be entered in the local currency or in international dollars. In the first case, only national comparisons will be possible while in the second case comparisons at an international level will allow for better analysis of the country situation regarding food loss.

The Food Loss Index tab will automatically calculate the average food loss percentage by commodity, the average food loss percentage of the country and the Food Loss Index. The Food Loss Index will be calculated using the year 2005 as a baseline year. Users can modify the formulae and change the baseline according to their needs. Ideally, users shall select a base year against which to set targets and track performance over time.
