

2.a.9 National recycling rate, tons of material recycled
General information
This indicator of circular economy corresponds to the SDG 12.5.1 National recycling rate, tons of material recycled.
The presented methodology for this indicator is based on UNSD Metadata for 12.5.1, UNEP’s step-by-step guide: SDG Indicator 12.5.1: National recycling rate, tons of material recycled and UNEP’s Global Chemicals and Waste Indicator Review Document (2021).
SDG target 12.5 aims to substantially reduce waste generation through prevention, reduction, recycling and reuse. Indicator 12.5.1 National recycling rate, tons of material recycled has four indicators in total, one Level I, three Level II indicators (see Table 2. 12).25
| LEVEL I INDICATOR | |
| National recycling rate | (Material recycled + material exported for recycling – material imported for recycling) / total waste generated (with gap filling for regional and global aggregates) |
| LEVEL III INDICATORS | |
| Total Waste Generated (excluding construction, mining and agriculture) by type, including e-waste | This is the denominator for recycling and useful for understanding the target 12.5 on waste reduction |
| National recycling rate by type of waste, including e-waste (other possible disaggregation include, metals and packaging waste) | Based on national data sources, including disaggregation of the recycling rate |
| Waste intensity | Waste generated divided by domestic material consumption (DMC) (as an indicator of waste reduction) |
Indicator interpretation
Minimizing waste generation and maximizing the recycling of waste is central to the concept of circular economy or sustainable consumption and production. National recycling rate is part of measuring progress towards circular economy, by better understanding the recycling rate by type of material and equipping policymakers with evidence-based information to develop targeted policies. Assessing the recycling rate also helps countries identify their dependency on raw material (extraction, import, export) and influence policies on recycling capacity expansion.
However, recycling rates do not capture prevention, reduction, reuse and repair. Calculating additional intensity indicators against Domestic Material Consumption and Material Flows gives proxies and helps connect this indicator to resource efficiency in consumption and production.
Currently, the total amount of produced materials that are recycled are estimated to be low (based on academic literature). When countries better understand how waste is generated, collected and recycled, it will enable them and other stakeholders to better determine how to deal with major waste streams, for example e-waste or plastic.
Data availability
The data sources for this indicator are national governments, including national statistical offices and ministries/agencies responsible for the environment.
National data is collected through the UNSD/UNEP Questionnaire on Environment Statistics (waste section). After data validation procedures (through country validation and desk research), data are made available on UNSD’s environment statistics database. Data reported to the Basel Convention can be included as part of SDG reporting. As of October 2024, the following data sets were available:
- Proportion of municipal waste recycled (%), for 2000-2021 (depending on country), national scale
- Municipal waste recycled (tonnes), for 2000-2021 (depending on country), national scale
- Electronic waste recycling (tonnes), for 2010-2020, global, regional and national scales
- Electronic waste recycling, rate (%), for 2010-2019, global, regional and national scales
- Electronic waste recycling, per capita (kg), for 2010-2020, global, regional and national scales
Data on the amounts of waste generated can be obtained in the following ways:
- Collecting data from waste generators themselves either through regular reporting or special surveys
- Collecting data from waste management facilities (for example, municipal waste authorities)
- By type of material especially for high value recyclables, such as non-ferrous metals, ferrous metals, various packaging wastes, as these wastes tend to be treated by material
At a national level, quantity of materials recycled and materials exported for recycling is relatively easy to collect from large facilities and customs authorities.
A common way to improve waste data is to carry out surveys or measurements for a sample of waste generators belonging to a specific category. Data can be obtained from a sample of waste generators if insufficient resources are available to allow data collection from all waste generators. Several tools that provide information on ways to estimate waste generation and recycling rates are available. For example:
- Waste Wise Cities Tool – Step by Step Guide to Assess a City’s MSMW Performance through SDG indicator 11.6.1 (Refer to Monitoring Step 4 which provides a questionnaire for recyclers to compile data and calculate total amount of waste recycled).
- UNEP, Basel Convention, Methodological Guide for the Development of Inventories of Hazardous Waste and Other Wastes under the Basel Convention (Refer to Chapter 6 on methods for estimating waste generation) and is available in Arabic, Chinese, French, Russian and Spanish.
- Eurostat: Manual on Waste Statistics, A handbook for data collection on waste generation and treatment (refer to Chapter 3.1. on data collection on waste generation)
Limitations in the use of the indicator
While prevention, reduction, reuse, repair are important aspects of reducing material consumption and waste, they are difficult to measure. A challenge in measuring this indicator is identifying the stage in the recovery process when waste stops being waste, and qualifies as a resource is not clear cut.
In addition, data on waste are often collected at the municipal level which can lead to a rural data gap. As well, even though it plays a key role, it is difficult to obtain data on activities of the informal sector.
Definitions
“The domestic material consumption (DMC) is an output of economy-wide material flow accounts (EW-MFA)” (UNEP’s step-by-step guide: SDG Indicator 12.5.1: National recycling rate, tons of material recycled).
“Electronic waste, or e-waste, refers to all items of electrical and electronic equipment (EEE) and the parts that have been discarded by the owner as waste without the intent of re-use” (United Nations, SDGs metadata).
“Material recycled (in tonnes) is the amount reported at the last entity in the recycling chain, preferably when the material is bought as secondary resource to be used in production facilities. It excludes secondary mineral materials used in the construction sector” (UNEP’s step-by-step guide: SDG Indicator 12.5.1: National recycling rate, tons of material recycled).
Municipal waste is defined differently in different countries, but it generally includes all waste handled by a municipal waste management system. “MSW includes waste generated from households, commerce and trade, small, businesses, office buildings and institutions (schools, hospitals, government buildings). It also includes bulky waste (e.g. white goods, old furniture, mattresses) and waste from selected municipal services, e.g. waste from park and garden maintenance, waste from street cleaning services (street sweepings, the content of litter containers, market cleansing waste), if managed as waste. The definition excludes waste from municipal sewage network and treatment, municipal construction and demolition waste.” (United Nations, SDGs metadata).
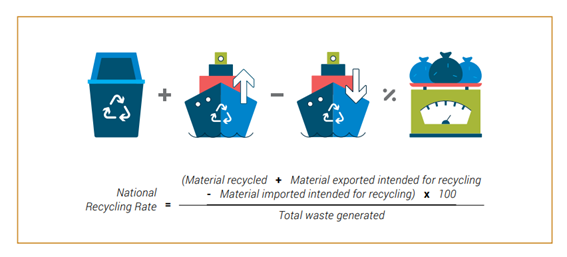
“The National Recycling Rate is defined as the quantity of material recycled in the country plus quantities exported for recycling minus material imported intended for recycling out of total waste generated in the country National recycling rate can be presented by type of waste, such as e-waste, plastic waste, and municipal waste” (United Nations, SDGs metadata).
“Recycling is defined as any reprocessing of waste material that diverts it from the waste stream, except reuse as fuel. Reprocessing as the same type of product and for different purposes are included. Recycling within industrial plants, such as at the place of generation, is excluded. Composting is considered recycling while recycling within industrial plants, such as at the place of generation, is excluded. For hazardous waste, to be consistent with Basel Convention reporting and maintain correspondence with the EUROSTAT reporting system, recovery operations R2 to R12 listed in Basel Convention Annex IV, are considered as ‘Recycling’” (UNEP’s step-by-step guide: SDG Indicator 12.5.1: National recycling rate, tons of material recycled). It also “includes co-digestion/anaerobic digestion and composting/aerobic process, but not controlled combustion (incineration) or land application” (United Nations, SDGs metadata).
“The total waste generated is the total amount of waste (both hazardous and non-hazardous) generated in the country during the year. It excludes non-metallic minerals (including construction and mining waste from the municipal waste stream), and agriculture waste. It also excludes waste from waste management activities (ISIC 38) as counting these would lead to double counting” (UNEP’s step-by-step guide: SDG Indicator 12.5.1: National recycling rate, tons of material recycled).
“The waste intensity of production is the total waste generated divided by domestic material consumption (DMC) for a particular year. It is an indicator of waste reduction. Waste intensity is a relative measure of waste generated to DMC – the lower the intensity of waste generated, the less waste created for each unit of material consumption” (UNEP’s step-by-step guide: SDG Indicator 12.5.1: National recycling rate, tons of material recycled).
Calculations
National recycling rate
To calculate the recycling rate, first calculate the total waste generated, the amount recycled, exported and imported for recycling. The following formula explains how the different variables are used to calculate the national recycling rate.
The National recycling rate tab of the workbook will then display the results based on the data input in the other worksheets.
Total waste generated (excluding construction, mining, agriculture and waste management activities) by type, including e-waste
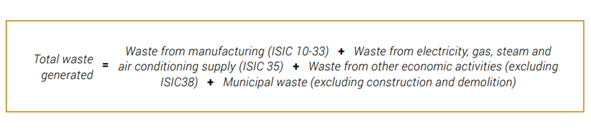
Once the values of Waste from manufacturing (ISIC 10-33), Waste from electricity, gas, steam and air conditioning supply (ISIC 35), Waste from other economic activities (excluding ISIC 38) and Municipal waste (excluding construction and demolition) are inserted, the following formula explains how the different variables are used to calculate total waste generated.
There are two tabs that can be used to calculate the total waste generated. The Waste generation tab compiles information using the categories found in the UNSD/UNEP questionnaire on Environment Statistics (see Figure 2. 52). The HW generation Basel tab compiles information using waste streams as defined by the Basel Convention (see Figure 2. 53). Use the e-waste management tab to compile information on e-waste generated, collected and recycled (see Figure 2. 54).


Total e-waste recycled
As e-waste recycled is reported separately, use the e-waste management tab to fill in the available data on e-waste (Figure 2. 53). The sheet is divided into categories:
- E-waste generated
- E-waste collected
- E-waste recycling rate, and
- Total e-waste recycled
Users will insert data in the e-waste generated and e-waste collected categories. The tab is embedded with formulae that will automatically calculate the e-waste recycling rate and the total e-waste recycled.
Once users fill in the waste generation tab, HW generation Basel tab, e-waste management tab, Waste recycled tab and Waste recycled-Basel tab, the national recycling rate tab will be populated with the calculated rate. This is done automatically to facilitate the calculations of the indicator.

Note: when data is inserted, some cells might turn red. When cells turn red, it is because some inserted data is not correct. For instance, if e-waste collected is larger than e-waste generated, the cells will turn red to alert users to double check the error.
National recycling rate by type of waste, including e-waste
Use the Waste recycled tab to provide information on amounts of waste going to recycling, and imported or exported for recycling each year in groupings used in the UNSD/UNEP questionnaire (Figure 2. 55). For Basel Convention groupings, use the Waste recycled Basel tab (Figure 2. 56). The national recycling rates will appear in the National recycling rate by type tab (Figure 2. 57).


Note: When data are inserted in the Excel file tabs, some cells might turn red. This is to alert users to possible inconsistencies or errors that need to be verified.
Waste intensity: waste generated divided by DMC

To calculate waste intensity, enter the amount of DMC in the National recycling rate tab under the appropriate table (Figure 2. 58).
The UNEP compiler can be used to develop an MFA and an estimate of the DMC (Refer to SDG Indicator 8.4.2/12.2.2 Domestic Material Consumption).

25 Level I indicators are regularly produced by countries for at least 50 per cent of countries and of the population in every region. Level II indicators are those where data are not regularly produced by countries.