

2.a.6 Proportion of municipal waste (MSW) collected and managed in controlled facilities out of total municipal solid waste generated, by cities
General information
This indicator corresponds to the SDG indicator 11.6.1 on the proportion of municipal solid waste (MSW) collected and managed in controlled facilities out of total municipal waste generated, by cities.
The presented methodology is based on the UNSD Metadata for 11.6.1, UNEP’s Global chemicals and waste indicator review document (2021) and UN-Habitat’s Metadata on SDGs Indicator 11.6.1. Indicator category: Tier II. UN Habitat (2020).
SDG target 11.6 aims to reduce, by 2030, the adverse per capita environmental impact of cities, including paying special attention to air quality and municipal and other waste management. Indicator 11.6.1 Proportion of municipal solid waste collected and managed in controlled facilities out of total municipal waste generated, by cities has four indicators in total, one Level I, one Level II indicator and two level III indicators (see Table 2. 6)10.
|
LEVEL I INDICATOR Proportion of MSW collected and managed in controlled facilities out of total MSW generated, by cities |
Modelled data based on available data (e.g. World Bank’s What a Waste 2.0, UNSD/UNEP Questionnaire on Environment Statistics, Wasteaware Benchmark Indicators, etc.). |
|
LEVEL II INDICATOR Proportion of MSW collected and managed in controlled facilities out of total MSW generated, by cities |
Reported data in line with the concepts and definitions provided by UN-Habitat’s Waste Wise Cities Tool. |
|
LEVEL III INDICATORS Proportion of MSW collected out of total MSW generated, by cities |
Proportion of MSW collected out of total MSW generated by cities is disaggregated from the level II indicator. |
| City Plastic Leakage | City Plastic Leakage can be obtained through the application of Waste Flow Diagram (GIZ, 2020), a rapid and observation-based assessment tool which visualizes the MSW flows and quantifies plastic leakage to the water system. |
Additional disaggregation
This indicator can be disaggregated at various levels in accordance with the country’s policy information needs. For instance:
- Disaggregation by location (intra-urban)
- Disaggregation by source of waste generation e.g. residential, industrial, office, or MSW material received by recovery facilities
- Disaggregation by type of final treatment and disposal
- MSW generation rate by income level (high, middle, low)
- MSW generation rate in different cities
Indicator interpretation
Urban households and businesses produce substantial amounts of solid waste that must be collected regularly, recycled or treated and disposed of properly to maintain healthy and sanitary living conditions. Many cities are increasingly facing solid waste management challenges due to rapid urbanization, lack of technical and financial capacity or low policy priority. In addition, the higher the income level of a city, the greater the amount of solid waste produced. Therefore, the economic growth to be experienced in the developing and emerging countries will pose greater challenges in solid waste management to local governments in the next decades11.
The adverse environmental impact of uncollected waste in a city is significant. Poor MSW collection and management trigger severe threats to public health and pollute air and water. Uncollected and mismanaged solid waste can end up in drains leading to blocked drainages and floods, is a main source of marine plastic pollution, and cause unsanitary conditions that have direct health impacts on residents. Open burning of uncollected waste produces pollutants that are highly damaging locally and globally. Vectors such as mosquitos usually breed in blocked drainages, which contributes to flooding. In 2015, the Global Waste Management Outlook estimated that at least 2 billion people do not have access to regular waste collection. This is particularly worse in informal settlements.
The global scale of urbanization and economic growth are creating a potential “time-bomb” regarding waste the world generates. If not addressed now, the significant negative impact on human health and the environment will be felt by nations at all levels of development. An estimated 2 billion tonnes of municipal solid waste (MSW) were generated in 2016, and this number is expected to grow to 3.4 billion tonnes by 2050 under a business-as-usual scenario (World bank, 2018). Uncontrolled disposal sites are already a major source of Greenhouse Gases (GHG). If the world continues on the current path, the waste sector, particularly food waste, is predicted to account for 8-10% of global anthropogenic GHG emission by 2025. Additionally, every year at least 8 million tonnes of plastic find its way into the world’s oceans (Jambeck et al., 2015).
Many developing and transitional country cities still have an active informal sector and micro-enterprise recycling, reuse and repair; often achieving recycling and recovery rates comparable to those in developed countries, resulting in savings to the waste management budget of the cities. There is a major opportunity for cities to build on these existing recycling systems, reducing and improving some unsustainable practices to protect and develop people’s livelihoods, and to reduce further the costs of cities to manage residual wastes. Promoting this indicator can also help the formalization of the informal sector in the process of increasing the portion of ‘solid waste with adequate discharge’.
This scarcity of evidence-based data hinders the development of waste management strategies and constrains investment decision-making in infrastructure and service expansion, leading many countries to have insufficient or absent MSW management services. Having data about MSW management is basic for helping cities and countries to better manage resources, mitigate and prevent environmental pollution, create business, employment and livelihood opportunities, and shift towards a circular economy.
In this context of a circular economy, measuring the progress of the performance of a city’s municipal solid waste management system provides critical information for cities and countries to establish better waste and resource management strategies, including planning and implementing steps. An integrated solid waste management system is strongly connected to three dimensions: urban environmental health, the environment and resource management. Moreover, a regular solid waste management strategy is a clear indicator of the effectiveness of a municipal administration. Good waste governance that is inclusive, financially sustainable and based on sound institutions is one of the key challenges of the 21st century, and one of the key responsibilities of a city government.
Data availability
The data sources for this indicator are national governments, including national statistical offices and ministries/agencies responsible for the environment.
National data is collected through the UNSD/UNEP Questionnaire on Environment Statistics (waste section). After data validation procedures (through country validation and desk research), data are made available in UNSD’s environment statistics database. Data reported to the Basel Convention can be included as part of SDG reporting.
MSW data is available through What a Waste 2.0 by World Bank (World Bank, 2018), the UNSD/UNEP Questionnaire on Environment Statistics and UN-Habitat CPI. These have key MSW data on key MSW data such as MSW generation, MSW generation rate, MSW collection rate, etc., but the aspect of ‘controlled management’ is missing.
For those variables relevant to this indicator which are collected via the UNSD/UNEP Questionnaire, data for up to 120 cities are available for multiple years (municipal waste collected). For other relevant variables, for a given year, data for 30 to 60 cities may be available. In the case of the variable “municipal waste generated” (collected for the first time in 2018), data are available for 20 cities.
Reliable data and information on MSW generation and management is limited globally, especially in low- and middle-income country settings where waste data is often produced based on international estimates, without validation by national entities using actual data.
Data on amounts of waste can be obtained through:
- Collecting data from waste generators themselves either through regular reporting or special surveys
- Collecting data from waste management facilities (for example, municipal waste authorities)
- By type of material especially for high value recyclables, such as non-ferrous metals, ferrous metals, various packaging wastes, as these wastes tend to be treated by material type
At a national level quantity of materials recycled and materials exported for recycling is relatively easy to collect from large facilities and customs authorities.
A common way to improve waste data is to carry out surveys or measurements for a sample of waste generators belonging to a specific category. Data can be obtained from a sample of waste generators if insufficient resources are available to allow for data collection from all waste generators. Several tools that provide information on ways to estimate waste generation and recycling rates are available. For example:
- Waste Wise Cities Tool – Step by Step Guide to Assess a City’s MSMW Performance through SDG indicator 11.6.1 (Refer to Monitoring Step 4 which provides a questionnaire for recyclers to compile data and calculate total amount of waste recycled).
- Eurostat: Manual on Waste Statistics, A handbook for data collection on waste generation and treatment (refer to Chapter 3.1. on data collection on waste generation)
- UNEP, Basel Convention, Methodological Guide for the Development of Inventories of Hazardous Waste and Other Wastes under the Basel Convention (Refer to Chapter 6 on methods for estimating waste generation) and is available in Arabic, Chinese, French, Russian and Spanish.
Limitations in the use of the indicator
In general, developed countries have good MSW data collection systems. For middle- and low-income countries the collection of data, such as the amount of waste managed in controlled facilities, remains a challenge for many national and local governments. The judgement on the adequacy of treatment and disposal of all the waste management facilities, including composting, recycling, incineration facilities in a city, requires a high level of technical capacity and large investment in human resources.
Data on formal MSW collection and management data may be available from municipal entities and/or private contractors. Informal MSW collection and management data may be available from NGOs and community organizations. It is important that all data sources are used for reporting, otherwise discrepancies in forms and guides used are likely to introduce inconsistencies in reported figures. Discrepancies are also likely to arise where geographical jurisdictions are not well marked out for service providers and facilities that manage collected waste.
Definitions
“Disposal means any operation whose main purpose is not the recovery of materials or energy even if the operation has as a secondary consequence the reclamation of substances or energy” (United Nations, SDGs metadata).
“Disposal Facilities refer to sites which are regularly used by the public authorities and private collectors, regardless of their level of control and legality, to dispose of waste. Such sites may or may not have an official recognition, a permit or a license. Disposal sites may be managed in either a controlled or uncontrolled manner. The definition excludes other unrecognized places where waste is deposited occasionally in small amounts, which public authorities may organise clean ups to remove the waste from these sites” (United Nations, SDGs metadata).
“Incineration is the controlled combustion of waste with or without energy recovery” (United Nations, SDGs metadata).
“Incineration with Energy Recovery is the controlled combustion of waste with energy recovery” (United Nations, SDGs metadata).
“Formal waste management relates to waste management activities undertaken by units working within the context of the formal governmental or non-state actors regulating and operating waste management; that is, organisations or individuals registered as economic units with government authorities and assumed to generally abide by local laws and regulations related to wastes and their management” (United Nations, SDGs metadata).
“Informal waste management, recycling and recovery refers to waste management and recovery activities undertaken by individuals, economic units, or enterprises which are not sponsored, financed, recognised, supported, organised or acknowledged by the formal solid waste authorities, or which operate in violation of or in competition with formal authorities (Scheinberg et al., 2010). Informal units are assumed to abide by local waste-related laws and regulations when it is in their interests to do so” (United Nations, SDGs metadata).
“Landfill is the deposit of waste into or onto land. It includes specially engineered landfill sites and temporary storage of over one year on permanent sites. The definition covers both landfills at internal sites, i.e. where a generator of waste is carrying out its own waste disposal at the place of generation, and at external sites” (United Nations, SDGs metadata).
“Material Recovery Facility (MRF; or materials reclamation facility, materials recycling facility, multi re-use facility) is a specialized recovery facility that receives, separates and prepares recyclable materials for marketing to further processors or end-user manufacturers” (United Nations, SDGs metadata).
“Mechanical Biological Treatment (MBT) facilities are a type of recovery facility that combines an MRF with a form of biological treatment such as composting or anaerobic digestion” (United Nations, SDGs metadata).
“Municipal solid waste managed in controlled facilities refers to MSW collected and transported to recovery and disposal facilities with basic, improved or full control according to the Ladder of waste management facilities’ control level (Table 2. 7). The Ladder can be used as a checklist for assessing the level of control of a particular recovery or disposal facility. The facility can identify the level of control depending on the level where most boxes are checked. Note that the emphasis is on operational control rather than engineering/design. A facility that is constructed to a high standard but not operated in compliance with Level 3 (or above) standard is not regarded as a controlled facility” (United Nations, SDGs metadata).
| Control level | Landfill site | Incineration with energy recovery | Other recovery facilities |
|---|---|---|---|
| Full Control |
- Waste daily covered - Waste compacted - Site fenced and full 24-hour control of access - Properly sited, designed and functional sanitary landfill - Leachate containment and treatment (naturally consolidated clay on the site or constructed liner) - Landfill gas collection and flaring and/or utilization - Site staffed - Post closure plan - Weighing and recording conducted - Protection of workers’ health and safety |
- Built to and operating in compliance with current national laws and standards including stringent stack and GHG emission criteria - Emission controls are conducted compliant to environmental standards and results of tests are accessible and transparent to citizens/users - Fly ash managed as a hazardous waste using the best appropriate technology - Weighing and recording conducted - A strong and robust environmental regulator inspects and monitors emissions - Protection of workers’ health and safety |
- Built to and operating in compliance with current national laws and standards - Pollution control compliant to environmental standards - Protection of workers’ health and safety - The nutrient value of biologically treated materials utilized for separate organic waste (e.g. in agriculture/horticulture) - Materials are extracted, processed according to market specifications, and sold to recycling markets - Weighing and recording of incoming loads conducted - All outgoing loads registered by weight and type of destination |
| Improved Control |
- Waste periodically covered - Waste compacted - Site fenced and control of access - Leachate containment and treatment - Landfill gas collection (depending on landfill technology) - Site staffed - Weighing and recording conducted - Provisions made for workers’ health and safety |
N/a |
- Engineered facilities with effective process control - Pollution control compliant to environmental standards - Protection of workers’ health and safety - Evidence of materials extracted being delivered into recycling or recovery markets. - Weighing and recording of incoming and outgoing loads conducted |
| Basic Control |
- Some use of cover - Waste compacted - Sufficient equipment for compaction - Site fenced and control of access - No fire/smoke existence - Site staffed - Weighing and recording conducted - The slope of the landfill is stable, landslides not possible - Provisions made for workers’ health and safety |
- Emission controls to capture particulates - Trained staff follow set operating procedures - Equipment maintained - Ash management carried out - Weighing and recording conducted - Provisions made for workers’ health and safety |
- Registered facilities with marked boundaries - Some environmental pollution control - Provisions made for workers’ health and safety - Weighing and recording of incoming and outgoing loads conducted |
| Limited Control |
- No cover - Some compaction - Some equipment for compaction - Some level of access control/fencing - No leachate control - Some fire/smoke existence - Site staffed - Weighing and recording conducted - The slope of the landfill is unstable with high possibility of a landslide |
N/A |
- Unregistered facilities with distinguishable boundaries - No environmental pollution control - No provisions made for workers’ health and safety - Weighing and recording conducted |
| No Control |
- No cover - No compaction - No/ limited equipment - No fencing - No leachate control - Fire/smoke existence - No staff - The slope of the landfill is unstable with high possibility of a landslide |
- Uncontrolled burning - No air/water pollution control |
- Unregistered locations with no distinguishable boundaries - No provisions made for workers’ health and safety - No environmental pollution control |
“Municipal Solid Waste Collected refers to the amount of municipal waste collected by or on behalf of municipalities, as well as municipal waste collected by the private sector. It includes mixed waste, and fractions collected separately for recovery operations (through door-to-door collection and/or through voluntary deposits)” (United Nations, SDGs metadata).
“Municipal Solid Waste Generated is the sum of the amount of municipal waste collected plus the estimated amount of municipal waste from areas not served by a municipal waste collection service” (United Nations, SDGs metadata).
Municipal waste is defined differently in different countries, but it generally includes all waste handled by a municipal waste management system. “Municipal Solid Waste includes waste generated from households, commerce and trade, small businesses, office buildings and institutions (schools, hospitals, government buildings). It also includes bulky waste (e.g. white goods, old furniture, mattresses) and waste from selected municipal services, e.g. waste from park and garden maintenance, waste from street cleaning services (street sweepings, the content of litter containers, market cleansing waste), if managed as waste. The definition excludes waste from municipal sewage network and treatment, municipal construction and demolition waste”. (United Nations, SDGs metadata).
“The proportion of the population with access to basic municipal solid waste collection services is the proportion of the population who receive waste collection services that are either basic, improved or full, defined by the service ladder of MSW collection service. It considers aspects of frequency, regularity and proximity of the collection points” (United Nations, SDGs metadata) (See Table 2. 8).
| Service level | Definition |
|---|---|
| Full |
- Receiving door-to-door MSW collection service with basic frequency and regularity and MSW is collected in three or more separate fractions; or - Having a designated collection point within 200m distance served with basic frequency and regularity and without major littering and MSW is collected in three or more separate fractions |
| Improved |
- Receiving door-to-door MSW collection service with basic frequency and regularity and MSW is collected in a minimum of two, separate fractions (e.g. wet and dry fractions) - Having a designated collection point within 200m distance served with basic frequency and regularity and without major littering and MSW is collected in a minimum of two, separate fractions (e.g. wet and dry fractions) |
| Basic |
- Receiving door-to-door MSW collection service with basic frequency and regularity or - Having designated collection point within 200m distance served with basic frequency and regularity |
| Limited |
- Receiving door-to-door MSW collection service without basic frequency and regularity; - Having a designated collection point within 200m distance but not served with basic frequency and regularity; or - Having designated collection point in further than 200 m distance. |
| No Control | - Receiving no waste collection service |
| Note: Basic frequency and regularity: served at least once a week for one year | |
“Recovery means any operation the principal result of which is waste serving a useful purpose by replacing other materials which would otherwise have been used to fulfil a particular function, or waste being prepared to fulfil that function, in the plant or in the wider economy” (United Nations, SDGs metadata).
“Recovery facilities include any facility with recovery activities defined above including recycling, composting, incineration with energy recovery, materials recovery facilities (MRF), mechanical biological treatment (MBT), etc.” (United Nations, SDGs metadata).
“Recycling is defined under the UNSD/UNEP Questionnaire and further for the purpose of these indicators as “Any reprocessing of waste material in a production process that diverts it from the waste stream, except reuse as fuel. Both reprocessing as the same type of product, and for different purposes should be included. Recycling within industrial plants i.e., at the place of generation should be excluded”. For the purpose of consistency with the Basel Convention reporting and correspondence with EUROSTAT reporting system, Recovery operations R2 to R12 listed in Basel Convention Annex IV, are to be considered as ‘Recycling’ under the UNSD/UNEP Questionnaire reporting for hazardous waste.
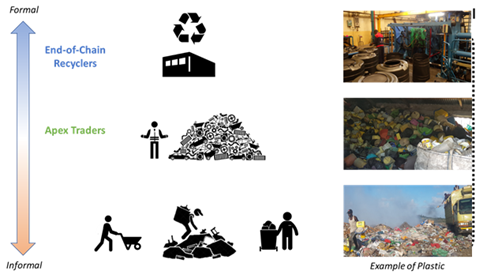
Recycling value chain usually involves several steps of the private recycling industry which purchase, process and trade materials from the point a recyclable material is extracted from the waste stream until it is reprocessed into products, materials or substances that have market value. In many low and low-to-middle income countries, this involves informal waste pickers, many middlemen, traders, apex traders and end-of-chain recyclers.
Apex traders collect recyclable materials from different sources and suppliers (in different cities across municipal or even national boundaries) and supply them to different end-of-chain recyclers (sometimes after pre-processing such as sorting, washing and bailing).
End-of-chain recyclers purchase recyclable material from suppliers such as apex traders and reprocess it into products, materials, or substances that have market value” (United Nations, SDGs metadata).
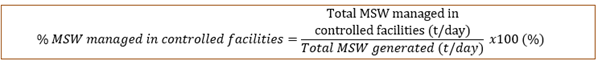
Calculations
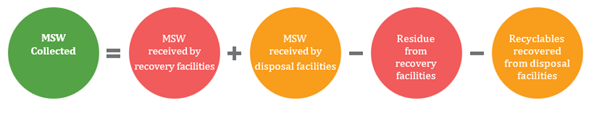
The proportion of municipal solid waste collected and managed in controlled facilities out of total municipal waste generated, by cities, is calculated as follows:
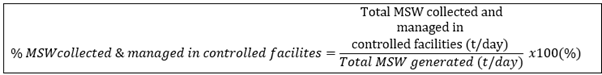
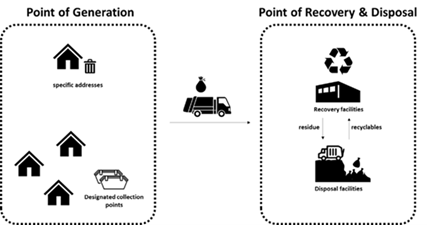
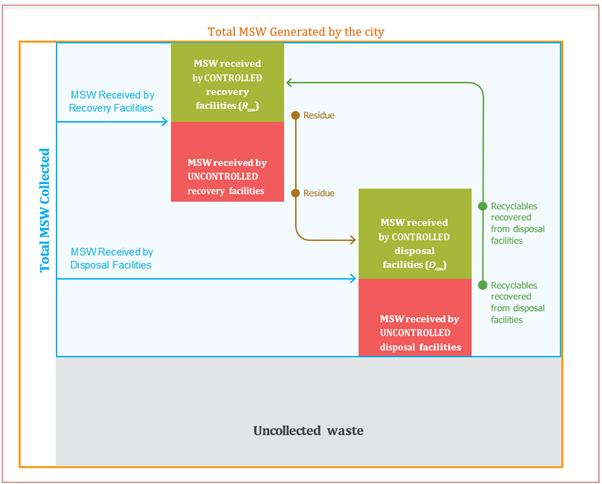
Figure 2.28 summarizes the elements measured by SDG indicator 11.6.1. The MSW generated by the city is either collected or uncollected, and the collected MSW is delivered to recovery or disposal facilities. Recovery facilities generate residues that are sent to disposal facilities. In many cities, recyclables are also recovered from disposal facilities and brought back into the recycling value chain. Recovery or disposal facilities can be categorized as either ‘controlled’ or ‘uncontrolled’ depending on the operational measures put in place to minimize the environmental, health and safety impacts from the facilities. When both recovery and disposal occur within the same facility, it is necessary to evaluate the control level of the recovery and disposal operations independently of each other.
Level I indicator
Global modeling based on the available data (e.g. World Bank’s What a Waste 2.0, UNSD/UNEP Questionnaire 2020 on Environment Statistics, Wasteaware Benchmark Indicators, etc.) can be conducted and made available for countries and cities who have neither reliable data nor resources to conduct the survey on the ground as guided by the Waste Wise Cities Tool (UN-Habitat, 2021).
Level II indicator
It is recommended to report data if reliable data is available. When reliable data is unavailable, cities and countries are recommended to conduct a survey to measure this indicator, along with the steps provided by the Waste Wise Cities Tool.
|
The Waste Wise Cities Tool consists of seven steps to guide cities on how to collect data on MSW generated, collected, and managed in controlled facilities. The tool provides a household survey guide for estimating total MSW generation, a questionnaire to investigate the MSW recovery chain and criteria to check the environmental control level of waste management facilities in the city. In the last step, the link to other waste related SDGs and the Waste Flow Diagram methodology to estimate potential plastic leakage from a city’s MSWM system is highlighted. The steps a city needs to implement can be determined depending on the data available. UN-Habitat recommends that cities go through all the steps, if the city has large amounts of uncollected waste or illegal dumping and has never done a Waste Amounts and Composition Survey (WACS) from households to estimate waste generation per capita, or if such a survey is more than 5 years old. In this context, it is important to understand that the waste received at recovery and disposal facilities sometimes does not represent the total MSW generated, especially in cities with large amount of uncollected waste. Cities that are confident about the accuracy of their total MSW generation data, are recommended to go through Steps 4 and 5 to identify the environmental and operational control level of their waste management facilities. Detailed methodological steps and sub-steps are represented in the Waste Wise Cities Tool. 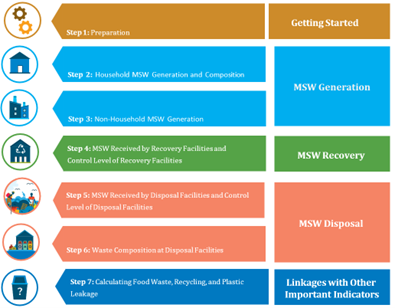 |
For Level II indicator, the data points required to calculate this indicator include:
- Total MSW generated in the city (tonnes/day)
- Total MSW collected in the city (tonnes/day)
- Total MSW managed in controlled facilities (tonnes/day)
Level III indicator
Two sub-indicators can be used with varying policy implications:

Data collected for SDG indicator 11.6.1 can also be used to estimate a city’s plastic leakage when combined with additional field observations, guided by the Waste Flow Diagram (WFD) (GIZ, 2020).

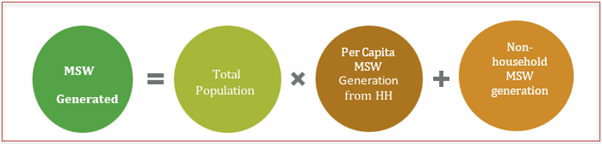
Total MSW generated in the city (tonnes/day)
For cities that do not have reliable data on MSW generation, it can be estimated through the multiplication of the total population and per capita MSW generation from the household. Detailed methodology for this is provided in Steps 1, 2 and 3 in the Waste Wise Cities Tool (UN-Habitat, 2020).
MSW does not include waste from municipal sewage networks and treatment facilities, as well as construction and demolition waste from commercial buildings contractors.
The MSW generated tab compiles information about total population, the per capita MSW generated from households per day and the amount of MSW generated by non-households per day.

Total MSW collected in the city (tonnes/day)
Total MSW collected is the amount of MSW generated that is moved from the point of generation, such as specific addresses or designated collection points, to facilities where the waste is recovered or disposed.
When measuring total MSW collected, there is a risk of double counting concerning the residue or rejects from recovery facilities, and the amount of waste recovered from disposal facilities going to recovery. Therefore, these amounts need to be deducted from the sum of waste received by both recovery and disposal facilities. The residue from recovery facilities is assumed to either go to disposal facilities or other recovery facilities.
Steps 4 and 5 in the Waste Wise Cities Tool provide detailed methodology on how to collect this data if not available.
Note: MSW collected from recovery includes mixed MSW, commingled recyclables or recoverable fractions extracted from MSW (UNEP. 2021 Global chemicals and waste indicator review document)

Total MSW managed in controlled facilities (tonnes/day)
MSW managed in controlled facilities refers to MSW collected and transported to recovery and disposal facilities with basic, improved or full control according to the Ladder of waste management facilities’ control level presented in the definition section. The Ladder can be used as a checklist for assessing the level of control of a particular recovery or disposal facility. The facility’s control level is the category where the most checks are recorded (full, improved, basic, limited and none). Note that the emphasis is on operational controls rather than engineering/design control. A facility that is engineered and constructed to a high standard, but not operated in compliance with Level III (or above) standard is not regarded as a controlled facility. Steps 4 and 5 in the Waste Wise Cities Tool provide detailed methodology on the collection of this data if not available.
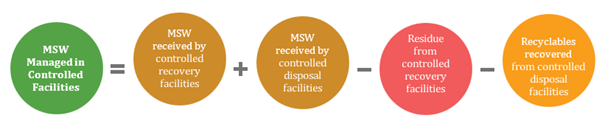
The MSW managed in controlled facilities tab compiles information about MSW received by controlled recovery and disposal facilities, residue received by controlled disposal facilities and recyclables recovered from controlled disposal facilities. The gray-shaded fields are calculated fields that provide the total MSW managed in controlled facilities per day automatically.

The Results tab of the workbook will then display the results of the proportion of MSW collected out of total MSW generated and the proportion of MSW collected and managed in controlled facilities out of total municipal waste generated, both by cities, based on the data input in the other worksheets.

Note: When data are inserted in the Excel file tabs, some cells might turn red. This is to alert users to possible inconsistencies or errors that need to be verified.
City’s plastic leakage
Level III indicator includes the city’s plastic leakage, that corresponds to the total amount of plastic leakage to water systems by number of inhabitants.
Users will insert data in total plastic leakage to water systems and population. The city’s plastic leakage tab is embedded with formulae that will automatically calculate the results.

Note: When data are inserted in the Excel file tabs, some cells might turn red. This is to alert users to possible inconsistencies or errors that need to be verified.
If information is available, there are three more very relevant MSW management data points that can be calculated. Although they are not part of the indicator’s calculation, these figures are of interest for city authorities:
- Per capita MSW generation rate
- MSW composition
- Uncollected waste
Per capita MSW generation rate
A very relevant parameter that can be derived from the previous formula is the “total per capita MSW generation rate”. Steps 2 and 3 in the Waste Wise Cities Tool explain how to calculate this through waste sampling from households for cities, if no reliable or updated data is available.
Data on per capita waste generation is especially recommended for cities where a large amount of MSW remains uncollected and also enables optimization of collection system performance, an exercise that can potentially generate significant budgetary savings for the city.
After entering data on population in the Results tab, the per capita MSW generation rate is calculated automatically.

Note: When data are inserted in the Excel file tabs, some cells might turn red. This is to alert users to possible inconsistencies or errors that need to be verified.
MSW composition
The SDG indicator 11.6.1 assessment determines the waste composition at the point of generation (i.e. households) and at the point of disposal. Understanding MSW composition at the beginning and end of the MSW service chain is a useful exercise for several reasons: (a) understanding waste composition helps identify how the existing recovery/recycling sector is functioning, (b) enables further recovery facilities to be identified and planned, and (c) helps to triangulate (i.e. test validity and reliability) of the collected data.
Note that MSW also includes waste from non-household sources. In Step 3 of the Waste Wise Cities Tool, the quantities of MSW generated from commercial and institutional sources, as well as from public spaces, is estimated. However, specific composition analysis on MSW from non-household sources is beyond the scope of this tool as it is complex and resource intensive.
Total uncollected waste
Total uncollected MSW can be calculated by subtracting the total MSW regularly collected from the total MSW generated.
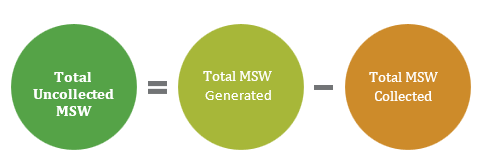
Once users fill in the MSW generated and MSW collected tabs, the uncollected waste will be calculated automatically to facilitate the calculations of the indicator.

Note: When data are inserted in the Excel file tabs, some cells might turn red. This is to alert users to possible inconsistencies or errors that need to be verified.
10 Level I indicators are regularly produced by countries for at least 50 per cent of countries and of the population in every region. Level II indicators are those where data are not regularly produced by countries.