

2.a.8 Proportion of hazardous waste treated, by type of treatment
General information
This indicator of circular economy corresponds to the SDG 12.4.2 (b) Proportion of hazardous waste treated.
The presented methodology for this indicator is based on UNSD’s Metadata for 12.4.2, UNEP’s step-by-step guide: SDG Indicator 12.4.2: Hazardous Waste Generation and UNEP’s Global Chemicals and Waste Indicator Review Document (2021).
SDG target 12.4 aims to achieve the environmentally sound management of chemicals and all wastes throughout their life cycle, in accordance with agreed international frameworks, and significantly reduce their release to air, water and soil to minimize their adverse impact on human health and the environment. Indicator 12.4.2 (b) Proportion of hazardous waste treated entails levels II and III indicators (see Table 2. 11). Level II corresponds to national data collected from countries and level III to additional information.
| Indicator 12.4.2 (b) | Proportion of hazardous waste treated, by type of treatment |
|
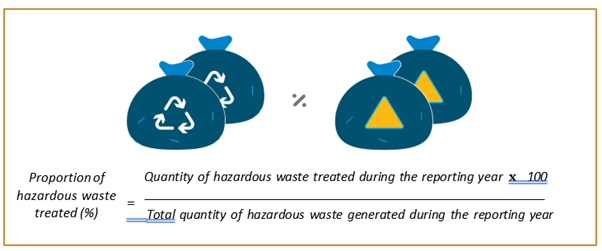
LEVEL II INDICATOR Proportion of hazardous waste treated |
Quantity of hazardous waste treated during reporting year / quantity of hazardous waste generated × 100 |
|
LEVEL III INDICATORS Environmentally sound treatment of own generated hazardous waste |
Related to the country capacity for sound treatment of own hazardous waste within the country and the capacity for treatment of hazardous waste from other countries. |
Additional disaggregation
Indicators described above can be further disaggregated depending on the country’s policy information needs. For instance:
- Disaggregation at sector level, by ISIC codes. Information on the treatment of hazardous waste could be collected from treatment/disposal facilities.
- Disaggregation by type of landfilling. As there is significant difference between landfilling in specialized, controlled and uncontrolled landfills, further disaggregation on this type of treatment could be analysed.
- Disaggregation by type of treatment per each generating sector.
- Disaggregation by type of recycling operation (R2 to R12 from Basel Convention Annex IV).
Indicator interpretation
Chemicals are part of everyday life. There are over 140,000 different substances used in all economic sectors globally and there is an increase in the complexity of products and unidentified hazardous components, and/or items which are not hazardous (laminates and multi-layer packaging), but present hazardousness in a variety of ways when improperly discarded and end up in air, water or are burned. The benefits of chemicals are many and so too are their potential to adversely impact human health and the environment if not properly managed.
All countries, especially middle- and low-income countries, are facing the complex challenge of managing hazardous waste according to international standards of good practice. The situation is complicated by limited human, financial and/or technical resources. As such, action is needed to support the sustainable use of chemicals and environmentally sound management of hazardous waste.
Data availability
At the global level, UNSD collects data from all countries (except those covered by the OECD/Eurostat Joint Questionnaire on Environment Statistics) through the UNSD/UNEP Questionnaire on Environment Statistics (waste section). UNSD carries out extensive data validation procedures that include built-in automated procedures, manual checks and cross-references to national sources of data. Communication is carried out with countries for clarification and validation of data. Only data that are considered accurate or those confirmed by countries during the validation process are included in UNSD’s environment statistics database and disseminated on UNSD’s website24. Data on proportion of hazardous waste treated by each type of treatment are disseminated on UNSD’s website.
On a national level, data and information regarding hazardous waste management can be derived from hazardous waste collection operators, as well as treatment facilities and local/regional and national environmental protection agencies. Depending on national obligations for record keeping and reporting, the extent of the data available might vary at country level.
Data collection on hazardous waste management is usually done by the competent authorities designated under the Basel Convention (submission of annual reports in fulfilment of the Convention’s obligations) or by national statistics offices in terms of data aggregation, as an overarching organism which links to national/regional authorities, be it environmental agencies, environmental ministry, commerce and trade authorities, etc.
Hazardous waste management statistics involve many national and sub-national stakeholders which may create discrepancies. To address these possible discrepancies, inter-institutional stakeholder collaboration is always encouraged.
Information on exported/imported hazardous waste is generally available through the customs office. As compelled by the Basel Convention, this type of information is generated through the designated authorities, as they are responsible for receiving notifications of transboundary movements and any related information and for responding to such notifications (Article 2).
Limitations in the use of the indicator
Data on hazardous waste treatment may be scarce in some countries, due to a series of factors, such as: lack of, or insufficient, policies and regulations on management and/or reporting; limited human, financial and technical resources within government agencies and/or lack of clear disclosure and reporting rules and requirements. Some countries may have the data and monitoring systems needed to report, while for others there is a need for training and capacity development to enhance data collection, validation and reporting capacity.
Data on illegal waste collection, illegal trade, and illegal dumping or deliberate leakage into the environment are difficult to capture. An effective record mechanism would require the integration of data from the environmental regulator (e.g. for illegal dumpsites) and from law enforcement (e.g. for illegal trade).
Meanwhile, the informal and semi-formal sectors, including waste picking and recycling by the informal private sector, all of which are especially relevant to the situation in developing countries, are difficult to measure because, in most countries, they are unregulated and operate without oversight. Hence, data collection disaggregated by sex and age for the informal waste sector is particularly difficult; however, essential in understanding gender-related imbalances and burdens. Gender equal employment practices in the waste management sector are incremental to achieve the 2030 Agenda (UNEP, 2019).
Limitations in terms of usable data for calculating the indicator(s) may arise due to misunderstanding of the terminology used in the indicator or discrepancies between these definitions and the definitions included in national legislation. This can lead to inconsistencies in reported values and difficulties in cross-checking reported data. For example, through national legislation, countries may define additional types of waste to be considered hazardous beyond the waste streams defined in the Basel Convention. By having inconsistent grouping of types of waste, creating comparable data between states becomes incredibly challenging.
Inconsistencies in reporting figures may also arise from the way data is reported and then aggregated. In some cases, hazardous waste is reported by volume, with no indication of density. As a result, estimations and assumptions must be made to convert the units. These estimations and assumptions must consider a series of factors which can affect the actual weight of waste, such as moisture content variation with season, degree of pre-processing (crushing/compacting), etc.
Statistical data on imports and exports and production statistics use different classification (for international trade statistics Combined Nomenclature (CN) codes are subject to annual changes, but the Harmonized System (HS Nomenclature) is renewed every five years). Statistical code systems for material flows (CN codes, CPA) and for waste (EWC-Stat codes) are not always comparable. For improved information on the relationship between the inflow of materials and the materials reaching waste management, the method needs to be improved. When semi-manufactured and finished products are to be aggregated into material flow categories, a definition of the materials incorporated needs to be done. To what extent can this information be taken from the CN codes is not always clear.
Definitions
“Hazardous waste is waste with properties capable of having a harmful effect on human health or the environment and is regulated and controlled by law. Hazardous waste may come in many forms, including liquids, solids, gases and sludge. They can be discarded as commercial products, like cleaning fluids or pesticides or the by-products of manufacturing processes, from Basel Convention (Article 1, paragraph 1(a)). Waste listed in Annex VIII of the Basel Convention is presumed to be hazardous, while waste listed in Annex IX is presumed not to be hazardous. For the purpose of this indicator, due to comparability reasons, additional waste considered hazardous as per national definitions, as provided by the Basel Convention under Article 1, paragraph 1(b), are excluded.” (United Nations, SDGs metadata).
“Hazardous waste treated is hazardous waste treated during reporting year, per each type of treatment (recycling, incineration with/without energy recovery, landfilling or other), including exports and excluding imports”. Waste treated and type of treatment are not defined in the Basel Convention. In this context, “treatment” will include all operations included under Annex IV of the Basel Convention, namely “Disposal” operations D1 to D15 and “Recovery” operations R1 to R13. This is also linked to the definitions of “Recycling, Incineration, Incineration with energy recovery, Landfilling and other types of treatment or disposal” (United Nations, SDGs metadata).
Level II – Proportion of hazardous waste treated
The proportion is calculated by dividing the quantity of hazardous waste treated during the reporting year, including exports and excluding imports, to the total quantity of hazardous waste generated during the same year.
To calculate the proportion of hazardous waste treated, the first step is calculating the total quantity of hazardous waste treated during each year by adding quantities of hazardous waste treated, for each type of treatment (recycling, incineration with/without energy recovery, landfilling or other), including exports and excluding imports.
Use the hazardous waste management tab of the workbook to introduce the data needed to calculate the total quantity of hazardous waste treated. This tab also allows users to calculate the stocks of hazardous waste at the end of each year, once users fill in the information about hazardous waste stocks at the beginning of the year and the amount of hazardous waste imported and exported.

The hazardous waste treated tab of the workbook will automatically show the proportion of hazardous waste treated once users fill in hazardous waste treated or disposed of during the year and the total hazardous waste generated.

Note: When data is inserted, some cells might turn red. When cells turn red, it is because some inserted data is not correct.
Level III – Environmentally sound treatment of own generated hazardous waste
The environmentally sound treatment of own generated hazardous waste is an indicator which would give insight into countries’ capacity for sound treatment of own hazardous waste within the country and the capacity for treatment of hazardous waste from other countries.
This indicator includes the following sub-indicators:
-
Country capacity for sound treatment of own hazardous waste within the country: This sub-indicator highlights countries that have developed enough capacity for the treatment of hazardous waste in an environmentally sound manner and focuses on the capacity to treat the country’s own generated waste. This sub-indicator represents the quantity of waste treated in an environmentally sound manner within a country out of the total hazardous waste generated within the country. This indicator includes hazardous waste exports and excludes hazardous waste imports.
Granted that hazardous waste might be stored for a period of time prior to being treated, this sub-indicator will be increasingly useful over long periods of time, to allow for waste which is generated during a year but treated in the following year(s) to be reflected in the data. It should be noted that treated quantities should only be reported when actual treatment takes place. To avoid double counting situations or reductions in weight following treatment operations, waste quantities should be counted when first entering the waste treatment process/cycle.
This is consistent with the reporting process on the UNSD/UNEP Questionnaire on Environment Statistics (waste section), in which, after entering the waste treatment process, waste is considered as being generated by the waste management sector (ISIC 38) and hence, as per Table R1 of the questionnaire, should be excluded.
- Country capacity for treatment of hazardous waste from other countries: This sub-indicator aims at highlighting countries that have developed enough capacity for the treatment of hazardous waste in an environmentally sound manner and are able to treat hazardous waste from other countries, in addition to their own waste. This sub-indicator only considers imported waste.
-
Hazardous waste exported to be treated in an environmentally sound manner: The reason for calculating this sub-indicator is that a high number of developing countries do not have in-country capacity for treating hazardous waste. However, they may make efforts to export this waste for treatment in an environmentally sound manner in another country. In some countries, such as small island states, it might also be impractical to have hazardous waste treatment facilities within the country, as economies of scale might be difficult to achieve.
It is a general assumption that all hazardous waste exported for treatment is treated in an environmentally sound manner, as transfer of hazardous waste is governed by the Basel Convention, which a considerable number of countries are parties to.
Considering that the alternative is simple landfilling, or possibly open dumping/burning, efforts of countries which take these measures are, as such, acknowledged.
In the Environmentally sound treatment of hazardous waste tab, enter the national capacity for the sound management of hazardous waste and the three sub-indicators will be automatically calculated (Figure 2. 50).

24 UNSD/UNEP Questionnaire on Environment Statistics https://unstats.un.org/unsd/envstats/qindicators