

2.a.3 Circular material use rate
General information
The Circular Material Use (CMU) rate is an indicator of circular economy. As there was no single summary indicator for the circularity of the economies at macroeconomic level, Eurostat developed the CMU rate as the indicator for the EU monitoring framework for the circular economy. This indicator, also called “Circularity rate”, measures the contribution of recycled materials towards the overall use of materials. It is part of the European Union Sustainable Development Goals (SDGs), and it is available at Eurostat (2018)4.
Additional disaggregation
It is possible to consider a breakdown of CMU rate by material categories (biomass, metals, non-metallic minerals and fossil energy materials). More information about the definition of each category is provided in the following section entitled “Definitions”. An analysis by material category will allow identifying their specific potential for reuse, recovery or recycling.
Indicator interpretation
Alone the amount of material re-fed into the economy measured in absolute terms does not necessarily represent the circularity of an economy. The amount of secondary material re-fed might increase at the same pace as the overall amounts of materials. In that case, the circularity of the economy does not increase although the amount of re-fed materials does. The CMU rate is the indicator that will be used to represent this aspect of the economy.
A higher CMU rate value means that more secondary materials substitute for primary raw materials thus reducing the environmental impacts of extracting primary material. This indicator measures both the capacity of a country to produce secondary raw materials and its effort to collect waste for recovery. In a closed economy, with no imports or exports, both are one and the same. However, in reality, countries are open economies with flows of imports and exports of waste collected in one country but treated and recycled in another one. In that case, the production (of secondary raw materials) and collection effort (of waste for recycling) in one country may not be the same.
In terms of interpretation, CMU rate measures a country’s effort to collect waste for recovery, including waste collected in the country and later exported for treatment abroad. This perspective credits the country’s efforts to gather waste bound for recovery which indirectly contributes to the worldwide supply of secondary materials and hence avoidance of primary material extractions.
Data availability
The CMU rate indicator is based on official statistics, including waste statistics (generation, recovery and disposal of waste), Economy-Wide Material Flow Accounts (EW-MFA) and trade statistics. The CMU rate is available for EU countries from 20105.
Limitations in the use of the indicator
The CMU rate has to be always related to DMC, because improvement of the indicator can primarily be due to the decrease of the DMC or the improvement of the amounts of waste recycled.
The comparison of CMU rates across countries becomes only meaningful when the economic structure is considered. A mere ranking of countries according to the achieved rates is not very telling unless it is recognized that their economies have different structures and starting points (Eurostat, 2018, Circular material use rate, Calculation method).
Definitions
“Biomass is material of vegetable origin extracted by humans and their livestock – crops, used crop residues, fodder crops, grazed biomass, wood, capture of wild fish, and the biomass of hunted animals” (UNEP, 2024, Economy-Wide Material Flow. Step-by-step guide to the compiler).
Circular material use rate, also called 'Circularity rate', “measures in percentage the share of material recycled and fed back into the economy - thus saving extraction of primary raw materials - in overall material use. The Circularity rate is thus defined as the ratio of the circular use of materials (U) to the overall material use (M).” (Eurostat circular material use rate metadata). This indicator includes flows of materials, but it does not include flows of water. It includes flows of fossil fuels and energy products.
Circular use of materials is “approximated by the amount of waste recycled in domestic recovery plants (RCV_R), minus imported waste destined for recycling (IMPw), plus exported waste destined for recycling abroad (EXPw)”. (Eurostat circular material use rate metadata).
“Domestic Material Consumption (DMC) is a standard material flow accounting (MFA) indicator and reports the apparent consumption of materials in a national economy. DMC measures the total amount of material (biomass, fossil fuels, metal ores and non-metallic minerals) directly used in an economy and based on accounts of direct material flows, i.e., domestic material extraction and physical imports and exports”. (United Nations, SDGs metadata).
“Fossil fuels Includes coal and peat, crude oil, natural gas and natural gas liquids, and oil shale and tar sands” (UNEP, 2024, Economy-Wide Material Flow. Step-by-step guide to the compiler).
“Metal ores can best be thought of as those deposits of metal compounds in the Earth’s crust which can be processed to produce desired metals at an economically viable cost. Ore deposits will generally be rock, but in certain important cases can be special soils or sand deposits. Only the portion of the excavated rock which is to be processed in some way to obtain the desired metals is included in the accounts. Data is compiled in three ore categories: iron, aluminum, and other metal ores” (UNEP, 2024, Economy-Wide Material Flow. Step-by-step guide to the compiler).
“Non-metallic minerals are defined by the System of National Accounts 1993 as stone quarries and clay and sand pits; chemical and fertilizer mineral deposits; salt deposits; deposits of quartz, gypsum, natural gem stones, asphalt and bitumen, peat and other non-metallic minerals other than coal and petroleum” (UNEP, 2024, Economy-Wide Material Flow. Step-by-step guide to the compiler).
Overall material use “is measured by summing up the aggregate domestic material consumption (DMC) and the circular use of materials (M = DMC + U).” (Eurostat circular material use rate metadata).
“Waste recycled in domestic recovery plants comprises the recovery operations R2 to R11 as defined in the Waste Framework Directive 2008/98/EC”. (Eurostat circular material use rate metadata). It excludes energy recovery and backfilling.
Calculations
The CMU is defined as the ratio of the circular use of materials (U) to an indicator of the overall material use (M). It can also be defined as the amount of waste recycled in domestic recovery plants, minus imported waste destined for recovery, plus exported waste destined for recovery abroad.
The circular material use rate, measured as percentage of total material use, is calculated as follows:
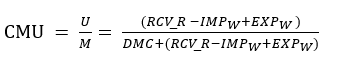
- Where:
- CMU: Circular Material Use rate
- U: use of materials
- M: Overall material use
- RCV_R: Amount of waste recycled in domestic recovery plants
- IMPw: Amount of imported waste bound for recycling
- EXPw: Amount of exported waste bound for recycling
- DMC: Domestic Material Consumption
To calculate the amounts of imported waste (IMPw) and exported waste (EXPw), Eurostat has identified the Combined Nomenclature codes (CN-codes) which can be considered trade in waste (see Annex 1 of Eurostat, 2018 for more details6).
To calculate CMU rate by material flow, data with the same classification breakdown are needed for all the components of the equation. DMC can be broken down by material category (biomass, metal ores, non-metallic minerals and fossil fuels). The challenge is to also break down the amount of waste recycled in domestic recovery plants, the amount of imported waste bound for recycling and the amount of exported waste bound for recycling.
As waste data are not usually reported by material flow, it is necessary to establish a correspondence between waste categories and the four main material flow categories. The following table shows the correspondence factors proposed by Eurostat.
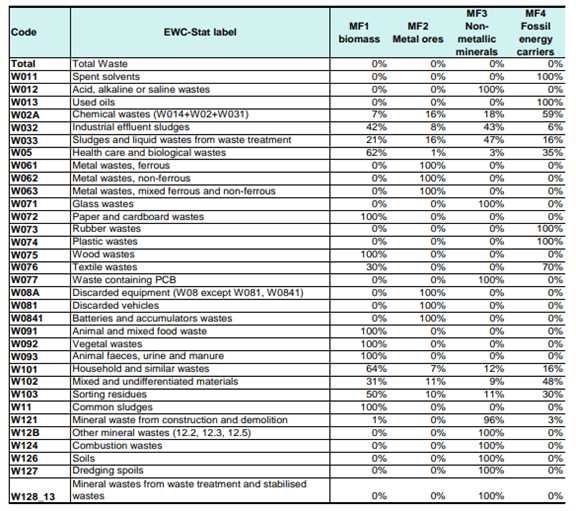
These conversion factors have the following caveats and limitations that have to be considered before applying them:
- The water content of the waste was ignored for the conversion. It may result in a bias for waste with high water content (e.g. for oil emulsions or for some chemical wastes). The impact is limited because the waste types concerned are less important in terms of quantities. The problem does not exist for categories such as industrial effluent sludges, common sludges and dredging spoils because these categories are usually reported in dry weight. This point should be verified for each country.
- All material components of a waste category are counted as recovered although the recovery process usually aims only at a part of material components. Accordingly, losses and the share of material components not recovered are not considered in the calculation.
- The conversion factors were based on German waste statistics. Considering that the amounts and types of waste that are recovered vary from country to country, this may hamper the application of the factors to other countries.
- In waste statistics, the amounts of metal waste refer to the pure metal whereas the DMC data refer to the metal ore. Data are thus not fully aligned.
To determine the CMU rate, first calculate the total amount of waste recycled in domestic recovery plants, the amount imported for recovery and the amount exported for recovery.
Use the Waste recycled tab to provide information on amounts of waste going to recycling, and imported or exported for recycling each year in groupings used in the UNSD/UNEP questionnaire (Figure 2. 9). For Basel Convention groupings, use the Waste recycled Basel tab (Figure 2. 10) (Refer to indicator National Recycling Rate).


The UNEP compiler can be used to develop an MFA and an estimate of the DMC (for more information refer to indicator Domestic Material Consumption).
Enter the data of domestic extraction, direct imports and direct exports for each material category and the DMC by material category and the total will be calculated automatically.

As the sheets are linked together, the amount of waste recycled in domestic recovery plants and the amount imported and exported for recovery for each year inserted previously in the CMU rate tab of the workbook will appear in the CMU tab, as well as the DMC value for each year from the DMC tab. The use of materials (U), the overall material use (M) and the CMU rates will be calculated automatically.

Note: when data is inserted, some cells might turn red. When cells turn red, it is because some inserted data are not correct.
In case data for each material category are available, enter data in the CMU rate by material tab. Users will insert data on waste recycled in domestic recovery plants by material category, and the waste imported and exported bound for recovery by material category. The CMU tab will get the DMC value for each material category and each year from the DMC tab. The tab is embedded with formulae that will automatically calculate the use of materials (U) by material category, the overall material use (M) by material category and the CMU rate by material category.

Note: when data is inserted, some cells might turn red. When cells turn red, it is because some inserted data are not correct.