

2.a.5 Food waste index
General information
This indicator of circular economy corresponds to the SDG 12.3.1 (b) Food waste index.
The presented methodology for this indicator is based on UNSD’s Metadata for 12.3.1b, UNEP’s Global Chemicals and Waste Indicator Review Document (2021), and the Food Loss+Waste Protocol Food Loss and Waste Accounting and Reporting Standard (2016).
SDG target 12.3 aims to halve per capita global food waste at the retail and consumer levels and reduce food losses along production and supply chains, including post-harvest losses. Indicator 12.3.1 comprises two sub-indicators: 12.3.1a Food loss index and 12.3.1b Food waste index. The two sub-indicators cover discrete food value chain stages, but some overlap is possible at the interface of the manufacturing and retail stages (see Figure 2. 20).

Indicator 12.3.1b Food waste index has three indicators in total (see Table 2.4). Three levels of measurement are envisaged, to enable flexibility in respect to different policy priorities and capacities for data collection among countries. The proposed approach endeavours to balance fitness for purpose, in tracking progress at retail and consumer level, with feasibility of implementation in as many UN member countries as possible.
| LEVEL I INDICATOR Food waste estimates for each sector |
Existing data and extrapolation to other countries |
| LEVEL II INDICATOR Food waste generation tracked at a national level |
Direct measurement of food waste in retail, food service and households. Sufficiently accurate for tracking. |
| LEVEL III INDICATOR Additional information and disaggregation of food waste data |
Additional information to inform policy and other interventions. This includes disaggregated data by destination, edible/inedible parts, and also captures manufacturing food loss not covered by the Food Loss Index (e.g. where more than one commodity is combined to produce complex food products). |
Indicator interpretation
A significant share of food grown for human consumption is never eaten. This inefficiency has significant economic, social and environmental impacts and is related to food insecurity.
In addition, the inedible parts associated with food (e.g. bones, rinds, pits/stones) can take up space in landfills, and contribute to greenhouse gas emissions during decomposition. These inedible parts represent a form of natural resource inefficiency (to the degree that behavioral or technological changes could transform some of them into food or other products of human benefit).
The 2030 Sustainable Development Agenda emphasized the importance of sustainable production and consumption systems as efficient food systems, on the supply side and the consumption side, contribute to food security and sustainability of natural resources since agriculture is a major user of land and water.
Food waste is related to economic loss and increased pressure on food systems. Reducing food waste is critical to maximizing the value of agricultural land and ensuring that natural resources are used in a sustainable way. This indicator will not only help countries to identify where the food is wasted but it can also provide information which governments, citizens, and the private sector can use to reduce food waste.
The indicator aims to measure the total amount of food that is wasted in tonnes. It complements the Food Loss Index, as both indicators look to divide the food value chain and measure the efficiency of the food system.
The Food Waste indicator is designed to enable a country to measure food waste, take actions to reduce food waste, and assess the impact of such actions. Ideally this would coincide with a national strategy on food waste reduction. Where countries do not have a national strategy, prioritization may be conducted using economic, environmental or social factors such as importance of the different food supply chain stages or impact of certain destinations (e.g., GHG emissions from landfills) on the economy. The flexibility is not intended for member countries to ‘game’ the system by focusing on an area where there is less waste. By focusing on areas of national environmental, social or economic importance, a country can align investment in this area with national priorities.
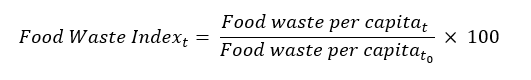
The food waste index is calculated for each sector within a country, so the level of food waste is expressed as an index relative to the level of food waste in the baseline year. A value of:
- 100 would indicate the same level of food waste in that sector as the baseline year; and
- 50 would indicate that food waste in that sector had halved since the baseline year, consistent with SDG target 12.3.
Data availability
The UNSD/UNEP Questionnaire on Environment Statistics: Waste Section has introduced a table focusing on the collection of Food Waste data as of 2024. The questionnaire is sent out every two years to National Statistical Offices and Ministries of Environment.
For each country, a single food waste focal point is nominated to coordinate data collection and reporting. The SDG Global Database, UNSD Environmental Indicators and UNEP’s Food Waste Index, will be used to publish food waste data at regular intervals up to 2030.
Data providers for this indicator are National Statistical Offices, relevant ministries and other organisations.
Limitations in the use of the indicator
The challenge resulting from the flexible three level methodological approach is one of consistency and comparability. Level I cannot be compared directly with Levels II and III without caveats, as the methodologies differ substantially. Level I data is not designed to track food waste over time in a country and should not be used to compare countries, as the data often originates from a few years ago or from other countries. Level II and III data however should enable comparison over time for a specific country, as well as comparison between countries with care, as the measurement of food waste becomes more established. Moreover, when good country coverage exists, levels II and III data can be aggregated to regional level.
Naturally, food waste data reported by countries entails uncertainties. These can come from random errors and systematic errors. Random errors can for example be sampling errors and are relatively easy to estimate, whereas systematic errors are harder to estimate and can arise by e.g. using a measurement method that systematically over-or under-estimate food waste. Countries should report the total estimated uncertainty related to their levels II and III food waste data, as a good practice and to ensure that comparisons between countries are only made when the degree of uncertainty is sufficiently small.
Additionally, there are a number of challenges related to the following:
- Variations in waste over time can have a significant impact on estimated quantities of waste when short studies (e.g. a week) are used to represent a longer time period (a year), either due to:
- The specific time of year when a study takes place which may affect the waste produced and contributes to a systematic error (it is useful to collect data during two different seasons e.g. rainy and dry seasons during one year, or to account for known variations if a study has been conducted at one time in the year);
- Natural variation over time in amounts of waste generated by single entities (e.g. households or restaurants), which contributes to random sampling error (it is useful to include a sufficient number of entities and measure over a sufficient length of time).
- Different methods of quantification can also be used for other relevant and related purposes (for example, “where are the greatest opportunities within the waste that is produced to reduce it?”). Taking households consumption as an example, it is difficult to obtain reasons for discarding food (and therefore the opportunities for influencing citizen behaviour) without the use of diaries or ethnography. However, direct weighing of waste volumes could give a significantly more accurate quantity.
- At a national level, countries may have to rely on other entities (e.g. waste management companies, municipalities, businesses generating food waste) to measure their own waste and report to the government, which would then be collated and analysed to estimate the total amount. How the data is collected would vary by food chain stage as the way food waste is generated in each stage varies. For example, a large formal retailer (supermarket chain) may keep records of stock unsold and discarded which could be reported. This effort can be supported by establishing clear guidance for these entities. On the other hand, a government requesting reporting from households may have to issue guidance to local municipalities and prescribe a quantification method, e.g. a food waste diary. The reported quantities may require scaling if a government cannot obtain reports from the entire population of the food chain stage, i.e. it is unlikely that every household in the country would report.
Definitions
“Animal feed consists in diverting material from the food supply chain (directly or after processing) to animals. It excludes corps intentionally grown for bioenergy, animal feed, seed, or industrial use” (UNEP, Global Chemicals and Waste Indicator Review Document).
“Bio-based materials/ biochemical processing is converting material into industrial products for food and non-food purposes. Examples include creating fibers for packaging material; creating bioplastics (e.g., polyactic acid); making “traditional” materials such as leather or feathers (e.g., for pillows); and rendering fat, oil, or grease into raw material to make products such as soaps, biodiesel, or cosmetics. “Biochemical processing” does not refer to anaerobic digestion or production of bioethanol through fermentation” (UNEP, Global Chemicals and Waste Indicator Review Document).
“Codigestion/ anaerobic digestion consists in breaking down material via bacteria in the absence of oxygen. This process generates biogas and nutrient-rich matter. Codigestion refers to the simultaneous anaerobic digestion of FLW and other organic material in one digester. This destination includes fermentation (converting carbohydrates—such as glucose, fructose, and sucrose—via microbes into alcohols in the absence of oxygen to create products such as biofuels)” (UNEP, Global Chemicals and Waste Indicator Review Document).
“Composting/ aerobic processes is breaking down material via bacteria in oxygen-rich environments. Composting refers to the production of organic material (via aerobic processes) that can be used as a soil amendment” (UNEP, Global Chemicals and Waste Indicator Review Document).
“Controlled combustion implies sending material to a facility that is specifically designed for combustion in a controlled manner, which may include some form of energy recovery. This may also be referred to as incineration or thermal treatment” (UNEP, Global Chemicals and Waste Indicator Review Document).
“Edible parts are parts of food that were intended for human consumption” (UNEP, Food Waste Index Report 2024. Think Eat Save: Tracking Progress to Halve Global Food Waste).
“Food is any substance – whether processed, semi-processed, or raw – that is intended for human consumption. Food includes drink, any substance that has been used in the manufacture, preparation, or treatment of food. Food also includes material that has spoiled and is therefore no longer fit for human consumption. It does not include cosmetics, tobacco, or substances used only as drugs. It does not include processing agents used along the food supply chain, for example, water to clean or cook raw materials in factories or at home”. (United Nations, SDGs metadata).
“Food waste (FW) is f is food and associated inedible parts removed from the human food supply chain in the following sectors: retail and other distribution of food; food service (restaurants, schools, hospitals, other canteens, etc.); and households. “Removed from the human food supply chain” means one of the following end destinations: landfill, controlled combustion, sewer, litter/discards/ refuse, co/anaerobic digestion, compost/aerobic digestion or land application” (United Nations, SDGs metadata). Figure 2. 21 shows the food waste scope and boundaries. It is important to note that animal feed and bioprocessed materials are not considered food waste as they do not enter the waste stream. Food waste includes edible parts and inedible parts.
“Inedible parts are components associated with a food that, in a particular food supply chain, are not intended to be consumed by humans. Examples of inedible parts associated with food could include bones, rinds and pits/stones. Inedible parts do not include packaging. What is considered inedible varies among users (e.g. chicken feet are consumed in some food supply chains but not others), changes over time, and is influenced by a range of variables including culture, socio-economic factors, availability, price, technological advances, international trade, and geography” (United Nations, SDGs metadata).

“Land application consists in spreading, spraying, injecting, or incorporating organic material onto or below the surface of the land to enhance soil quality” (UNEP, Global Chemicals and Waste Indicator Review Document).
“Landfill consists in sending material to an area of land or an excavated site that is specifically designed and built to receive wastes” (UNEP, Global Chemicals and Waste Indicator Review Document).
“Not harvested/ plowed-in is leaving crops that were ready for harvest in the field or tilling them into the soil” (UNEP, Global Chemicals and Waste Indicator Review Document).
“Other treatments include sending material to a destination that is different from the 10 listed in Figure 2. 21. This destination should be described” (UNEP, Global Chemicals and Waste Indicator Review Document).
“Refuse/discards/ litter is to abandon material on land or disposing of it in the sea. This includes open dumps (i.e., uncovered, unlined), open burn (i.e., not in a controlled facility), the portion of harvested crops eaten by pests, and fish discards (the portion of total catch that is thrown away or slipped)” (UNEP, Global Chemicals and Waste Indicator Review Document).
“Removed from the human food supply chain means one of the following end destinations: co/anaerobic digestion; compost/aerobic digestion; land application; controlled combustion; sewer; litter/discards/refuse; or landfill” (UNEP, Food Waste Index Report 2024. Think Eat Save: Tracking Progress to Halve Global Food Waste).
“Sewer/wastewater treatment implies sending material down the sewer (with or without prior treatment), including that which may go to a facility designed to treat wastewater” (UNEP, Global Chemicals and Waste Indicator Review Document).
Calculations
The food waste index is calculated according to the following approach:
- Where:
- t: year
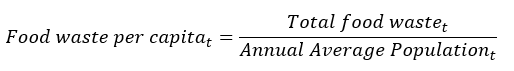
Total food waste is the sum of waste in three sectors in a given year as per the formula below:

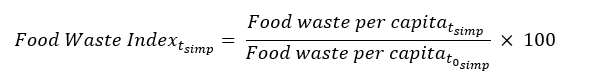
The Food Waste Index for the year in question is then calculated as food waste per capita in that year divided by food waste per capita in a baseline year (t0) multiplied by 100 to express the result as a percentage:
In countries where it is not possible to obtain the detailed data necessary to estimate total food waste using the formula above, a simplified approach to calculating food waste per capita may be taken:
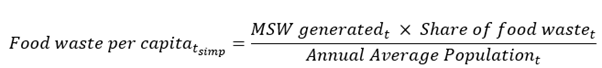
- Where:
- t: year
- MSW generatedt: total municipal solid waste generated in a given year (as calculated for SDG Indicator 11.6.1).
- Share of food wastet: proportion of total MSW made up of food waste in the year, which can be estimated from waste composition studies.
The food waste index for the year is then calculated using the simplified estimate of food waste per capita in the same formula as above:
Level I Indicator
Level I proposes a method to estimate food waste for countries not able to undertake their own measurement in the short term. The method involves a model and some other basic calculations. The approach uses existing country data, studies carried out by countries and extrapolations based on the estimates observed in other countries for countries where no estimates are available. Lastly, confidence ratings are assigned to the estimates. This work builds on existing efforts to compile information for SDG 11.6.1 on municipal solid waste management and will utilize existing data on global waste, including data from UN- Habitat on SDG 11.6.1 and from other available sources (such as the UNSD/UNEP Questionnaire on Environment Statistics). The model estimates the proportion of food in the total waste stream data and applies the proportion to the total.
Most of the Level I estimates are approximate and not sufficiently accurate for observing and tracking changes over time. However, they are sufficient to provide a snapshot of food waste generation at country level for the first time, insight into the scale of the problem, and make a case for action. They are intended as a short-term support while governments develop capacity for national measurement (consistent with Level II).
Level II Indicator
This level generates primary data on actual food waste generation that will show progress (or lack thereof) over time. For European countries, the reporting under level II includes data submissions on food waste required under the act of food waste (2019/1597).
Level II provides a framework for countries to measure and report food waste, enabling the tracking of progress in line with the SDG 12.3 target. It covers studies on food waste generation at the retail, household and food service stages of the food supply chain and provides guidance on accepted methodologies. If food waste is not yet measured or the information is not shared, conducting new measurement studies for all three sectors can be challenging and require a higher level of resources. Countries can therefore begin with one nationally relevant stage and complete all sectors over time. However, household food waste is recommended to be measured as a first step, as household food waste is suggested to be the largest source of food waste in most countries.
The amount of food waste within a stage of the food supply chain shall be established by measuring food waste generated by a sample of food business operators or households using any of the following methods or a combination of those methods or any other method equivalent in terms of relevance, representativeness, and reliability.

In addition, questionnaires, interviews, diaries and forms can be used to collate existing information. However, to obtain primary data in the above-mentioned sectors, these methods are not sufficiently accurate.
The Level II approach calls for studies on food waste at retail and consumer level, and anticipates separate studies on households and food service. Household consumption studies shall ensure women’s participation, as they play a central role in food management at the household level.
Accurate food waste measurement takes time and resources, but adequate data collection is possible with sufficient commitment, and tailored and targeted communication. For example, countries with confidence in their household waste collection infrastructure and statistics, such as the UK and Denmark, have commissioned specific food waste studies for that food chain stage.
Retail food waste may require a trusted confidential reporting system for formal retailers to feel comfortable sharing information. However, many companies are already publicly sharing data on food waste (e.g. several large international food retailers have recently published data publicly on The Food Waste Atlas7).
Informal sectors (in the food supply chain but also in the waste management industry) are more difficult to quantify and food waste estimates would require some idea of their size (e.g. number of informal food retailers and the quantity of food sold by them) alongside estimates of the proportion of food handled that is wasted, potentially a separate piece of work.
Food waste data is often based on calculations using existing related data. It could involve deducing the amount of food waste from quantities of related data (e.g. calculating the difference between food inputs and food outputs in a process such as food manufacturing) or using models (e.g. applying percentages to quantities of purchased food or by applying a series of coefficients to sociodemographic variables). The related data may have been sourced from a measurement activity to help form assumptions. Modelled data can provide high-level insight for tracking SDG 12.3.1b; however, this will be less useful for informing specific interventions or actions. As a rule, food waste models based on indirectly correlated data are not a replacement for measurement/tracking progress against a target; they can provide valuable information in a first instance about indicative amounts and areas of interest to help prioritise action.
The causes of food waste could also be collected to help develop solutions to tackle food waste. At home, kitchen diaries that allow people to record why they threw away an item can be undertaken. This can be supplemented with in-home observation and interviews (ethnography) to help understand the root causes. In business settings, quantitative information can be recorded with smart-bin technology or by scanning systems. Diaries can also be used. These can also be supplemented by observation, interviews, and on-site assessments / audits.
It would be useful to understand the food that enters a chain element (i.e. households) compared to the food waste from that supply chain element. For example, this would enable the analysis of the amount of food brought into the home (purchase data) and the percentage of food purchases that are wasted in the home. Similarly, for businesses, the amount of food waste could be compared to the amount of food entering the business. Adjustments may need to be made if the mass of items changes within the business (e.g. if chickpeas are dried, or pasta is cooked and absorbs water).
The following data collection tools, measurement techniques and leveraging of existing data sources applies to both levels II and III. As described above, level II covers food waste generation at retail and consumer level, whereas level III allows countries to report additionally at the manufacturing level and to gather disaggregated data on causes, types of foods wasted and destinations, to better inform policymaking.
Data collection tools
The following methods request data from others in varying forms and will require collation at least and potentially scaling to represent the total population/ food chain stage. If it is of appropriate quality and coverage, using existing data is generally more cost-effective for a country than undertaking new measurements.
- Diaries – a type of log where quantities of food discarded are recorded on a case-by-case basis daily. This can involve weighing or estimation/ approximation by the person filling in the log. For example, in a household setting, a respondent in a Mexican study may log discarding 3 tortillas on the first day or a respondent in Tanzania may log ‘a handful’ of ugali (staple foods in each country). The average mass of items for such reported measures would need to be used to convert the measure into grams.
- Surveys – a structured questionnaire to gather information from a large number of individuals or entities. A survey is most appropriate when the commissioner of such a method is confident in the ability of the respondent to accurately provide the data requested. This means that the respondent has already recorded the data and the survey is gathering it, rather than asking for a recollection or opinion. Practically, this invalidates surveying as a useful method for household food waste quantification as respondents are unlikely to have measured their waste and remember it accurately at time of asking. It is more appropriate for formal retailers, food service companies (restaurants etc.) and food manufacturers who may collect waste data as part of record-keeping activities (see below).
- Records – a collection of data that has been recorded and saved physically or virtually. These are often collected for reasons other than quantifying food waste (e.g. warehouse record books). For specific food chain stages, these may provide a relatively accurate picture of an organisation’s food waste. A non-perishable food wholesaler may keep records of any unsold stock that is discarded, representing its food waste if the stock records can be matched to the weight of food for each item in question.
Existing Data sources
It is possible that some of the data required to produce estimates of quantities of food waste already exist and are collected for other reasons. These will be useful data but often do not include information about the quantities of food waste. For example, registration of companies with the government can give an indication of number, size and type of business (e.g. restaurant vs. street vendor) to scale other data with.
- Manufacturing/processing: company registration data, factory records, stock keeping, purchase and sales ledgers, and waste management records/receipts (where charged by volume).
- Retail: (formal) company registration data, company records, stock keeping, purchase and sales records, waste contractor data; (informal) government surveys, academic surveys and studies.
- Food service: (formal) company registration data of restaurants, hospitals, schools etc., company records, purchase and sales records, waste contractor data; (informal) government surveys, academic surveys and studies.
- Households: household income and expenditure surveys on purchases, census data for population, number and type of household, waste collection company data, academic studies on generation and composition.
- Municipal Solid Waste: covering waste originating from households, commerce, and trade, food service, small businesses, office buildings and institutions (schools, hospitals, government buildings), as well as waste from park and garden maintenance and street cleaning services. This is consistent with the definition used in SDG 11.6.1.
Direct measurement and scaling
These methods are most useful for a reporting country which has decided to conduct a study into food waste within the set scope, usually for a representative sample, that can then be scaled to estimate the total quantity for that scope.
- Direct weighing: using a measuring device to determine the mass of food wasted. This could involve weighbridges for collection vehicles or simple scales in a household setting.
- Counting: assessing the number of discrete food items that have been discarded and using the result to determine the mass. This could include scanner data or simply counting bags of waste.
- Assessing volume: assessing the physical space occupied by the food waste and using the result to determine the mass. In a situation where the entire quantity of food waste is likely to have the same composition, for example a waste stream from commodity processing, the density of that waste is likely to be consistent. Therefore, a value for mass can be determined by applying the density of the waste to the volume it occupies, potentially something like a residue collection vat.
- Waste composition analysis: physically separating food waste from other material to determine its mass and composition. This can be the most accurate way to gain deeper understanding into the differences in material type (wasted food against inedible parts) and types or categories of food wasted. Thus, even in a separate food waste stream, this method has some utility to achieve a narrower scope or provide greater detail.
At the subnational level, these methods could be used by the subjects of interest to quantify their own waste, ready for collating using methods above. For example, a country may work with a few formal retailers and a research partner to conduct a month-long study of recording retail waste using scanner data which is then scaled to the whole sector (direct measurement and scaling). Conversely, a country legislates a requirement for all formal retailers to start collecting the data (potentially through scanners) and report in an annual survey.
A combination of methods may be suitable for certain scopes. For example, if household waste collection is very close to generation, direct weighing of waste and applying a weighted average of the composition can arrive at percentage that is food and/or inedible parts. However, this scope would exclude food composted at home and discarded via the sink or to a sewer system.
A full elaboration of data sources for each stage of the supply chain (manufacturing/processing, retail, food service and households) is described in Annex I.
The Level II approach requires a reporting country to:
- Define a scope – i.e., select the sector(s) they are going to select for reporting;
- Pick suitable method(s) to measure and report food waste within the sector(s);
- Conduct a study(ies) using the chosen method(s);
- Report food waste for the Food Waste Index;
- Repeat studies regularly using a consistent methodology.
It is recommended for countries to measure each sector at least once every four years. It is not necessary to conduct new measurements every two years or measure every sector simultaneously.
Choosing a scope
The process for defining a scope for Level II reporting against SDG 12.3.1b is similarly important to the method used to quantify food waste within that scope. In addition, once a broad scope is chosen (e.g. household waste only), specific techniques for data collection may be employed (these are included in Annex I).
Relevant measures for other purposes might already exist in a reporting country, such as for SDG indicator 11.6.1. Under this indicator, the proportion of municipal solid waste (MSW) collected and managed in controlled facilities out of the total municipal waste generated, by cities, is tracked. Data for this indicator can be provided by tracking the amount and composition of urban solid waste by compositional analysis of a range of sectors, including households, food retail and food service. The amount of food waste included in this data can be repurposed for the Food Waste Index.
It needs to be noted that the two indicators differ in geographic bounds: 12.3.1b (the Food Waste Index) covers the entirety of a country, while 11.6.1 solely covers cities. Introducing additional studies for rural areas or extending city-based studies to surrounding areas could be methods to overcome this difference.
In certain situations, it might be possible to report both SDG indicators with one set of fieldwork. Nevertheless, additional measurement is required if a considerable amount of food waste is not collected as part of the MSW collection system.
Boundaries
A member country will need to specify which of the following stages are included within their Level II estimate:
- Retail
- Households
- Food service
The inclusion of more than one stage within the scope’s boundaries may necessitate multiple studies and different methods for each stage chosen.
Choosing a method
As shown in Table 2. 5 above, appropriate measurement methods vary between sectors. The advantages and disadvantages of different methods are well documented in the Food Loss and Waste Accounting and Reporting Standard (Hanson et al., 2016). Up-to-date data that are accurate enough to allow tracking of food waste over time should be generated by the chosen measurement method(s). Obtaining other information at the same time can also help to reduce food waste in a country (e.g., on the types of food that are most frequently thrown away and the principal causes). More details on the most appropriate methods for each food supply chain stage is found in Annex I.
It may be necessary to conduct multiple studies applying different methods if more than one sector is included within the scope’s boundaries. The methods presented in Table 2. 5 are not only appropriate for government-funded studies, but also for individual businesses. In some situations, it might be necessary to apply more than one method in the same sector, for example if a business has food waste in two solid waste streams (one food waste only and one mixed residual).
To estimate the amount of food waste within a sector in a country, measurements shall be generated by a sample of businesses or households, which needs to be adequate in size and representativeness. Moreover, scaling will be required to obtain the estimate. Food waste agreements (or legislations) that require businesses to share data on the amount of generated food waste exist in some countries. These data can then be used for tracking purposes if the respective agreements allow.
Food waste generation by sector and at national level
At Level II indicator, when users enter the waste food by sector (retail trade, food service and households), total food waste generated will be automatically calculated.

Food Waste Index
Entering the population by year in the Food Waste Index Level II tab, food waste per capita and food waste index will be automatically calculated. The food waste index is calculated using the year 2000 as the baseline. Users can modify the formulae and change the baseline according to their needs. Ideally, users shall select a base year against which to set targets and track performance over time.

Note: When data are inserted in the Excel file tabs, some cells might turn red. This is to alert users to possible inconsistences or errors that need to be verified.
Level III Indicator
Level III provides additional information to inform national policy and decision-making, as well as other behaviour change interventions. In this level, disaggregation by destination, by edible and inedible food waste, and by manufacturing, as a fourth sector, is proposed for national consideration.
It is recommended where possible that food waste is disaggregated by edible parts (intended for human consumption) and inedible parts. Note that assumptions on what constitutes inedible parts vary across and within countries (sometimes even within households). Nicholes et al. provides a methodology that could be applied in different countries taking into account cultural differences8. The disaggregation by edible and inedible parts associated with food (e.g. animal bones, egg shells, fruit stones or pips) helps understand the amount of food waste which is unavoidable (e.g. if fresh eggs are purchased, then egg shells will need to be discarded), and how much is avoidable, in that it could have been prevented if better managed in the supply chain or the home.
As mentioned before, the level III framework also captures food waste in the manufacturing sector that is not covered by the Food Loss Index, e.g., where more than one commodity is combined to produce processed/complex food products.

Measuring both food waste and reuse by destination is important for understanding the best way to optimize food waste or food used for composting. The preferred scope would be the below and it would be useful to disaggregate the total food waste by these categories:
- Codigestion/anaerobic digestion,
- Composting/aerobic process,
- Controlled combustion,
- Land application,
- Landfill,
- Refuse/discards/litter,
- Sewer9,
- Home composted,
- Animal feed,
- Bio-material/biochemical processing.
Sewer/wastewater provides useful information for understanding food destinations. Countries may wish to include food discarded to sewer if this is an important destination in the country. As an example, the amount discarded to sewer (down the sink) can vary depending on disposal culture. In the UK, 23% of household food and drink waste in 2015 was discarded to sink or sewer (WRAP 2018).
Additionally, the food “surplus” destinations animal feed and biochemical processing are out of the scope of waste, but would capture food reuse and provide information which would be useful to understand the food system. The total amount of food waste and reuse will be greater than food waste measured under level II.
The choice of destinations may be influenced by the data available. For example, a hypothetical country wishes to report food waste comprising both food and inedible parts for the retail sector and has determined that the formal retail sector can provide records from stock and sales data. Using ‘inventory’ records however are unlikely to provide insight to determine where the material is sent. If information (whether through records or other means) does not exist about where material is sent by the retail sector, it may need to be removed from the two excluded destinations from the scope before reporting. Another factor to consider is that some destinations may not exist in the reporting member country e.g. codigestion/anaerobic digestion.

Additional disaggregation
The types of food thrown away provide useful insight for focusing effort and developing solutions to prevent waste. This can be performed at a high- level using categories such as fruit, vegetables or bakeries. More detailed information can be obtained by studying e.g., the type of fruit(s) wasted. Any level of details can be achieved via waste compositional analysis. In retail and food service settings, the use of scanning systems and / or smart bins can also provide this level of detail.
Disaggregation may also be useful based on geography, e.g., obtaining data for individual states, provinces, cities, or other areas within a country. This will help understand where efforts to reduce food waste need to be focused.
For similar purposes, countries may wish to undertake studies to understand the groups of businesses or people that waste disproportionately high or low levels of food waste or particular types of food. Taking household food waste as an example, this disaggregation may include understanding the variation by age, gender, income, levels, region, household composition, employment status, etc. Qualitative research, including interviews and observation, can be a useful measurement method.
This additional disaggregation creates a more complete picture of the food waste and food surplus status within a country, and the data can contribute to a national food waste prevention strategy.
8 Nicholes et al. Surely you dont eat parsnip skins? Categorising the edibility of food waste resources, conversation & recycling 147 (2019) 179-188
9 For more detail, please refer to page 40 of the FLWS (Hanson et al. 2016). Ploughed in/not harvested is a destination not applicable to food waste as it is only relevant at the production stage of the food chain.